Hypoalbuminaemia as a marker of trans-capillary leakage in community-acquired bacteraemia patients
- PMID: 29457576
- PMCID: PMC9134564
- DOI: 10.1017/S0950268818000274
Hypoalbuminaemia as a marker of trans-capillary leakage in community-acquired bacteraemia patients
Abstract
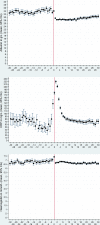
Community-acquired bacteraemia patients (n = 2472), Denmark, 2000-2008. Albumin, C-reactive protein (CRP) and haemoglobin (Hb) measured 2000-2010. We assessed daily mean levels of albumin, CRP and Hb from 30 days before to 30 days after bacteraemia and correlations between albumin vs. CRP and albumin vs. Hb. In linear regression models, we evaluated the contribution of CRP, Hb, chronic and acute variables to the albumin level variations. The mean albumin level (33.6 g/l) was steady before day 1, declined to 29.3 g/l on day 1 with little increase afterward. The mean CRP increased from day -5, peaked on day 1 and declined thereafter. The mean Hb level was fairly constant during days -30/30. Albumin was inversely (R range, - 0.18/-0.47, P < 10-4) correlated with the CRP level and positively (R = 0.17-0.46, P < 10-4) correlated with the HB level. In most models, CRP was the first variable that contributed to the albumin variations, 34-70% of the full model. The sudden decrease of albumin levels, without sudden fluctuations of CRP or Hb, indicated that hypoalbuminaemia was a marker of trans-capillary leakage.
Keywords: Bloodstream infections; Septicaemia.
Conflict of interest statement
None.
Figures


References
-
- Rothschild MA, Oratz M and Schreiber SS (1988) Serum albumin. Hepatology 8, 385–401. - PubMed
-
- Doweiko JP and Nompleggi DJ (1991) The role of albumin in human physiology and pathophysiology, Part III: Albumin and disease states. Journal of Parenteral and Enteral Nutrition 15, 476–483. - PubMed
-
- Doweiko JP and Nompleggi DJ (1991) Role of albumin in human physiology and pathophysiology. Journal of Parenteral and Enteral Nutrition 15, 207–211. - PubMed
-
- Hansson LO, Hedlund JU and Ortqvist AB (1997) Sequential changes of inflammatory and nutritional markers in patients with community-acquired pneumonia. Scandinavian Journal of Clinical and Laboratory Investigation 57, 111–118. - PubMed
MeSH terms
Substances
LinkOut - more resources
Full Text Sources
Other Literature Sources
Research Materials
Miscellaneous

