. 2018 Mar 1;122(8):2314-2322.
doi: 10.1021/acs.jpcb.8b00479. Epub 2018 Feb 19.

Assessing Interactions Between a Polytopic Membrane Protein and Lipid Bilayers Using Differential Scanning Calorimetry and Solid-State NMR

Affiliations

Assessing Interactions Between a Polytopic Membrane Protein and Lipid Bilayers Using Differential Scanning Calorimetry and Solid-State NMR

James R Banigan et al. J Phys Chem B. .

Abstract

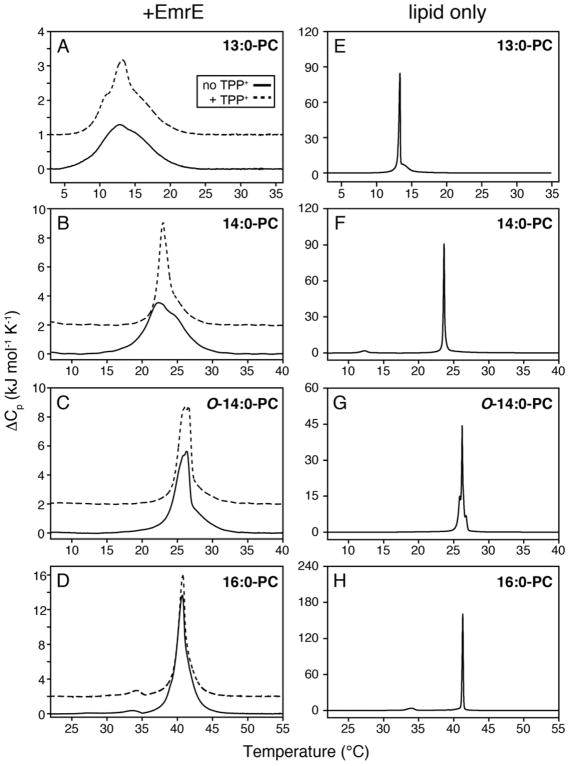
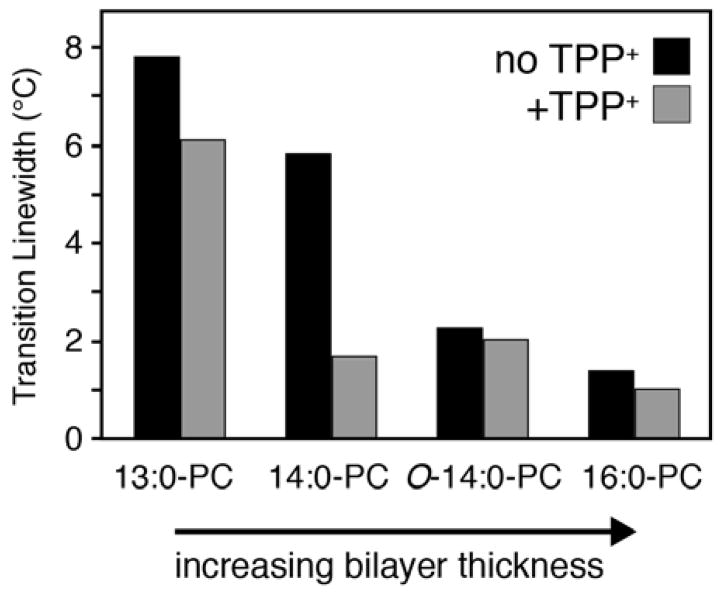
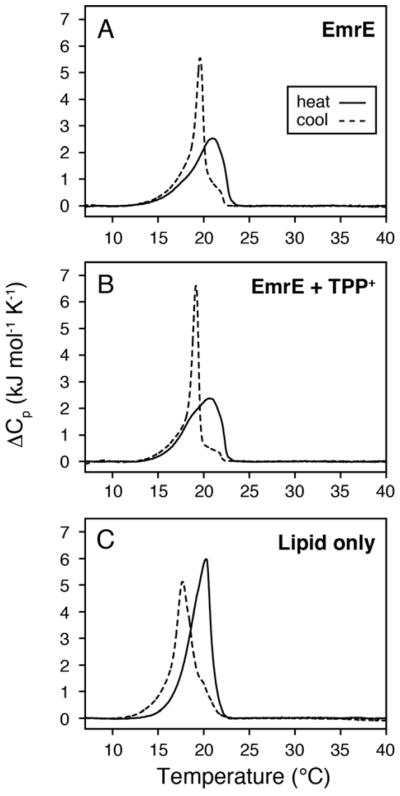
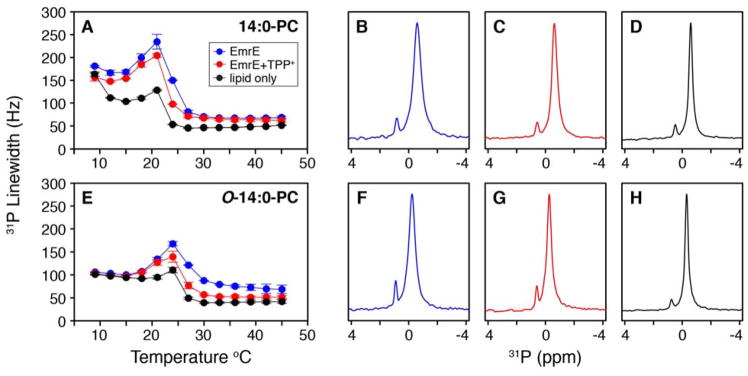
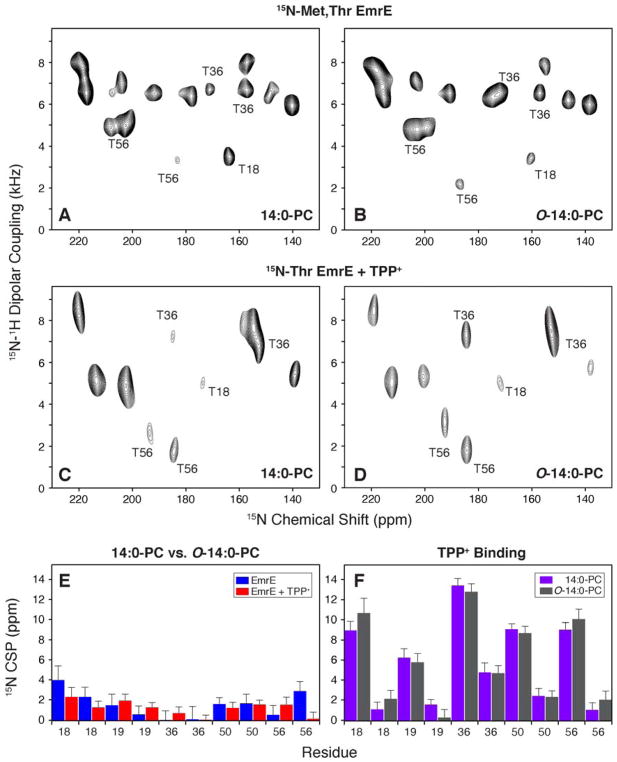
It is known that the lipid composition within a cellular membrane can influence membrane protein structure and function. In this Article, we investigated how structural changes to a membrane protein upon substrate binding can impact the lipid bilayer. To carry out this study, we reconstituted the secondary active drug transporter EmrE into a variety of phospholipid bilayers varying in headgroup and chain length and carried out differential scanning calorimetry (DSC) and solid-state NMR experiments. The DSC results revealed a difference in cooperativity of the lipid phase transition for drug-free EmrE protonated at glutamic acid 14 (i.e., proton-loaded form) and the tetraphenylphosphonium (TPP+) bound form of the protein (i.e., drug-loaded form). To complement these findings, we acquired magic-angle-spinning (MAS) spectra in the presence and absence of TPP+ by directly probing the phospholipid headgroup using 31P NMR. These spectra showed a reduction in lipid line widths around the main phase transition for samples where EmrE was bound to TPP+ compared to the drug free form. Finally, we collected oriented solid-state NMR spectra on isotopically enriched EmrE that displayed chemical shift perturbations to both transmembrane and loop residues upon TPP+ binding. All of these results prompt us to propose a mechanism whereby substrate-induced changes to the structural dynamics of EmrE alters the surrounding lipids within the bilayer.


Figures

Figure 1
Figure 1
DSC thermograms of lipid bilayers in the presence (A–D) or in the absence of EmrE (E–H). All proteoliposomes were prepared at a lipid:protein mole ratio of 100:1. For clarity, the TPP+-bound thermogram data (dotted lines) are offset by 1 kJ•mol−1•K−1 in panel A and 2 kJ•mol−1•K−1 in panels B–D from the EmrE data in the absence of TPP+ (solid lines). Heating and cooling scans for data in panels A–D are shown in Figure S1. The main phase transition is narrower and/or more homogeneous for 13:0-PC and 14:0-PC upon the addition of TPP+. Note that the presence of TPP+ to liposome only samples did not influence the broadness as we previously observed for 14:0-PC bilayers.
Figure 2
Figure 2
Main phase transition linewidths from DSC thermogram data for EmrE in the presence (gray) and absence (black) of TPP+. The full-width at half-maximum is plotted for each dataset in Figure 1A–D. The difference between EmrE free or bound to TPP+ is most stark in 14:0-PC.
Figure 3
Figure 3
DSC thermogram data for 3/1 POPE/POPG bilayers in the presence of protonated-EmrE (A), TPP+-bound EmrE (B), and lipid only (C). The samples containing EmrE used a lipid/protein molar ratio of 100/1. The heating (solid lines) and cooling curves (dotted lines) are shown for each sample. The linewidths corresponding to EmrE in the absence and presence of TPP+ show similar profiles when comparing heating or cooling curves, which is consistent with 16:0-PC data in Figure 1D. However, due to the observed thermal hysteresis for the lipid only POPE/POPG mixture, only qualitative conclusions can be drawn regarding the effect of TPP+ binding to EmrE on the phase transitions.
Figure 4
Figure 4
31P linewidths from a single pulse MAS experiment for EmrE embedded within 14:0-PC (A) and O-14:0-PC bilayers (E). The blue and red points correspond to EmrE in the absence and presence of TPP+, respectively. The black points correspond to the lipid only samples. Data reflect the average of two separate trials where the error bars represent the standard deviation of these datasets. The 31P linewidth vs. temperature plots for each trial are shown in Figure S3. Representative 31P spectra are shown at a temperature of 23 °C for 14:0-PC in the absence (B) and presence of TPP+ (C) and lipid only (D). The same is shown at 27 °C for O-14:0-PC in the absence (F) and presence of TPP+ (G) and lipid only (H). In both lipid compositions, there is a reduction in the 31P linewidth when EmrE is bound with TPP+. Note that the small peak around ~1 ppm is signal from the phosphate buffer used to prepare the samples.
Figure 5
Figure 5
1H/15N PISEMA spectra of EmrE reconstituted in bicelles consisting of 14:0-PC/6:0-PC or O-14:0-PC/6:0-PC. For simplicity, the panels are labeled by the long chain lipid (either 14:0-PC or O-14:0-PC). (A, B) [15N-Thr, 15N-Met] labeled EmrE in magnetically aligned bicelles in the drug-free, protonated form of EmrE at pH 5.8. (C, D) [15N-Thr] labeled EmrE in magnetically aligned bicelles in the TPP+ bound form of the protein. (E) 15N chemical shift perturbations (CSP) between drug-free EmrE in 14:0-PC and O-14:0-PC bicelles is shown in blue. Similarly the TPP+ bound form is compared between 14:0-PC and O-14:0-PC bicelles and is shown in red. (F) A comparison of 15N CSP values for TPP+ binding to EmrE. Purple bars show the perturbations induced to EmrE within the 14:0-PC bicelle and gray bars correspond to CSPs calculated in O-14:0-PC bicelles. Panels E and F plot the threonine residues in EmrE. Thr18 and Thr19 are located in TM1, Thr36 and Thr50 are located in TM2, and Thr56 is located in the loop between TM2 and TM3.

Similar articles

Cited by

References

    1. Riske KA, Barroso RP, Vequi-Suplicy CC, Germano R, Henriques VB, Lamy MT. Lipid bilayer pre-transition as the beginning of the melting process. Biochim Biophys Acta, Biomembr. 2009;1788:954–963. - PubMed
    1. Zhang YP, Lewis RNAH, Hodges RS, Mcelhaney RN. Interaction of a peptide model of a hydrophobic transmembrane alpha-helical segment of a membrane-protein with phosphatidylcholine bilayers - differential scanning calorimetric and FTIR spectroscopic studies. Biochemistry. 1992;31:11579–11588. - PubMed
    1. Yeagle PL. Cholesterol and the cell-membrane. Biochim Biophys Acta. 1985;822:267–287. - PubMed
    1. Clarke JA, Heron AJ, Seddon JM, Law RV. The diversity of the liquid ordered (Lo) phase of phosphatidylcholine/cholesterol membranes: a variable temperature multinuclear solid-state NMR and x-ray diffraction study. Biophys J. 2006;90:2383–2393. - PMC - PubMed
    1. Cho MK, Gayen A, Banigan JR, Leninger M, Traaseth NJ. Intrinsic conformational plasticity of native EmrE provides a pathway for multidrug resistance. J Am Chem Soc. 2014;136:8072–8080. - PMC - PubMed

Publication types

MeSH terms

LinkOut - more resources