. 2018 Mar 1;128(3):1164-1177.
doi: 10.1172/JCI97103. Epub 2018 Feb 19.

TIA1 variant drives myodegeneration in multisystem proteinopathy with SQSTM1 mutations

Affiliations

TIA1 variant drives myodegeneration in multisystem proteinopathy with SQSTM1 mutations

YouJin Lee et al. J Clin Invest. .

Abstract

Multisystem proteinopathy (MSP) involves disturbances of stress granule (SG) dynamics and autophagic protein degradation that underlie the pathogenesis of a spectrum of degenerative diseases that affect muscle, brain, and bone. Specifically, identical mutations in the autophagic adaptor SQSTM1 can cause varied penetrance of 4 distinct phenotypes: amyotrophic lateral sclerosis (ALS), frontotemporal dementia, Paget's disease of the bone, and distal myopathy. It has been hypothesized that clinical pleiotropy relates to additional genetic determinants, but thus far, evidence has been lacking. Here, we provide evidence that a TIA1 (p.N357S) variant dictates a myodegenerative phenotype when inherited, along with a pathogenic SQSTM1 mutation. Experimentally, the TIA1-N357S variant significantly enhances liquid-liquid-phase separation in vitro and impairs SG dynamics in living cells. Depletion of SQSTM1 or the introduction of a mutant version of SQSTM1 similarly impairs SG dynamics. TIA1-N357S-persistent SGs have increased association with SQSTM1, accumulation of ubiquitin conjugates, and additional aggregated proteins. Synergistic expression of the TIA1-N357S variant and a SQSTM1-A390X mutation in myoblasts leads to impaired SG clearance and myotoxicity relative to control myoblasts. These findings demonstrate a pathogenic connection between SG homeostasis and ubiquitin-mediated autophagic degradation that drives the penetrance of an MSP phenotype.

Keywords: Autophagy; Genetics; Muscle Biology; Neurodegeneration; Skeletal muscle.


Conflict of interest statement

Conflict of interest: J.P. Taylor is a consultant for Inception Sciences.

Figures

Figure 1
Figure 1. Digenic inheritance of SQSTM1 and TIA1 variants leads to distal myopathy with RV-IBM pathology.
(A) Linear diagram of the TIA1 protein highlighting conserved regions of the LCD. Distal myopathy–associated variant positions are shown in yellow and ALS and FTD variants in blue. (B) Pedigrees of families IV, VII, and IX showing segregation. DNA was only available for the patients indicated with an asterisk. (C) Muscle imaging findings for patient V-2 at age 54 years. Severe involvement of all calf muscles was seen on MRI T1-weighted images. The solid white arrow indicates normal muscle, and the arrowhead indicates atrophic muscle with fatty replacement. (D) H&E staining of a muscle biopsy of the right tibialis from patient XII-1 showing several fibers with RVs (arrows). Original magnification, 50 μm. (E) Immunofluorescence staining of TIA1 (red) with SQSTM1 (green in upper panel) or TDP-43 (green in lower panel) revealed accumulation and partial colocalization of these proteins in the muscle biopsy from patient V-2. Both sets of images show a RV fiber. The dotted lines denote affected fiber. Scale bars: 50 μm.
Figure 2
Figure 2. TIA1-N357S variant promotes LLPS and disrupts SG dynamics.
(A) Phase diagram of TIA1-WT, -EK, and -NS mapped at physiological conditions. The mean concentration of the light phase (protein depleted phase) and SE are plotted. A quadratic equation was used to fit the trendlines (R2, WT, and NS = 0.99, EK = 0.98; P < 0.003 for NS vs. WT and P < 0.0002 for EK vs. WT, by χ2 test). Insets show characteristic DIC images of light, diffused phase, and dense phase droplets, respectively. (B) Thioflavin T fluorescence intensity of amyloid fibrils at 2.5 μM TIA1-WT, -EK, and -NS variants at the indicated time points. The spectrum of BSA (nonamyloid fibril–forming) was measured as a baseline. That baseline was subtracted from all the WT, EK and NS spectra at each time point. ***P < 0.001, by 2-way ANOVA with Tukey’s multiple comparisons test (NS, P > 0.1). (C) IF images of MEFs expressing GFP-TIA1-WT, -NS, or -EK immunostained with anti-G3BP1 (red) prior to 1 hour HS at 42°C, immediately after HS, or following a 30-minute HS recovery at 37°C. DAPI nuclear staining is shown in blue. Scale bars: 5 μm. (D) Bar graph of the percentage of cells containing TIA1/G3BP1-positive SGs under the conditions described in C. Individual transfected cells were counted and are indicated as the total number of cells. Representative data were pooled from 3 independent experiments (n = 150~200). rec, recovery. (E) Graphical representation of the average relative fluorescence intensity (RFI) following photobleaching of individual SGs from MEFs expressing GFP-TIA1-WT, -NS, or -EK and treated for 1 hour with 0.5 mM arsenite. Representative data were pooled from 3 independent experiments (n = 20~30). Error bars represent the mean ± SEM. (D and E) *P < 0.05, by 2-way ANOVA and 2-tailed Student’s t test.
Figure 3
Figure 3. SQSTM1 is necessary for SG homeostasis.
(A) Immunofluorescence images of control or SQSTM1-knockout MEFs (p62–/–) incubated at 42°C for 1 hour and returned to 37°C for the indicated durations followed by immunostaining for TIA1 (green) and G3BP1 (red) to detect SGs. (B) Graph of the percentage of cells containing TIA1/G3BP1-positive SGs as in A. Transfected cells were counted and are indicated as the total number of cells. Representative data were pooled from 3 independent experiments (n = 150~200). (C) Immunofluorescence images of MEFs expressing GFP-TIA1-WT, -NS, or -EK and immunostained with SQSTM1 antibody following incubation at 42°C for 1 hour and reincubation at 37°C for the indicated durations. (D) Bar graph of the percentage of GFP-TIA1/SQSTM1-positive SGs in C. Individual GFP-TIA1 SGs were counted and are indicated as the total number of SGs. Representative data were pooled from 3 independent experiments (n = 800~1000). Scale bars: 5 μm. Error bars represent the mean ± SEM. (B and D) *P < 0.05 by 2-way ANOVA and 2-tailed Student’s t test.
Figure 4
Figure 4. The presence of aggregated proteins increases TIA SG persistence in the presence of TIA1 mutations or loss of SQSTM1.
(A) Immunofluorescence images of control or p62–/– MEFs labeled with Alexa Fluor 594–azide (red) to detect DRiPs after incubation at 42°C for 1 hour and following a 30-minute HS recovery. Representative data were pooled from 3 independent experiments (n = 350~450). Scale bars: 5 μm. (B) Graph of the percentage of TIA1 SGs labeled with Alexa Fluor 594–azide (red) detecting DRiPs in control or SQSTM1-knockout MEFs (p62–/–), incubated at 42°C for 1 hour and returned to 37°C for 30 minutes. Individual TIA1 SGs (green) were counted and are indicated as the total number of TIA1 SGs. Representative data were pooled from 3 independent experiments (n = 350~450). (C) IF images of MEFs expressing GFP-TIA1-WT, -NS, or -EK and labeled with Alexa Fluor 594–azide (red) to detect DRiPs before HS, after incubation at 42°C for 1 hour, and following a 30-minute HS recovery period. Representative data were pooled from 3 independent experiments (n = 350~450). (D) Bar graph of the percentage of TIA1 SGs labeled with DRiPs as in C. Individual TIA1 SGs (green) were counted and are indicated as the total number of TIA1 SGs. *P < 0.05 by 2-way ANOVA and 2-tailed Student’s t test.
Figure 5
Figure 5. TDP-43 aggregates increase TIA SG persistence in the loss of SQSTM1.
(A) Immunofluorescence images of endogenous TIA1 (green) from control or p62–/– MEFs transfected with an mCherry-tagged TDP-43 C-terminal fragment (red) after incubation at 42°C for 1 hour and following a 30-minute HS recovery. Representative data were pooled from 3 independent experiments (n = 350~450). (B) Bar graph showing the percentage of TIA1 SGs with mCherry TDP-43 C-terminal fragment in control or p62–/– MEFs from A. Individual TIA1 SGs (green) were counted and are indicated as the total number of TIA1 SGs. DAPI nuclear staining is shown in blue. Scale bars: 5 μm. Error bars represent the mean ± SEM. *P < 0.05, by 2-way ANOVA and 2-tailed Student’s t test.
Figure 6
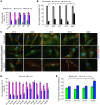
Figure 6. SQSTM1 disease mutations alter SG kinetics and synergistically mediate myotoxicity with TIA1-N357S.
(A) Bar graph showing the percentage of MEFs containing endogenous TIA1-positive SGs. MEFs were transfected with mCherry, mCherry-SQSTM1-WT, or 1 of 3 different disease mutations (PL, MV, or AX) incubated at 42°C for 1 hour and subsequently returned to 37°C for the indicated durations. Transfected cells were counted and are indicated as the total number of cells. Representative data were pooled from 3 independent experiments (n = 450~550). (B) Bar graph showing the percentage of fibroblasts containing TIA1/G3BP1-positive SGs from fibroblasts of control patients (fibroblast lines 112 and 409), patients carrying the TIA1-N357S variant (fibroblast lines 107 and 319), and a patient carrying both a SQSTM1-A390X mutation and a TIA1-N357S variant (fibroblast line 483) immediately following 0.5 mM AsIII treatment for 1 hour or following a 40-minute recovery. (C) Immunofluorescence images of patients’ fibroblasts detailed in B, immunostained with TIA1 (green) and G3BP1 antibodies (red) before, immediately following 0.5 mM AsIII treatment for 1 hour, and following a 40-minute recovery. DAPI nuclear staining is shown in blue. Scale bars: 5 μm. Representative data were pooled from 3 independent experiments (n = 120~150). (D) Bar graph showing the percentage of C2C12 myoblasts containing TIA1-positive SGs. C2C12 myoblasts were cotransfected with mCherry, mCherry-SQSTM1-WT, or mCherry-SQSTM1 with 1 of 3 different disease mutations (PL, MV, or AX) and GFP-TIA1-WT or 1 of 2 variants (EK or NS) incubated at 42°C for 1 hour and subsequently returned to 37°C for the indicated durations. (E) Bar graph of LDH release from C2C12 myoblasts similar to those in D, before HS and after 1 hour of HS, with an additional 1-hour recovery at 37°C. The absorbance of the samples was measured at 492 nm. The reference wavelength at 680 nm was measured. Representative data were pooled from 3 independent experiments (n = 150~200). Error bars represent the mean ± SEM. *P < 0.05, by 2-way ANOVA and 2-tailed Student’s t test.

References

    1. Bucelli RC, et al. SQSTM1 splice site mutation in distal myopathy with rimmed vacuoles. Neurology. 2015;85(8):665–674. doi: 10.1212/WNL.0000000000001864. - DOI - PMC - PubMed
    1. Watts GD, et al. Inclusion body myopathy associated with Paget disease of bone and frontotemporal dementia is caused by mutant valosin-containing protein. Nat Genet. 2004;36(4):377–381. doi: 10.1038/ng1332. - DOI - PubMed
    1. Kim HJ, et al. Mutations in prion-like domains in hnRNPA2B1 and hnRNPA1 cause multisystem proteinopathy and ALS. Nature. 2013;495(7442):467–473. doi: 10.1038/nature11922. - DOI - PMC - PubMed
    1. Taylor JP. Multisystem proteinopathy: intersecting genetics in muscle, bone, and brain degeneration. Neurology. 2015;85(8):658–660. doi: 10.1212/WNL.0000000000001862. - DOI - PubMed
    1. Johnson JO, et al. Mutations in the Matrin 3 gene cause familial amyotrophic lateral sclerosis. Nat Neurosci. 2014;17(5):664–666. doi: 10.1038/nn.3688. - DOI - PMC - PubMed

Publication types

MeSH terms