

doi: 10.1038/nmeth.4605.
Epub 2018 Feb 19.
Quantitative mapping and minimization of super-resolution optical imaging artifacts
Affiliations
- PMID: 29457791
- PMCID: PMC5884429
- DOI: 10.1038/nmeth.4605
Item in Clipboard
Quantitative mapping and minimization of super-resolution optical imaging artifacts
Nat Methods.
2018 Apr.
Erratum in
-
Author Correction: Quantitative mapping and minimization of super-resolution optical imaging artifacts.Nat Methods. 2020 Nov;17(11):1167. doi: 10.1038/s41592-020-00983-7. Nat Methods. 2020. PMID: 33077969
Abstract
Super-resolution microscopy depends on steps that can contribute to the formation of image artifacts, leading to misinterpretation of biological information. We present NanoJ-SQUIRREL, an ImageJ-based analytical approach that provides quantitative assessment of super-resolution image quality. By comparing diffraction-limited images and super-resolution equivalents of the same acquisition volume, this approach generates a quantitative map of super-resolution defects and can guide researchers in optimizing imaging parameters.
Conflict of interest statement
The authors declare no competing financial interests.
Figures
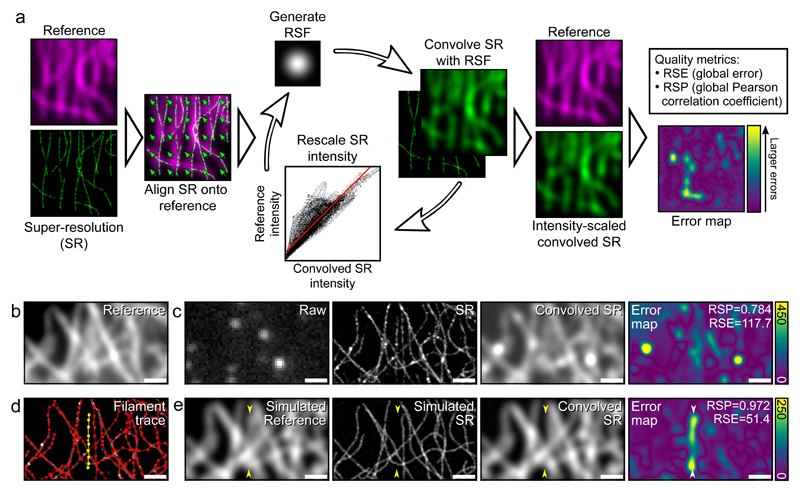
a) Representative workflow for SQUIRREL error mapping. b) Fixed microtubules labelled with Alexa Fluor 647 imaged in TIRF. c) Raw - single frame from raw dSTORM acquisition of structure in b, SR - super-resolution reconstruction of dSTORM data set, Convolved SR - super-resolution image convolved with appropriate RSF, Error map - quantitative map of errors between the reference and convolved SR images. d) SuReSim [13] filament tracing used to generate e, yellow filament is made to be present in reference image but absent in super-resolution image. e) Simulated reference image, super-resolution image, and super-resolution image convolved with RSF and error map. Yellow arrowheads indicate position of yellow filament seen in d. Scale bars = 1 μm. b-d represents data from 1 of 5 independent experiments showing similar results.
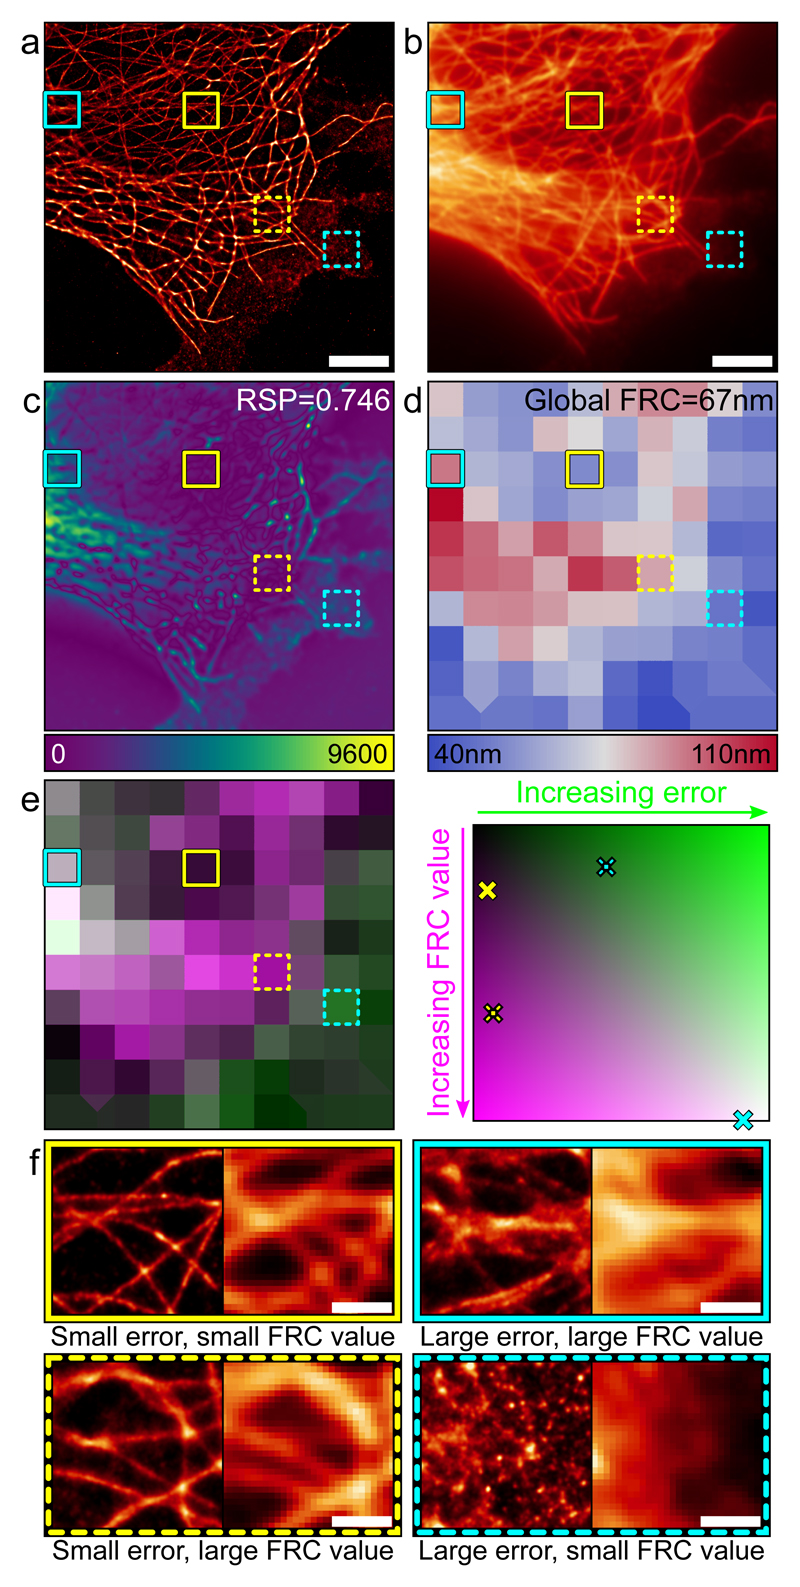
a) Super-resolution image of fixed Alexa Fluor 647-labelled microtubules reconstructed via MLE. Scale bar = 5 μm. b) Corresponding TIRF image. Scale bar = 5 μm. c) Error map for super-resolution image in a using b as the reference. d) Local mapping of FRC values for the super-resolution image in a. e) Left: Merge of FRC map (magenta) and error map (green, binned to match FRC map). Right: Map of error-resolution space showing where the four boxed regions are located. f) Enlargements of the super-resolution (left) and widefield (right) boxed regions indicated on panels a-e. Scale bars = 1 μm. Figure represents data from 1 of 5 independent experiments showing similar results.
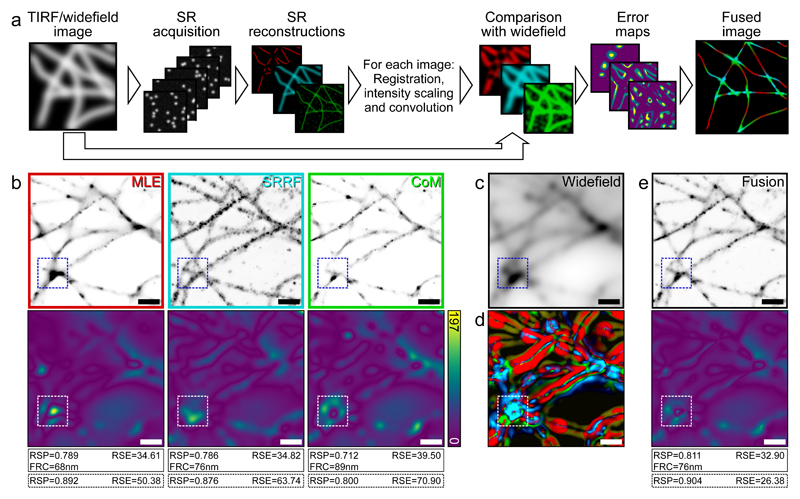
a) Workflow for generating fused images from different super-resolution images from the same SMLM data set. b) Top row: Three super-resolution images generated from the same dSTORM dataset using different algorithms. MLE = maximum likelihood estimator with multi-emitter fitting, SRRF = super-resolution radial fluctuations, CoM = centre of mass. Bottom row: Corresponding error maps with the widefield image shown in c used as the reference. d) Contributions of different images to the final fused images, colour coded as in the top row of b. e) Top: Fused image, Bottom: Error map of fused image with c again used as the reference image. Values in solid line boxes indicate the quality metrics of the whole images, values in dashed boxes represent quality values from highlighted inset region only. Scale bars = 1 μm. b-e represents data from 1 of 5 independent experiments showing similar results.
References
Publication types
MeSH terms
Grants and funding
LinkOut - more resources
Full Text Sources
Other Literature Sources
