. 2018 Mar;36(3):272-281.
doi: 10.1038/nbt.4072. Epub 2018 Feb 19.

Recon3D enables a three-dimensional view of gene variation in human metabolism

Affiliations

Recon3D enables a three-dimensional view of gene variation in human metabolism

Elizabeth Brunk et al. Nat Biotechnol. 2018 Mar.

Abstract

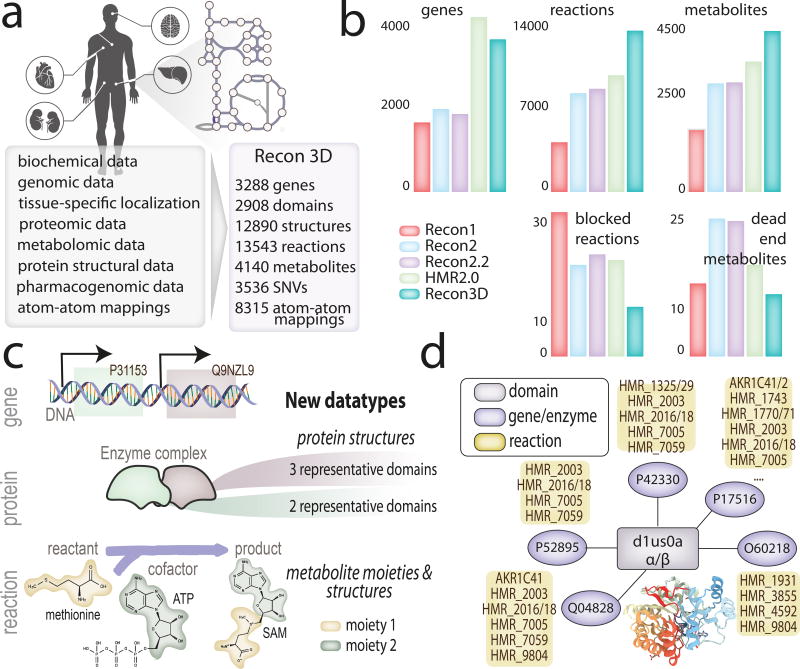
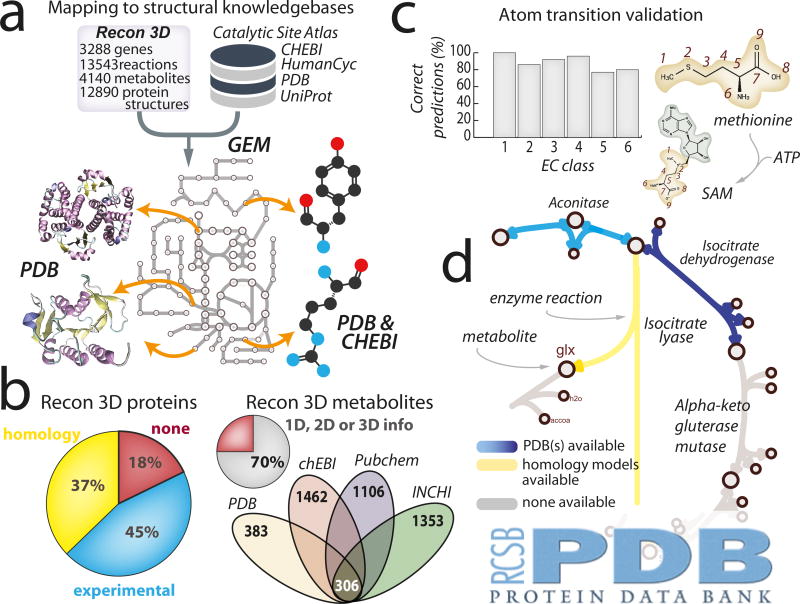
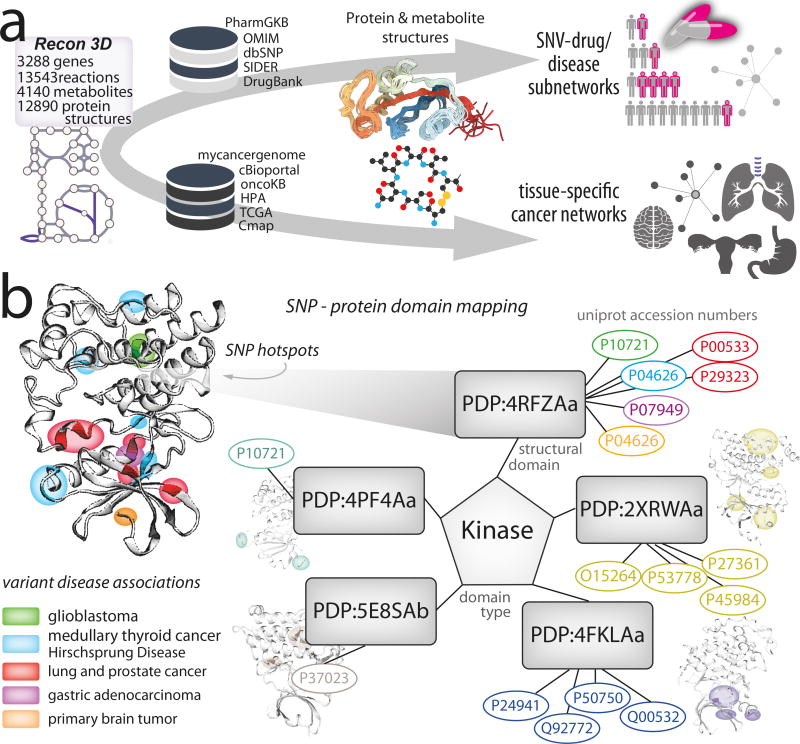
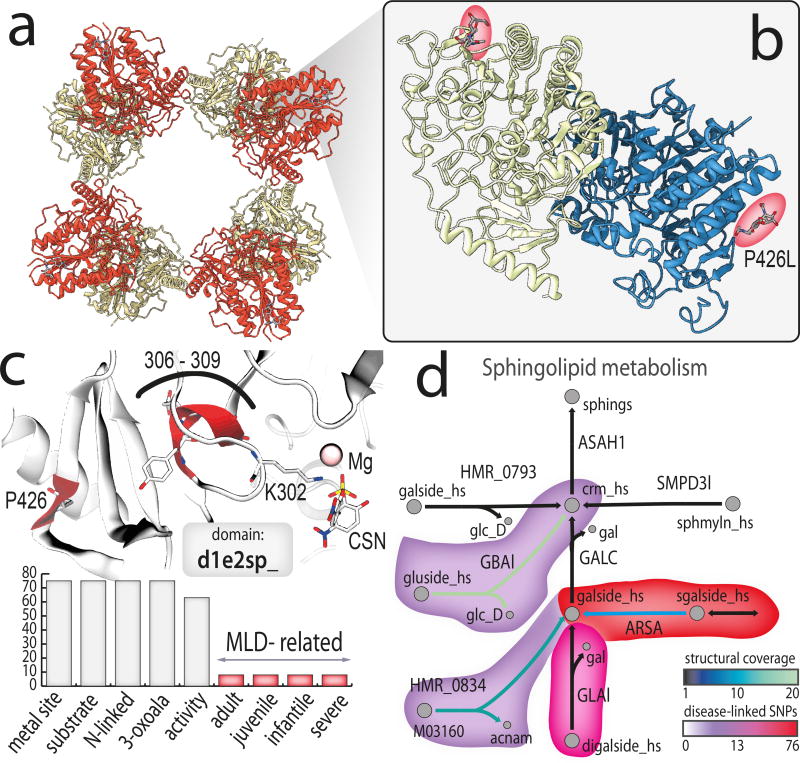
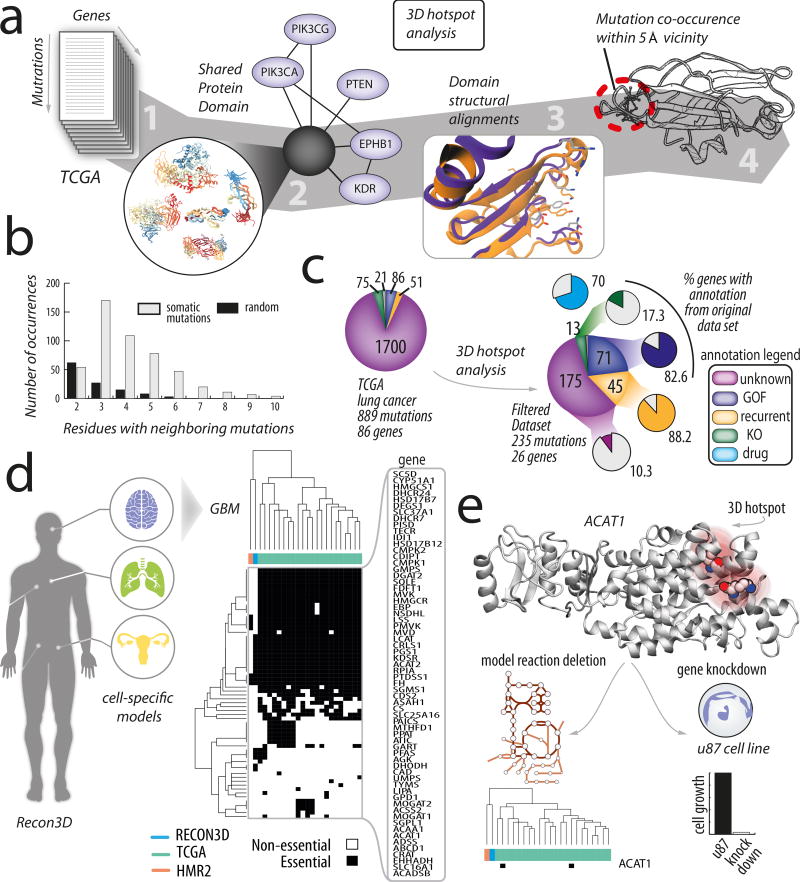
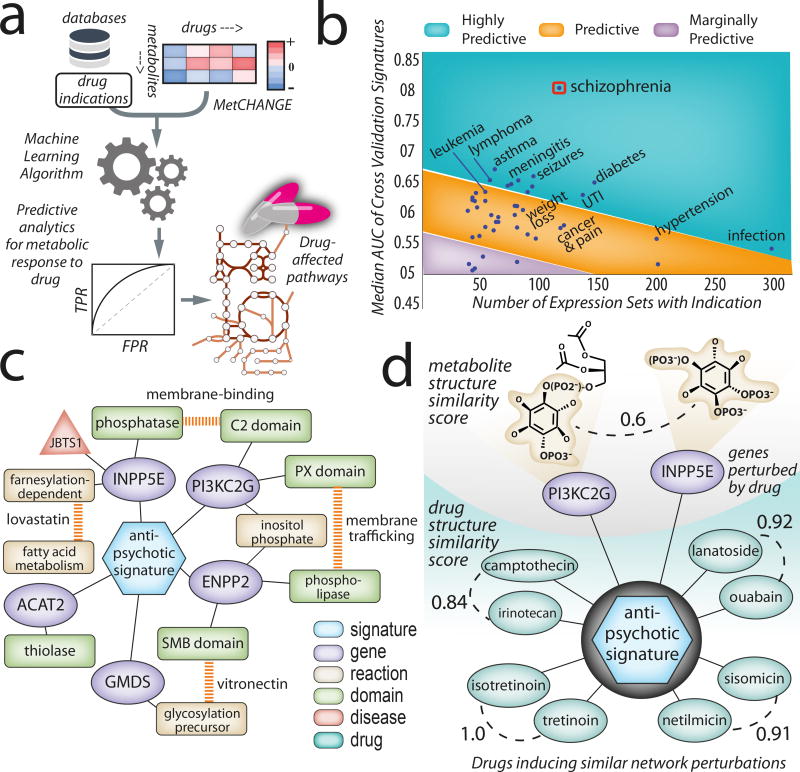
Genome-scale network reconstructions have helped uncover the molecular basis of metabolism. Here we present Recon3D, a computational resource that includes three-dimensional (3D) metabolite and protein structure data and enables integrated analyses of metabolic functions in humans. We use Recon3D to functionally characterize mutations associated with disease, and identify metabolic response signatures that are caused by exposure to certain drugs. Recon3D represents the most comprehensive human metabolic network model to date, accounting for 3,288 open reading frames (representing 17% of functionally annotated human genes), 13,543 metabolic reactions involving 4,140 unique metabolites, and 12,890 protein structures. These data provide a unique resource for investigating molecular mechanisms of human metabolism. Recon3D is available at http://vmh.life.


Figures

Figure 1
Figure 1. The properties and content of the Recon3D knowledge-base
(a) Recon3D includes information on 3,288 open reading frames that encode metabolic enzymes catalyzing 13,543 reactions on 4,140 unique metabolites, protein structural information from Protein Data Bank (PDB), metabolite structures from CHEBI and is capable of performing flux-balance analysis to integrate and interpret a variety of emerging data types including linking mutations identified from human variation data or cancer genome atlases. (b) A comparison of the genes, reactions, metabolites, blocked reactions, and dead end metabolites among Recon predecessors and HMR2.0. (c) Relationships between genes, their encoding proteins, and the reactions they catalyze, (i.e., GPRs), are now described in the context of their specific 3D configurations, interactions, and properties. New data types include representative structural domains of proteins, metabolite structures along with their conserved moieties, and atom-atom mappings. Atom-level transitions were analyzed for 8,315 reactions (Supplementary Note 3). (d) Domain connectivity explored across the network to identify domains that are shared across multiple proteins, or involved in multiple catalyzing reactions. An example is the alpha/beta protein domain (d1su0a_), which is present in eight different genes (described by Uniprot accession number). The proteins encoded by these genes belong to the reductase family; they catalyze different reactions in various metabolic subsystems, ranging from glycolysis and the pentose phosphate pathway to xenobiotics metabolism and glycerophospholipid metabolism. Recon3D can be queried and downloaded from http://bigg.ucsd.edu/ or http://vmh.life. Users can visualize protein structures in networks via www.rscb.org or visualize network simulation results using the interactive ReconMap built on the Google Maps API (http://vmh.life/#mapnavigator).
Figure 2
Figure 2. Linking human metabolic network to protein structural databases, cheminformatics platforms, and the Protein Data Bank
(a) The metabolic content in Recon3D was cross-referenced with sequence and structure-based databases, such as UniProt and PDB. The links in the metabolic network, which represent reactions, were mapped to three-dimensional (3D) structures through their encoding genes. The nodes in the network, which represent metabolites, were also linked to structural representations (3D, 2D, or 1D connectivity specifications). (b) Structural coverage of both proteins and metabolites in Recon3D is given by the pie charts, which indicate that over 80% of the metabolic proteome (2,793/3,297 genes) and 85% of the unique metabolome (2369/2797) has structural information. In the case of metabolite structures, the combination of structural data from multiple sources allows for the total structural coverage to exceed 70%. (c) Validation of atom-atom mapping by comparison with curated atom mappings for each major class of reaction. Recon3D is the first metabolic network reconstruction to contain atomic-level details. (d) An example of the type of visualization that can be found at the RCSB PDB website: http://www.rcsb.org/. The systems biology interface provides users with the ability to visualize metabolic network maps, that have been annotated to highlight which reactions are associated with experimental crystallographic structures (blue), homology models (yellow), or metabolite structures.
Figure 3
Figure 3. Linking human metabolic network to gene variation and cancer knowledge-bases
(a) Recon3D, as a Resource, provides information on three important layers of data related to disease biology: (i) amino acid location of mutations (or SNVs/SNPs) in the set of metabolic genes; (ii) the three-dimensional structure of proteins with sequence variants; and (iii) the relationships between mutations and the onset of disease. Information was cross-referenced from Recon3D to human variation and pharmacogenomics databases, such as dbSNP, PharmGKB, and cancer-specific databases, such as the Cancer Genome Atlas (TCGA), the Human Protein Atlas (HPA), and CMap. We mapped single nucleotide variants (SNVs) and single nucleotide polymorphisms (SNPs) to the genes in Recon3D. Within the set of genes with genetic variation, we focused on cases where (1) protein structural data was available; (2) SNPs/SNVs were considered to be deleterious or potentially harmful (655 genes). (b) Using this information, we probed characteristics of missense mutations and their three-dimensional spatial relationships. For each protein, we identified its representative protein structural domain (or a fold or set of folds unique to a given protein or multiple proteins). For example, for kinases, we identify various representative domains (five are shown here) that are associated with one or multiple genes (given by UniProt accession numbers). To this end, these five representative domains constitute “structure-based protein templates” shared among a group of genes. As illustrated, numerous mutations are found in 3D localized “hotspots” (or regions of the domain that experience high mutation burden). Interestingly, these mutation hotspots appear to be associated with specific diseases, such as primary brain cancer, glioblastoma, and other cancers in the case of Bruton’s Tyrosine Kinase (BTK) kinase domain scaffold (PDP:4RFZAa). All domains are determined by structural alignment and those featured here are named by the Protein Domain Parser (PDP) and the corresponding PDB structure (and chain) selected as the representative domain (see Online Methods; Supplementary Note 3). Colors map genes to the region (hotspot) of their respective variant(s) and the diseases associated with that variant.
Figure 4
Figure 4. An example of bridging systems biology and structural biology through Recon3D
(a) Arylsulfatase A (ARSA) highlights an example of how the intersection of systems, structural, and pharmacogenomic information provides additional understanding of human disease variants. The macromolecular assembly in the native state contains a homo-octamer (four complexes of homodimers; PDB entry 1auk). (b) Identifying the location of a variant (e.g., P426L, dbSNP rs28940893) within the protein three-dimensional structure reveals mechanistic details of disease progression. This mutation, which is associated with a mild form of Metachromatic Leukodystrophy (MLD), weakens the interaction between monomers, causing the biological assembly to favor the homo-dimer state over the homo-octamer state. (c) Clustering all SNPs that fall within a 5–10Å vicinity of other mutations, we find that the largest cluster falls within 10 Å of both the metal-binding site and the substrate-binding site (residues 306 to 309 in PDB entry e2sp). These specific cases all cause a severe form of MLD in adults, juveniles, and infants. The distribution of structural and disease properties associated with all 76 SNPs that map to the representative domain of this protein (d1e2sp_) is given by the bar chart. The majority of cases map to the calcium binding domain, substrate binding domain, and have a significant effect on enzyme activity. (d) ARSA and its neighborhood of surrounding reactions link to a number of disease-associated mutations, indicating that this is a “network hotspot” for deleterious or potentially harmful mutations. In many cases, the proteins catalyzing these reactions also have available protein structural content (shown by a heat map and reaction link color), enabling 3D visualization of other SNPs in proteins in neighboring reactions. Figures for protein structures were generated using ChimeraX, the next generation version of Chimera. Reactions are drawn with minimal number of metabolites and cofactors for clarity.
Figure 5
Figure 5. Protein structure-guided discovery of mutation hotspots across structurally-related genes
Synchronization of protein structural domains, metabolic networks, and somatic mutation landscapes allows for stratification of variants into informative and meaningful sub-clusters. (a) The 3D hotspot analysis workflow. A list of genes with mutations is cross-referenced with databases such as TCGA. In this example, we studied mutations taken from whole-exome sequence data from 178 tumour–normal pairs of lung squamous cell carcinoma. We then assembled protein structural information for this subset of genes with somatic mutations and evaluated the number of representative protein domains for this set of genes. In total, 86 genes associated with 889 missense mutations had available experimental crystallographic structures and could be linked to representative structural domains. We tallied the mutations occurring within 5 and 10 Å spheres for each representative domain. The domains with multiple mutations in a specific 3D location were termed “mutation hotspots.” (b) We compared the frequency of mutation co-occurrence (in a 5 Å sphere) in randomly selected residues (grey) within the same set of proteins with those taken from the lung cancer dataset (black). This comparison strongly suggests that somatic mutations are more likely to be found neighboring other mutations than what is expected by chance (p, val < 0.02). (c) Selecting the top 25% of mutations (235/889) with the highest number of neighboring mutations (within the same 5Å region in a representative protein domain) brings about a striking commonality that many are associated with known oncogenic roles. Information about various mutations was taken from several databases providing detailed annotations (which are color-coded in the plot), including recurrent sequence hotspots (R), known oncogenes (KO), (www.oncokb.org), as well as drug (Olaparib/BYL-719), Memorial Sloan Kettering level of evidence (3B), and other cancer subtype (endometrial/breast) associations (www.mycancergenome.org). For example, of all the mutations in this dataset with gain-of-function (GOF) oncogenic associations, 83% are found in the subset of mutations selected for on the basis of 3D localization. Similarly high percentages are recovered for other characteristic annotations, including the frequency of occurrence (88%), association with endometrial cancer (100%), and associated with breast cancer (40%). Intriguingly, percentage of mutations with unknown effects is greatly reduced from 90% in the total dataset (bottom pie chart; 889 mutations across 86 genes) compared to 10% in the 3D filtered subset (top pie chart; 235 mutations across 26 genes). Random selection of 235 mutations (averaged across 10,000 trials) demonstrates that the probability of recovering the same percentage of mutations with known oncogenic roles is very low (shown by the white outlined bars). (d) We combined the 3D hotspot analysis with metabolic modeling and focused on the somatic landscape of glioblastoma multiforme. Gene knockdowns were performed in various models, including Recon3D, HMR2.0, and cell-specific (GBM) and patient-specific models. (e) The majority of models predicted ACAT1 to be non-essential. Yet, when analyzing the mutations in this gene in 3D, we find a mutation hotspot. The importance of this gene is further confirmed by experiment, demonstrating its importance to GBM growth. This example suggests that protein structure could facilitate model predictions by highlighting genes of interest using complementary information.
Figure 6
Figure 6. Identification of metabolic signatures linked to drug indications
(a) A machine-learning based approach to predict metabolic responses to drugs. Drug indications were taken from the Side Effect Resource (SIDER) database for all available drugs overlapping with drug-treated gene expression profiles from the Connectivity Map (CMap) database. A total of 47 drug indications were analyzed in the context of the metabolic network, based upon 1,459 expression sets from cell culture responses to 334 drugs (see Supplementary Data File 26). (b) Cross validation results of metabolic gene expression signatures trained against drug indications versus the number of expression sets with the indication used in training. Results were empirically grouped as highly predictive, predictive, and marginally or poorly predictive based on AUC. Results were plotted with consideration to dataset size, showing that the signature is conserved over a greater number of drugs and amount of noise. Schizophrenia appeared as a clear outlier with greater predictability for a relatively large number of expression sets and drugs (13 drugs used in training), indicating that the gene signature is highly conserved (median AUC of 0.8). (c) Analysis of the antipsychotic signature in the context of known metabolic effects in schizophrenia and antipsychotic therapy. Genes that cluster based on the antipsychotic drug indication signature are linked to structure, biochemical, and disease properties through Recon3D. Such connectivity networks provide a first glimpse at whether genes share similar biological functions or domain archetypes. (d) Perturbations in genes that cluster based on metabolite/drug similarity. Computing structural alignments of the drugs inducing the antipsychotic drug indication signature indicates that certain pairs are likely to have similar bioactivities (based on tanimoto coefficient > 0.8). Chemically similar drugs cluster into four structurally distinct groups that differ on the basis of drug class. Drugs within these four groups all induce the same drug indication signature despite being radically different in structure (tanimoto coefficient < 0.2).

References

    1. Bui AAT, Van Horn JD. NIH BD2K Centers Consortium. Envisioning the future of ‘big data’ biomedicine. J. Biomed. Inform. 2017;69:115–117. - PMC - PubMed
    1. O’Brien EJ, Monk JM, Palsson BO. Using Genome-scale Models to Predict Biological Capabilities. Cell. 2015;161:971–987. - PMC - PubMed
    1. Thiele I, et al. A community-driven global reconstruction of human metabolism. Nat. Biotechnol. 2013;31:419–425. - PMC - PubMed
    1. Duarte NC, et al. Global reconstruction of the human metabolic network based on genomic and bibliomic data. Proceedings of the National Academy of Sciences. 2007;104:1777–1782. - PMC - PubMed
    1. Swainston N, et al. Recon 2.2: from reconstruction to model of human metabolism. Metabolomics. 2016;12:109. - PMC - PubMed

Publication types