

3-T MR Imaging of Proximal Femur Microarchitecture in Subjects with and without Fragility Fracture and Nonosteoporotic Proximal Femur Bone Mineral Density
- PMID: 29457963
- PMCID: PMC5929368
- DOI: 10.1148/radiol.2017170138
3-T MR Imaging of Proximal Femur Microarchitecture in Subjects with and without Fragility Fracture and Nonosteoporotic Proximal Femur Bone Mineral Density
Abstract
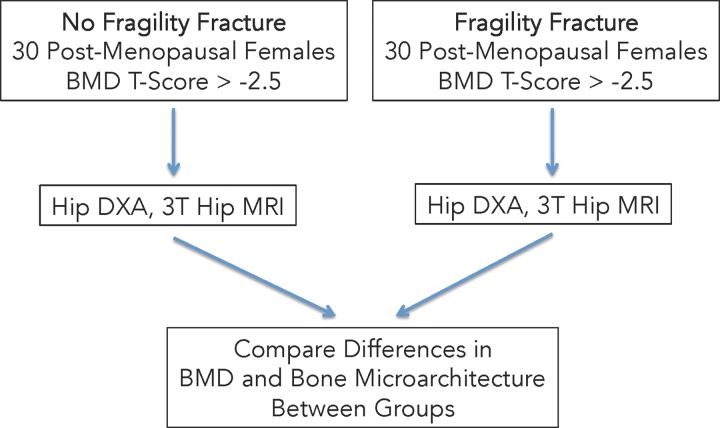
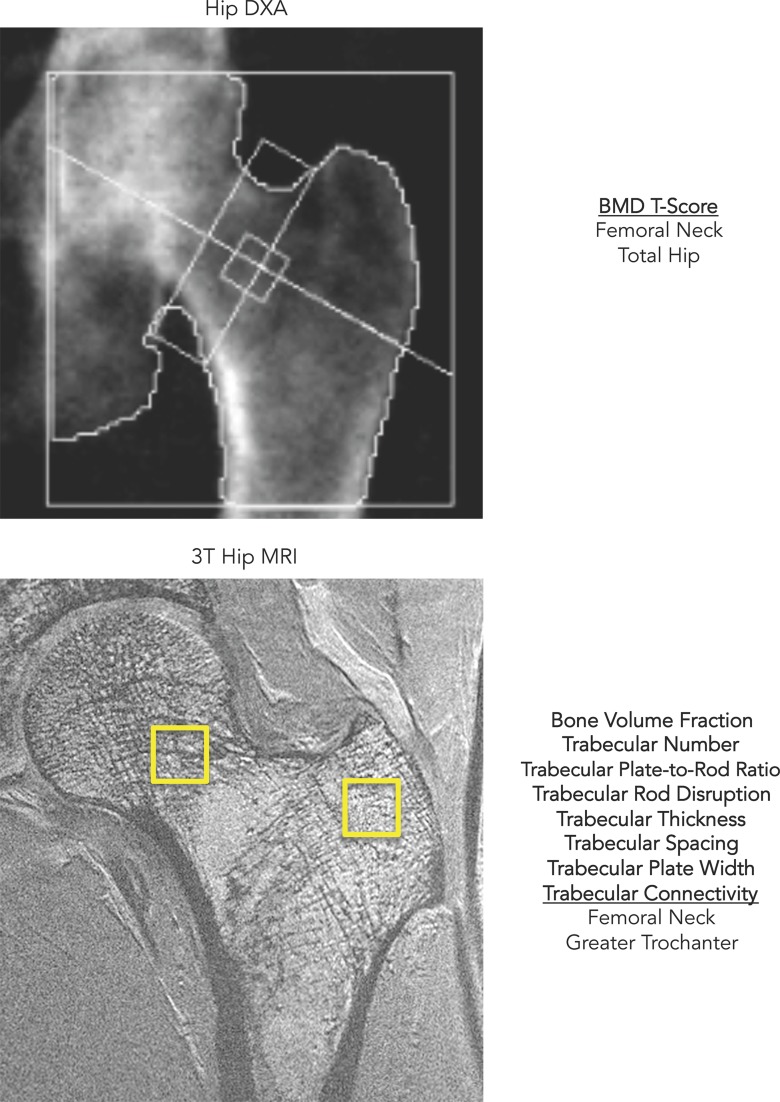
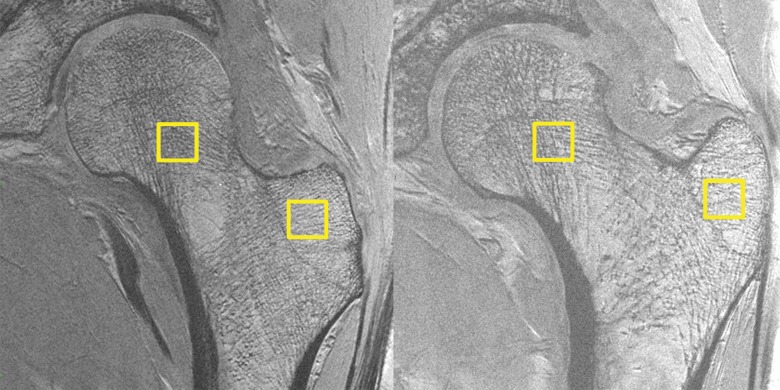
Purpose To determine if 3-T magnetic resonance (MR) imaging of proximal femur microarchitecture can allow discrimination of subjects with and without fragility fracture who do not have osteoporotic proximal femur bone mineral density (BMD). Materials and Methods Sixty postmenopausal women (30 with and 30 without fragility fracture) who had BMD T scores of greater than -2.5 in the hip were recruited. All subjects underwent dual-energy x-ray absorptiometry to assess BMD and 3-T MR imaging of the same hip to assess bone microarchitecture. World Health Organization Fracture Risk Assessment Tool (FRAX) scores were also computed. We used the Mann-Whitney test, receiver operating characteristics analyses, and Spearman correlation estimates to assess differences between groups, discriminatory ability with parameters, and correlations among BMD, microarchitecture, and FRAX scores. Results Patients with versus without fracture showed a lower trabecular plate-to-rod ratio (median, 2.41 vs 4.53, respectively), lower trabecular plate width (0.556 mm vs 0.630 mm, respectively), and lower trabecular thickness (0.114 mm vs 0.126 mm) within the femoral neck, and higher trabecular rod disruption (43.5 vs 19.0, respectively), higher trabecular separation (0.378 mm vs 0.323 mm, respectively), and lower trabecular number (0.158 vs 0.192, respectively), lower trabecular connectivity (0.015 vs 0.027, respectively) and lower trabecular plate-to-rod ratio (6.38 vs 8.09, respectively) in the greater trochanter (P < .05 for all). Trabecular plate-to-rod ratio, plate width, and thickness within the femoral neck (areas under the curve [AUCs], 0.654-0.683) and trabecular rod disruption, number, connectivity, plate-to-rod ratio, and separation within the greater trochanter (AUCs, 0.662-0.694) allowed discrimination of patients with fracture from control subjects. Femoral neck, total hip, and spine BMD did not differ between and did not allow discrimination between groups. FRAX scores including and not including BMD allowed discrimination between groups (AUCs, 0.681-0.773). Two-factor models (one MR imaging microarchitectural parameter plus a FRAX score without BMD) allowed discrimination between groups (AUCs, 0.702-0.806). There were no linear correlations between BMD and microarchitectural parameters (Spearman ρ, -0.198 to 0.196). Conclusion 3-T MR imaging of proximal femur microarchitecture allows discrimination between subjects with and without fragility fracture who have BMD T scores of greater than -2.5 and may provide different information about bone quality than that provided by dual-energy x-ray absorptiometry. © RSNA, 2018.
Figures
References
-
- Consensus development conference : diagnosis, prophylaxis, and treatment of osteoporosis. Am J Med 1993;94(6):646–650. - PubMed
-
- Melton LJ, 3rd, Atkinson EJ, O’Connor MK, O’Fallon WM, Riggs BL. Bone density and fracture risk in men. J Bone Miner Res 1998;13(12):1915–1923. - PubMed
-
- Melton LJ, 3rd, Chrischilles EA, Cooper C, Lane AW, Riggs BL. Perspective. How many women have osteoporosis? J Bone Miner Res 1992;7(9):1005–1010. - PubMed
-
- Kanis JA, Johnell O, Oden A, et al. Long-term risk of osteoporotic fracture in Malmö. Osteoporos Int 2000;11(8):669–674. - PubMed
-
- Johnell O, Kanis JA. An estimate of the worldwide prevalence and disability associated with osteoporotic fractures. Osteoporos Int 2006;17(12):1726–1733. - PubMed
Publication types
MeSH terms
Grants and funding
LinkOut - more resources
Full Text Sources
Other Literature Sources
Medical
