. 2018;14(6):972-991.
doi: 10.1080/15548627.2018.1436936. Epub 2018 May 10.

Antimycobacterial effect of IFNG (interferon gamma)-induced autophagy depends on HMOX1 (heme oxygenase 1)-mediated increase in intracellular calcium levels and modulation of PPP3/calcineurin-TFEB (transcription factor EB) axis

Affiliations

Antimycobacterial effect of IFNG (interferon gamma)-induced autophagy depends on HMOX1 (heme oxygenase 1)-mediated increase in intracellular calcium levels and modulation of PPP3/calcineurin-TFEB (transcription factor EB) axis

Nisha Singh et al. Autophagy. 2018.

Abstract

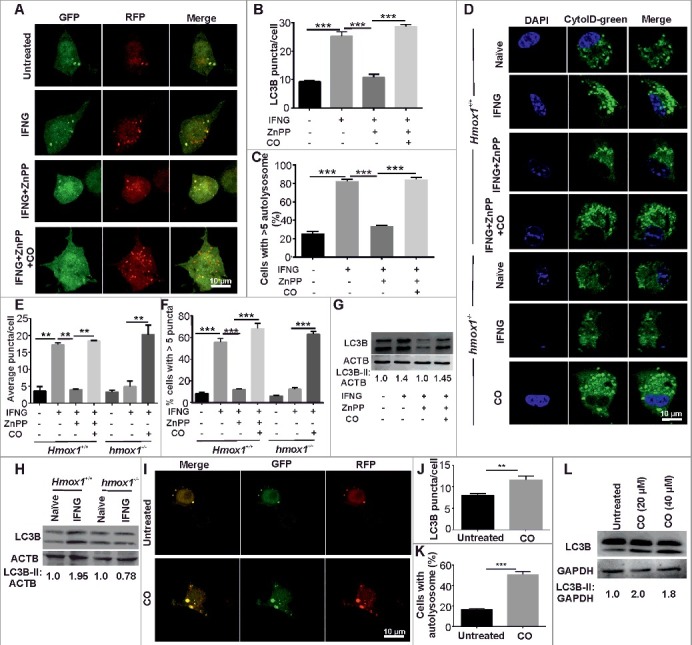
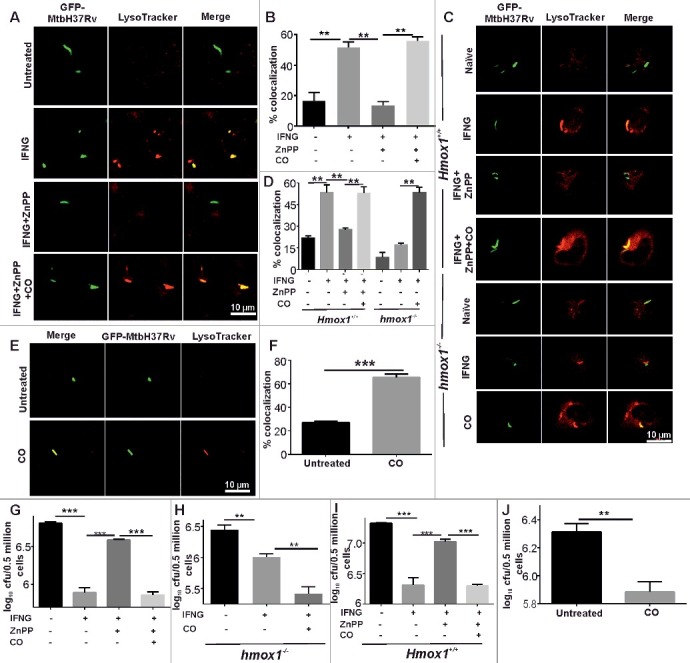
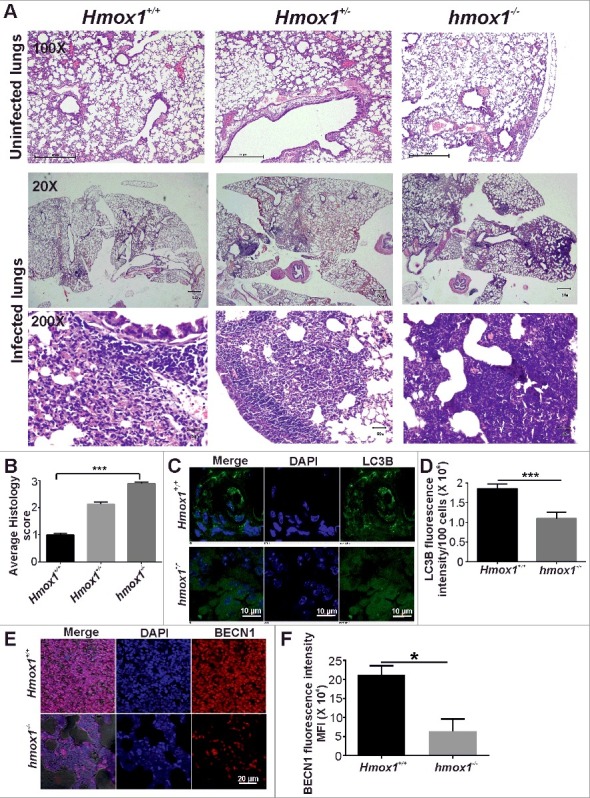
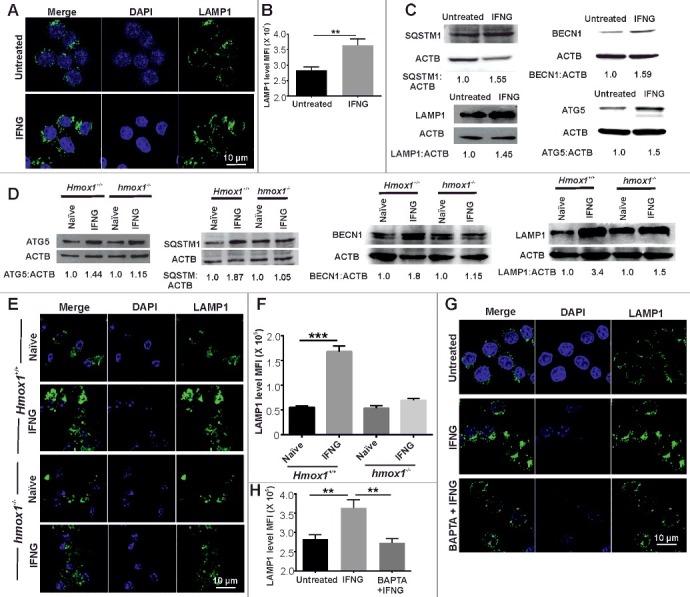
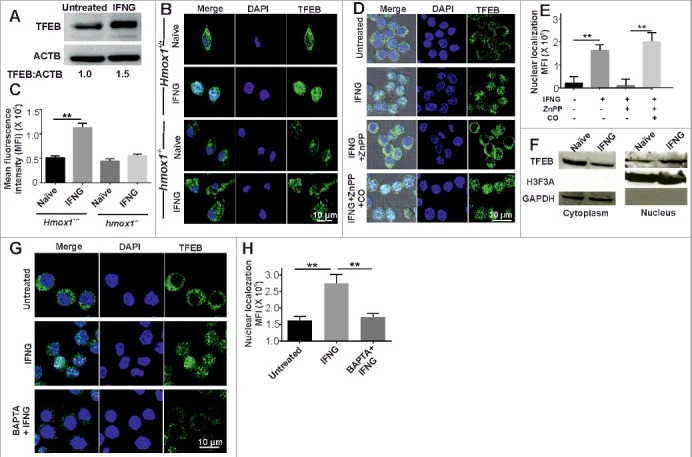
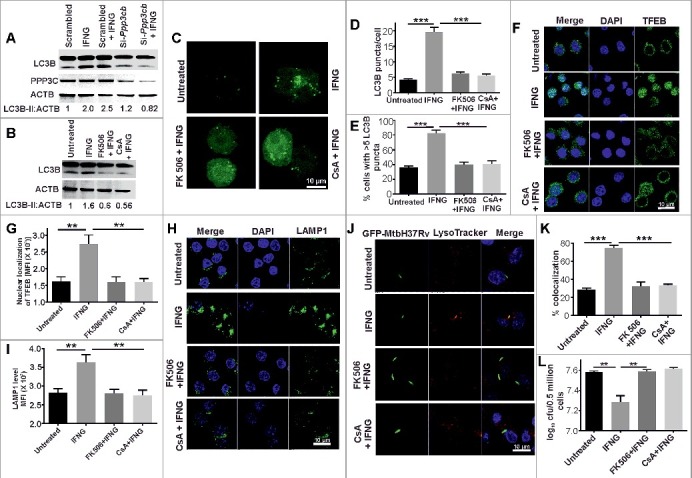
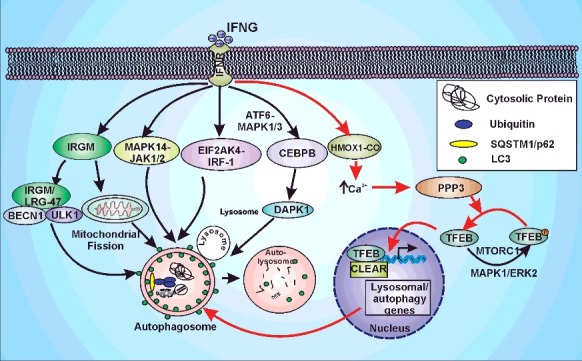
IFNG (interferon gamma)-induced autophagy plays an important role in the elimination of intracellular pathogens, such as Mycobacterium tuberculosis (Mtb). However, the signaling cascade that leads to the increase in autophagy flux in response to IFNG is poorly defined. Here, we demonstrate that HMOX1 (heme oxygenase 1)-generated carbon monoxide (CO) is required for the induction of autophagy and killing of Mtb residing in macrophages in response to immunomodulation by IFNG. Interestingly, IFNG exposure of macrophages induces an increase in intracellular calcium levels that is dependent on HMOX1 generated CO. Chelation of intracellular calcium inhibits IFNG-mediated autophagy and mycobacterial clearance from macrophages. Moreover, we show that IFNG-mediated increase in intracellular calcium leads to activation of the phosphatase calcineurin (PPP3), which dephosphorylates the TFEB (transcription factor EB) to induce autophagy. PPP3-mediated activation and nuclear translocation of TFEB are critical in IFNG-mediated mycobacterial trafficking and survival inside the infected macrophages. These findings establish that IFNG utilizes the PPP3-TFEB signaling axis for inducing autophagy and regulating mycobacterial growth. We believe this signaling axis could act as a therapeutic target for suppression of growth of intracellular pathogens.

Keywords: TFEB; autophagy; calcineurin; calcium signaling; carbon monoxide; heme oxygenase-1; interferon-gamma; tuberculosis pathogenesis.


Figures

Figure 1.
Figure 1.
HMOX1 is required for IFNG-induced autophagy. (A) RAW 264.7 macrophages (0.5 × 106) were transiently transfected with the ptfLC3 plasmid and independently treated with ZnPP (5 μM) and ZnPP (5 μM) along with CO (20 μM) for 2 h followed by IFNG (200 units/ml) for 3 h. These cells were fixed with 4% PFA, and slides were prepared and viewed under a confocal microscope. Representative confocal microscopy images are shown. The LC3 puncta/cell (B) and the percentage of cells with >5 autolysosomes (C) were calculated. (D) Primary macrophages (peritoneal macrophages) were harvested from hmox1/and Hmox1+/+ mice and were treated with ZnPP (5 μM) and CO (20 μM) for 2 h followed by IFNG (200 units/ml) for 3 h. The cells were stained with CytoID green detection dye and fixed with 4% PFA; slides were prepared and observed under a confocal microscope. The CytoID-stained vacuoles were quantified by calculating the average number of puncta/cell (E) and the number of cells with more than 5 puncta/100 cells (F). (G) Western blot analysis of panel of cells prepared as described in panel (A). Numbers below lanes indicate the fold change calculated using the densitometric analysis of LC3B-II relative to the ACTB signal using ImageJ software (https://imagej.nih.gov/ij/). (H) Peritoneal macrophages were isolated from the Hmox1+/+ and hmox1/ mice, exposed to IFNG for 3 h, the cells were lysed in RIPA buffer with protease inhibitor cocktail and the lysate was subjected to western blotting. The numbers below the blot are the densitometric analysis of LC3B-II relative to ACTB using ImageJ software. (I) RAW 264.7 macrophages (0.5 × 106) were transiently transfected with the ptfLC3 plasmid and treated with 20 µM CO for 2 h. After the treatment, cells were fixed using 4% PFA, slides were prepared and observed under the confocal microscope. The figure shows the representative images from 3 independent experiments. The LC3 puncta per cell (J) and the percentage cells with >5 autolysosomes (K) were calculated. (L) The same panel of cells were subjected to western blot analysis and the blot was probed with LC3 and GAPDH antibody. Numbers below lanes indicate the fold change calculated using the densitometry analysis of LC3B-II relative to GAPDH. Data in panels B, C, E, F, J, and K represent the mean±SEM from 3 independent experiments performed in triplicate. Statistical significance was determined using the Student t test. ** indicates a P value < 0.01, *** indicates a P value < 0.001.
Figure 2.
Figure 2.
IFNG-induced trafficking of Mtb to autolysosomes is regulated by HMOX1. (A) RAW 264.7 macrophages (0.5 × 106) were infected with GFP-Mtb H37Rv (1:5 MOI) for 3 h, followed by treatments with ZnPP (5 μM) and ZnPP (5 μM) along with CO (20 μM) for 2 h and then IFNG (200 units/ml) for 3 h. The lysosomes were stained with 200 nM LysoTracker Red for 20 min, fixed using 4% PFA and analyzed using confocal microscopy. The figure shows representative images of the colocalization of Mtb (green channel) and LysoTracker Red (red channel). (B) The percentage of Mtb-containing autophagosomes colocalized with lysosomes stained with LysoTracker Red. (C) Primary macrophages (peritoneal macrophages) were harvested from Hmox1+/+ and hmox1/- mice and were infected with GFP-Mtb H37Rv and treated as described above, followed by analysis using confocal microscope. (D) The percentage of Mtb-containing autophagosomes colocalized with LysoTracker Red (per 100 cells). (E) The same experiment was repeated with CO (20 μM) alone. Briefly, RAW 264.7 macrophages (0.5 × 106) were infected with GFP-Mtb H37Rv (1:5 MOI) for 3 h followed by CO treatment, staining with LysoTracker Red and analyzed using a confocal microscope. (F) The percentage of Mtb-containing autophagosomes colocalized with lysosomes stained with LysoTracker Red (per 100 Mtb cells). (G) RAW 264.7 macrophages were infected with Mtb (1:10 MOI) for 3 h, followed by gentamycin (100 μg/ml) treatment for 45 min. The cells were treated with ZnPP (5 μM), exogenous CO (20 μM) and IFNG when required. 24 h postinfection, the cells were lysed in 0.06% SDS after 24 h and plated on 7H11 plates. (H and I) Peritoneal macrophages isolated from hmox1/ and Hmox1+/+ mice were treated as described above and infected with Mtb and the CFU were estimated after 24 h of infection. (J) Similarly RAW 264.7 were infected and treated with CO as mentioned earlier. 24 h postinfection, CFUs were enumerated by plating the lysate on 7H11 plates. Data in panels B, D, F, G, H, I and J represent the mean±SEM from 3 independent experiments. Statistical significance was determined using the Student t test where ** indicates a P value < 0.01, and *** indicates a P value < 0.001.
Figure 3.
Figure 3.
Trafficking and clearance of Mtb in Hmox1 and Atg5 double-knockdown RAW 264.7 macrophages (A) 0.3 × 106 RAW 264.7 macrophages were transfected with siRNA specific for Hmox1 (50 nM) and Hmox1 along with Atg5 (50 nM) using DharmaFECT. Scrambled siRNA was used as a control. After 30 h, the cells were infected with GFP-Mtb H37Rv (1:5 MOI) for 3 h followed by IFNG treatment for 3 h. The lysosomes were stained with 300 nM LysoTracker Red for 20 min, fixed using 4% PFA and analyzed using confocal microscopy. The figure shows representative images of the colocalization of Mtb (green channel) and LysoTracker Red (red channel). (B) The percentage of Mtb-containing autophagosomes colocalized with lysosomes stained with LysoTracker Red (per 100 Mtb cells). (C) The hMOX1 knockdown and HMOX1 along with Atg5 double-knockdown macrophages were infected with Mtb (1:10 MOI) for 3 h, followed by gentamycin (100 μg/ml) treatment for 45 min. The cells were treated with IFNG for 3 h and the CFU plating was done 24 h postinfection. Briefly, the cells were lysed in 0.06% SDS after 24 h, dilutions were prepared and plated on 7H11 plates. Data in panels B and C represent the mean±SEM from 3 independent experiments. Statistical significance was determined using the Student t test where * indicates a P value <0.05, ** indicates a P value < 0.01, and *** indicates a P value < 0.001.
Figure 4.
Figure 4.
HMOX1 regulates autophagy in Mtb-infected animals. (A) Hmox1+/+, hmox1/+ and hmox1/ mice were infected (via aerosol challenge) with Mtb H37Rv to acquire an initial deposition of 100 to 200 CFU in mice lungs. After 4 wk of infection, the left lung was fixed in 10% formalin, and 5-μm-thick paraffin-embedded sections were obtained and stained with HandE. The hmox1/ mice exhibited more lesions compared with the Hmox1+/+ mice. The figure represents the lower (20X) and higher (200X) magnification image of the lungs. The first panel represents the HandE staining of the uninfected lung sections at 100X magnification. (B) The histopathology was scored on a scale from 0 (zero lesions) to 3 (more than 15 lesions), revealing a significant difference between Hmox1+/+ and hmox1/ mice (n = 3). The paraffin-embedded sections were deparaffinised and used for immunostaining to detect endogenous levels of the autophagy marker LC3 (C) and BECN1 (E). Anti-LC3B (1:500) (C), anti-BECN1 (1:500) (E) primary antibody and Alexa Fluor 488-labeled anti-rabbit (1:1500) and Alexa Fluor 561-labeled anti-rabbit (1:1500) secondary antibodies were used, respectively. The nuclei were stained with DAPI (1 μg/ml). The slides were observed under a confocal microscope, and the mean fluorescence intensity was quantified using ImageJ software (D, F). Data in panels D and F represent the mean±SEM from 3 independent experiments. Statistical significance was determined using the Student t test. * indicates a P value < 0.05 and *** indicates a P value < 0.001.
Figure 5.
Figure 5.
HMOX1-generated CO is required for increased intracellular calcium levels in response to IFNG. (A) RAW 264.7 macrophages (0.5 × 106) were independently treated with ZnPP (5 μM) and ZnPP (5 μM) along with CO (20 μM) for 2 h, followed by IFNG (200 units/ml) for 3 h. These cells were stained with 2 µM Fluo-3 AM for 1 h and analysis by flow cytometry. The mean fluorescence intensity plots were prepared using GraphPad Prism. (B) Peritoneal macrophages were isolated from the HMOX1+/+ and hmox1/ mice, exposed to IFNG for 3 h and the cells were stained with FLU-3AM. The mean fluorescence intensity was plotted. Data represent the mean±SEM from 3 independent experiments. Statistical significance was determined using the Student t test. (C) RAW 264.7 macrophages overexpressing tfLC3 were activated with IFNG in the presence or absence of the Ca2+ chelator BAPTA-AM and viewed under a confocal microscope. Representative confocal microscopy images are shown. The LC3 puncta per cell (D) and the percentage cells with > 5 autolysosomes (E) were calculated. (F) The same panel of cells as in (C) without transfection were subjected to western blotting. Densitometry analysis of LC3-II relative to ACTB in terms of fold change is shown below the blot. (G) 0.5 × 106 RAW 264.7 macrophages were transfected with GFP-LC3 plasmid using Lipofectamine 3000. Calcium-free DMEM-media was added to one panel of cells, 6 h prior to IFNG treatment. After 6 h, the cells were treated with IFNG, followed by fixation with 4% PFA and observed under the confocal microscope. Images are representative of 3 biological experiments. (H) The graph shows the average number of puncta/cell per 100 cells counted. Data in panel H represent the mean±SEM from 3 independent experiments. (I) Intracellular Ca2+ levels regulate the trafficking of intracellular Mtb. RAW 264.7 macrophages (0.5 × 106) were infected with GFP-Mtb H37Rv (1:5 MOI) for 3 h, followed by treatments with IFNG and BAPTA-AM, stained with LysoTracker Red and observed using a confocal microscope. The figure shows a representative image of the colocalization of Mtb (green channel) and LysoTracker Red (red channel). (J) Percentage of Mtb-containing autophagosomes colocalizing with lysosomes stained with LysoTracker Red (per 100 Mtb cells). (K) The same panel of cells was lysed in 0.06% SDS after 24 h and plated on 7H11 plates for calculating CFUs. Data in panels A, B, D, E, H, J and K represent the mean±SEM from 3 independent experiments. Statistical significance was determined using the Student t test. * indicates a P value < 0.05, ** indicates a P value < 0.01, and *** indicates a P value < 0.001.
Figure 6.
Figure 6.
IFNG induces lysosomal biogenesis by modulating intracellular Ca2+ levels. (A) RAW 264.7 macrophages were exposed to IFNG, and the levels of LAMP1 (lysosomal-associated membrane protein 1) were analyzed using confocal microscopy. (B) The difference in fluorescence intensity was determined using ImageJ software. (C) The same panel of cells depicted in panel (A) were subjected to western blotting and probed with the antibodies which has upregulated gene expression with respect to TFEB namely, SQSTM1, BECN1, LAMP1 and ATG5. ACTB was used as an internal loading control in these experiments. Numbers below the lanes indicate the fold change calculated using the densitometry analysis of LC3-II: ACTB. (D) Peritoneal macrophages were isolated from the Hmox1+/+ and hmox1/ mice, exposed to IFNG for 3 h and the lysate was prepared and was subjected to western blotting using antibodies for ATG5, SQSTM1, BECN1 and LAMP1. ACTB was used as an internal loading control in these experiments. Numbers below lanes indicate the fold change calculated using the densitometry analysis of LC3-II relative to ACTB. (E) Peritoneal macrophages were isolated from the Hmox1+/+ and hmox1/ mice, exposed to IFNG, and the levels of LAMP1 were analyzed using confocal microscopy. (F) The difference in fluorescence intensity was determined using ImageJ software. (G) RAW 264.7 macrophages were activated with IFNG in the presence of BAPTA-AM, and the levels of LAMP1 were assessed by confocal microscopy to evaluate the dependence of lysosomal biogenesis on the IFNG-mediated increase in intracellular Ca2+ levels. (H) The difference in fluorescence intensity was determined using ImageJ software. Data in panels B, F and H represent the mean±SEM from 3 independent experiments. Statistical significance was determined using the Student t test. ** indicates a P value < 0.01, and *** indicates a P value < 0.001.
Figure 7.
Figure 7.
The IFNG-HMOX1-Ca2+ signaling axis regulates the expression and nuclear translocation of TFEB. (A) RAW 264.7 macrophages were exposed to IFNG and then subjected to western blotting analysis of TFEB. Densitometric analysis in terms of the fold change of LC3-II relative to ACTB is shown below the blot. (B) Peritoneal macrophages were isolated from the Hmox1+/+ and hmox1/ mice, exposed to IFNG, and the endogenous TFEB was stained using antibody and observed under the confocal microscope. (C) The percentage of nuclear localization was determined using ImageJ software. (D) RAW 264.7 macrophages were treated with ZnPP (5 μM), exogenous CO (20 μM) and IFNG, as described previously, and endogenous TFEB was stained and observed under a confocal microscope. (E) The percentage of nuclear localization was determined using ImageJ software. (F) IFNG-activated macrophages were fractionated to isolate the nuclear and cytoplasmic fraction, and the samples were subjected to western blotting. The blots were probed with TFEB, histone H3 and GAPDH antibodies. (G) RAW 264.7 macrophages were activated with IFNG in the presence of BAPTA-AM, and the localization of endogenous TFEB was studied with the help of confocal microscopy. The percentage of nuclear localization was determined using ImageJ software (H). Data in panel C, E and H represent the mean±SEM from 3 independent experiments. Statistical significance was determined using the Student t test where ** indicates a P value < 0.01.
Figure 8.
Figure 8.
PPP3 plays an important role in IFNG-induced autophagy and mycobacterial clearance. (A) RAW 264.7 macrophages (0.5 × 106) were transiently transfected with Ppp3cb-specific or scrambled siRNAs and then activated them with IFNG and subjected to SDS-PAGE and western blot analysis. (B) The above findings were confirmed using the PPP3 -specific inhibitors cyclosporin A (CsA) and FK506. Densitometry analysis of LC3-II relative to ACTB is shown below the blot in panel A and B. (C) RAW 264.7 macrophages (0.5 × 106) were transiently transfected with GFP-LC3 plasmid and independently treated with cyclosporin A (CsA) (10 µM) and FK506 (5 µM) for 1 h, followed by IFNG for 3 h and viewed under a confocal microscope. Representative confocal microscopy images are shown. The LC3 puncta per cell (D) and the percentage of cells with >5 LC3 puncta (E) were calculated. Similar panel of cells was stained with TFEB (F) and LAMP1 (H), and the nuclear localization of TFEB (G and fluorescence intensity of LAMP1 (I) were determined using ImageJ software. (J) RAW 264.7 macrophages (0.5 × 106) were infected with GFP-Mtb H37Rv (1:5 MOI) for 3 h, followed by treatments with IFNG, CsA and FK506 as described and observed using a confocal laser scanning microscope. The figure shows representative images of the colocalization of Mtb (green channel) and LysoTracker Red (red channel). (K) Percentage of Mtb-containing autophagosomes colocalizing with lysosomes stained with LysoTracker Red (per 100 cells). (L) The same panel of cells were lysed in 0.06% SDS after 24 h of infection and plated on 7H11 to calculate CFUs. Data in panels D, E, G, I, K and L are mean±SEM from 3 independent experiments. ** indicates a P value < 0.01, and *** indicates a P value < 0.001.
Figure 9.
Figure 9.
IFNG-induced autophagy is regulated by HMOX1. IFNG can induce autophagy through multiple pathways namely: IRGM/LRG-47, MAPK14, JAK1/2, EIF2AK4, IRF1 (interferon regulatory factor 1) or CEBPB. The model depicts the autophagic induction by IFNG through above-mentioned pathways and highlights the new signaling axis identified in the current study (Pathway depicted with red arrows). IFNG leads to the induction of HMOX1 and hence its product CO. The HMOX1-generated CO leads to the increase in cytoplasmic calcium levels that activates PPP3. This phosphatase dephosphorylates TFEB which leads to the transport of TFEB into the nucleus and hence the increase in autophagic flux and lysosomal biogenesis.

Similar articles

Cited by

References

    1. Stark GR, Kerr IM, Williams BR, et al. How cells respond to interferons [Review]. Annu Rev Biochem. 1998;67:227–264. doi: 10.1146/annurev.biochem.67.1.227. PubMed PMID: 9759489; eng. - DOI - PubMed
    1. Schroder K, Hertzog PJ, Ravasi T, et al. Interferon-gamma: an overview of signals, mechanisms and functions [Review]. J Leukoc Biol. 2004;75(2):163–189. doi: 10.1189/jlb.0603252. PubMed PMID: 14525967; eng. - DOI - PubMed
    1. Flesch I, Kaufmann SH. Mycobacterial growth inhibition by interferon-gamma-activated bone marrow macrophages and differential susceptibility among strains of Mycobacterium tuberculosis [Comparative Study Research Support, Non-U.S. Gov't]. J Immunol. 1987;138(12):4408—4413. PubMed PMID: 3108389; eng. - PubMed
    1. Flynn JL, Chan J, Triebold KJ, et al. An essential role for interferon gamma in resistance to Mycobacterium tuberculosis infection. J Exp Med. 1993;178(6):2249–2254. PubMed PMID: 7504064; PubMed Central PMCID: PMC2191274. eng. - PMC - PubMed
    1. Gutierrez MG, Master SS, Singh SB, et al. Autophagy is a defense mechanism inhibiting BCG and Mycobacterium tuberculosis survival in infected macrophages. Cell. 2004;119(6):753–766. doi: S0092867404011067 [pii] 10.1016/j.cell.2004.11.038. PubMed PMID: 15607973; eng. - DOI - PubMed

Publication types

MeSH terms