. 2020 Nov;11(6):402-412.
doi: 10.1080/21541248.2018.1441626. Epub 2018 Mar 8.

The Rap2c GTPase facilitates B cell receptor-induced reorientation of the microtubule-organizing center

Affiliations

The Rap2c GTPase facilitates B cell receptor-induced reorientation of the microtubule-organizing center

Jia C Wang et al. Small GTPases. 2020 Nov.

Abstract

When B lymphocytes encounter antigen-bearing surfaces, B-cell receptor (BCR) signaling initiates remodeling of the F-actin network and reorientation of the microtubule-organizing center (MTOC) towards the antigen contact site. We have previously shown that the Rap1 GTPase, an evolutionarily conserved regulator of cell polarity, is essential for these processes and that Rap1-regulated actin remodeling is required for MTOC polarization. The role of Rap2 proteins in establishing cell polarity is not well understood. We now show that depleting Rap2c, the only Rap2 isoform expressed in the A20 B-cell line, impairs BCR-induced MTOC reorientation as well as the actin remodeling that supports MTOC polarization. Thus Rap1 and Rap2 proteins may have similar but non-redundant functions in coupling the BCR to MTOC polarization.

Keywords: B cell, B cell receptor (BCR); Rap1; Rap2; microtubule-organizing center (MTOC).


Figures
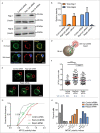
Figure 1.
Figure 1.
siRNA-mediated depletion of Rap1a/b or Rap2c impairs BCR-induced MTOC reorientation. (A-B) A20 cells were transfected with either control siRNA, siRNAs targeting both Rap1a and Rap1b, or Rap2c siRNA. Cell lysates were immunoblotted with antibodies that recognize all Rap1 isoforms or all Rap2 isoforms. β-actin was used a loading control. A representative western blot is shown (A). Protein densities were quantified for total Rap1 or total Rap2, normalized to the β-actin loading controls for the same sample, and expressed as values relative to the cells that had been transduced with control siRNA (defined as 1.0). Mean and SEM are shown for 3 independent experiments (B). (C) Rap2c-YFP-expressing A20 cells were left unstimulated or mixed with anti-Ig-coated beads for 5 min before being fixed and stained for F-actin using rhodamine-phalloidin. Representative images are shown. (D) The MTOC polarity index for B cells interacting with anti-Ig-coated beads is quantified as distance “a” divided by distance “b”. (E-H) A20 cells that had been transfected with control siRNA, Rap1a/b siRNAs, or Rap2c siRNA were incubated for 30 min with anti-IgG-coated beads (red) before being fixed and immunostained for α-tubulin (green). White arrows point to the MTOCs. Representative xy confocal images are shown (E). MTOC polarity indices were quantified for each bead:cell conjugate and are shown as a dot plot in panel F. Each dot is an individual cell. For each condition, n >111 cells from 3 independent experiments. Red bars indicate the median values. ****P <0.0001, as determined using an unpaired 2-tailed t-test. The percent of cells with a polarity index (PI) ≤0.75 (blue dashed line) is indicated below the graph. The same data are presented as cumulative frequency distributions in panel G. The dots on the distribution curves indicate the median polarity index values. The MTOC polarity index distributions for the Rap1a/b siRNA and Rap2c siRNA cells were significantly different than that for the control siRNA cells (P <0.0001), as determined using the Kolmogorov-Smirnov test. In panel H the MTOC polarity indices are binned according to the extent of polarization. Scale bars in panels C and E: 5 μm.
Figure 2.
Figure 2.
siRNA-mediated depletion of either Rap1a/b or Rap2c impairs MTOC reorientation at both 30 min and 60 min. A20 cells that had been transfected with control siRNA, siRNAs targeting both Rap1a and Rap1b, or Rap2c siRNA were incubated for 5, 30, or 60 min with anti-IgG-coated beads (red) before being fixed and immunostained for α-tubulin (green). Representative xy confocal images are shown in panel A. For the 60-min time point, two representative Rap2c siRNA cells are shown, one in which the MTOC did not polarize towards the anti-IgG-coated bead (left image) and one in which the MTOC was in close proximity to the site of contact with the anti-Ig-coated bead (right image). Scale bar: 5 μm. Panel B shows the cumulative frequency distributions of the MTOC polarity indices. For each condition and time point >43 cells from 2 independent experiments were analyzed. The dots on the distribution curves indicate the median polarity index values. The Kolmogorov-Smirnov test showed that the MTOC polarity index distributions were not significantly different at the 5-min time point (P >0.05) but that the MTOC polarity index distributions for the Rap1a/b siRNA and the Rap2c siRNA cells were significantly different than that for the control siRNA cells at both 30 min (P<0.0001) and 60 min (Rap1a/b siRNA: P <0.0001; Rap2c siRNA: P = 0.002).
Figure 3.
Figure 3.
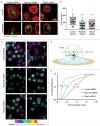
Both Rap1a/b and Rap2c are important for B cell spreading and for MTOC reorientation. A20 cells that had been transfected with control siRNA, Rap1a/b siRNAs, or Rap2c siRNA were added to anti-Ig-coated coverslips and allowed to spread for 15 min. The cells were stained with α-tubulin antibodies (green) and with rhodamine-phalloidin (red) to visualize F-actin. (A) Representative images of the xy slices closest to the coverslip as well as the z-projections for the cells indicated by the white circles are shown. Scale bar: 5 μm. (B) Cell area at the contact side with the coverslip. For each type of siRNA-transfected cells, >76 cells from 3 independent experiments were analyzed. Red bars indicate the median values. ****P <0.0001 compared to control siRNA cells, as determined using an unpaired 2-tailed t-test. (C) Maximum projection images are shown for two random field of cells from the same samples. The α-tubulin staining in each successive z-slice is pseudocolored according to its distance from the coverslip. The violet color indicates microtubules that are closest to the coverslip. Scale bar: 10 μm. (D) The MTOC polarity index for B cells interacting with anti-Ig-coated coverslips is calculated as distance “a” divided by distance “b”. (E) Cumulative frequency distributions of the MTOC polarity indices for the same samples as in panels B and C. The dots on the distribution curves indicate the median polarity index values. The Kolmogorov-Smirnov test showed that MTOC polarity index distributions for the Rap1a/b siRNA and the Rap2c siRNA cells were significantly different than that for the control siRNA cells (P <0.0001).
Figure 4.
Figure 4.
Rap1a/b and Rap2c coordinately regulate cell spreading and MTOC polarization. A20 cells that had been transfected with control siRNA, Rap1a/b siRNAs, or Rap2c siRNA were added to anti-Ig-coated coverslips and allowed to spread for 15 min. The cells were then stained with α-tubulin antibodies, and with rhodamine-phalloidin to visualize F-actin and delineate the cell periphery. The cell area in the confocal plane closest to the coverslip, as well as the MTOC polarity index, was determined for each cell. For each type of siRNA-transfected cells, >76 cells from 3 independent experiments were analyzed. Note that these are the same cells that were analyzed in Fig. 3. For each cell, its area at the contact site with the anti-Ig-coated coverslips (x-axis) and its MTOC polarity index (y-axis) are plotted on the same graph. Each dot represents an individual cell. Cells with an area >100 µm2 (to the right of the green dotted lines) were considered to have spread. The blue dashed lines indicate an MTOC polarity index of 0.75. The percent of cells that had spread and polarized their MTOC, i.e. an area greater than 100 μm [2] and a polarity index ≤0.75, is shown in the lower right quadrants. The percent of cells that had neither spread nor polarized their MTOC is shown in the upper left quadrants.

Similar articles

Cited by

References

    1. Schwamborn JC, Puschel AW.. The sequential activity of the GTPases Rap1B and Cdc42 determines neuronal polarity. Nature Neurosci. 2004;7(9):923–929. doi:10.1038/nn1295 - DOI - PubMed
    1. Ebisuno Y, Katagiri K, Katakai T, et al. Rap1 controls lymphocyte adhesion cascade and interstitial migration within lymph nodes in RAPL-dependent and -independent manners. Blood. 2010;115(4):804–814. doi:10.1182/blood-2009-03-211979 - DOI - PubMed
    1. Frische EW, Zwartkruis FJ. Rap1, a mercenary among the Ras-like GTPases. Dev Biol. 2010;340(1):1–9. doi:10.1016/j.ydbio.2009.12.043 - DOI - PubMed
    1. Lagarrigue F, Kim C, Ginsberg MH. The Rap1-RIAM-talin axis of integrin activation and blood cell function. Blood. 2016;128(4):479–487. doi:10.1182/blood-2015-12-638700 - DOI - PMC - PubMed
    1. Paganini S, Guidetti GF, Catricala S, et al. Identification and biochemical characterization of Rap2C, a new member of the Rap family of small GTP-binding proteins. Biochimie. 2006;88(3–4):285–295. doi:10.1016/j.biochi.2005.08.007 - DOI - PubMed

Publication types

Grants and funding

LinkOut - more resources