. 2018 Feb 20;18(1):2.
doi: 10.1186/s12861-018-0163-7.

Dynamics of promoter bivalency and RNAP II pausing in mouse stem and differentiated cells

Affiliations

Dynamics of promoter bivalency and RNAP II pausing in mouse stem and differentiated cells

Anna Mantsoki et al. BMC Dev Biol. .

Abstract

Background: Mammalian embryonic stem cells display a unique epigenetic and transcriptional state to facilitate pluripotency by maintaining lineage-specification genes in a poised state. Two epigenetic and transcription processes involved in maintaining poised state are bivalent chromatin, characterized by the simultaneous presence of activating and repressive histone methylation marks, and RNA polymerase II (RNAPII) promoter proximal pausing. However, the dynamics of histone modifications and RNAPII at promoters in diverse cellular contexts remains underexplored.

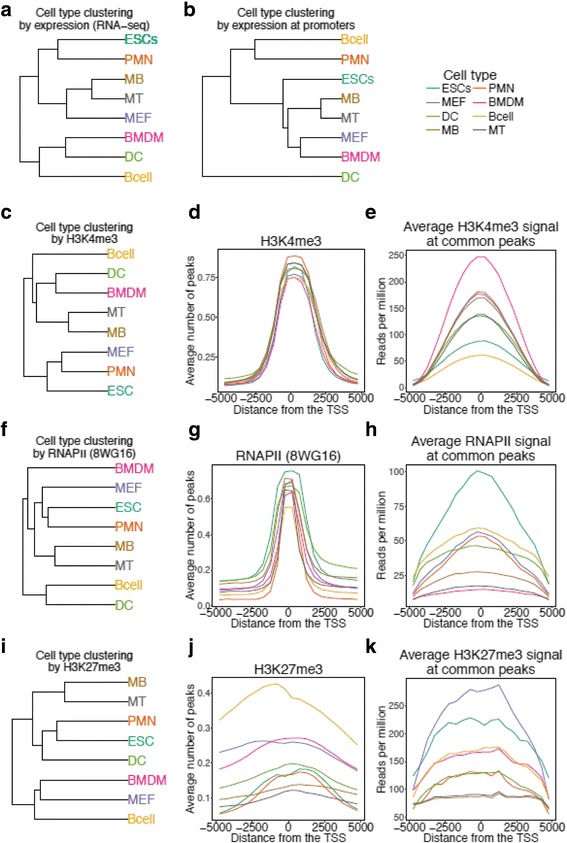
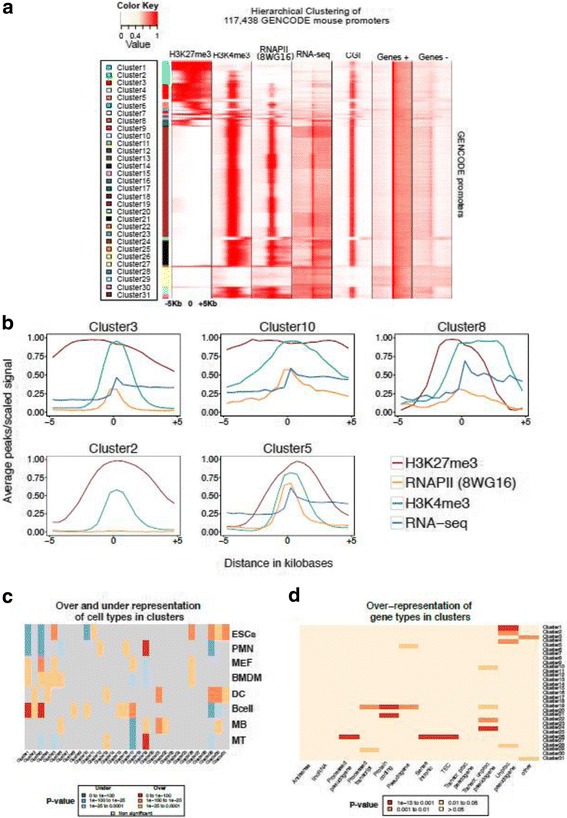
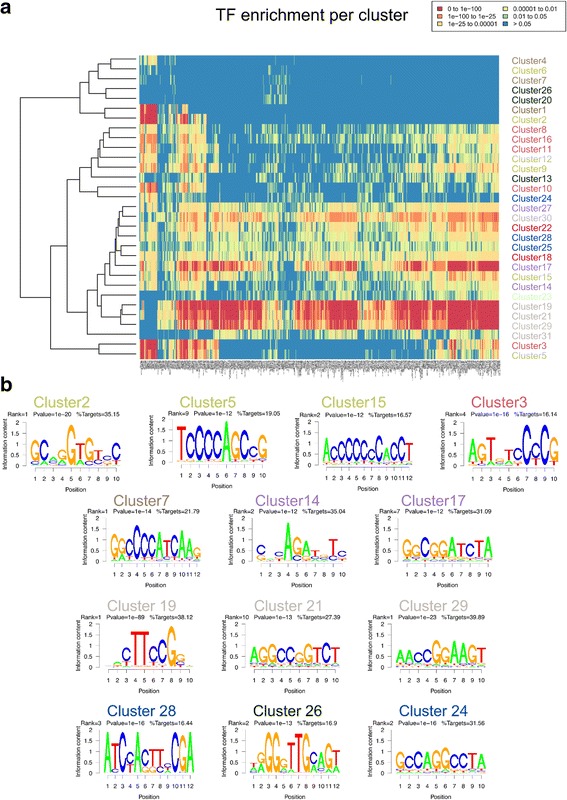
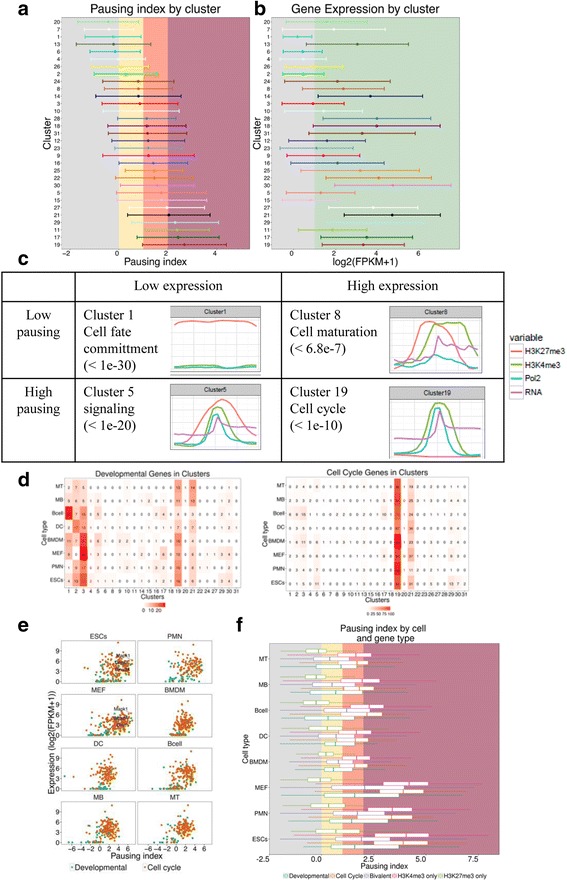
Results: We collected genome wide data for bivalent chromatin marks H3K4me3 and H3K27me3, and RNAPII (8WG16) occupancy together with expression profiling in eight different cell types, including ESCs, in mouse. The epigenetic and transcription profiles at promoters grouped in over thirty clusters with distinct functional identities and transcription control.

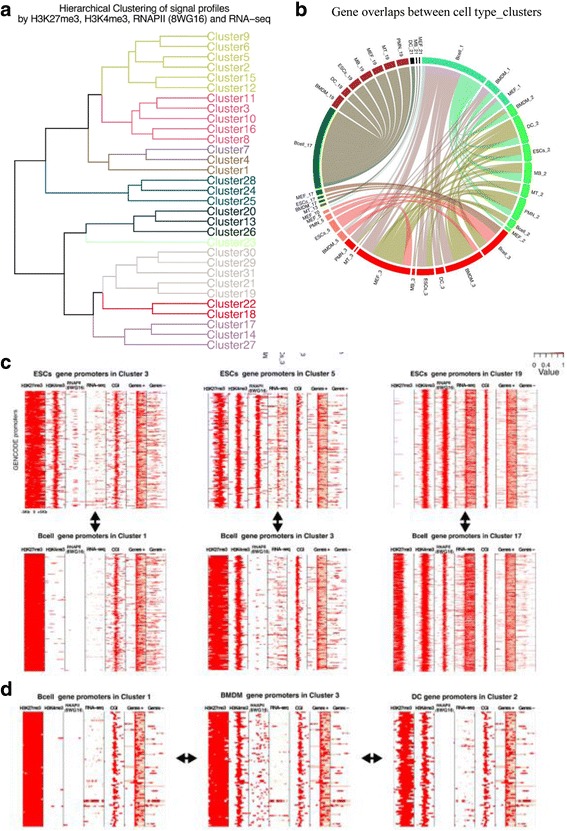
Conclusion: The clustering analysis identified distinct bivalent clusters where genes in one cluster retained bivalency across cell types while in the other were mostly cell type specific, but neither showed a high RNAPII pausing. We noted that RNAPII pausing is more associated with active genes than bivalent genes in a cell type, and was globally reduced in differentiated cell types compared to multipotent.

Keywords: Bivalent; Chromatin; ES cells; Gene expression; Pausing; RNA pol II.


Conflict of interest statement

Ethics approval and consent to participate

Not Applicable

Consent for publication

Not Applicable

Competing interests

The authors declare that they have no competing interests.

Publisher’s Note

Springer Nature remains neutral with regard to jurisdictional claims in published maps and institutional affiliations.

Figures

Fig. 1
Fig. 1
Expression, H3K4me3, H3K27me3 and RNAPII (8WG16) signatures at promoters of 22,179 genes in eight mouse cell types. a Hierarchical clustering of normalised expression values (see Methods) across eight cell types results in a tree where biological relationships between cell types are largely reconstituted. b Hierarchical clustering of average normalized RNA-seq signal (reads per million -RPM) across the gene promoters (±5 kb) for eight cell types. c Hierarchical clustering of H3K4me3 marked promoters across all cell types results in a tree in agreement with the known developmental relationships between cell types. d The average number of H3K4me3 detected peaks at the promoters is highly consistent across all the cell types. e The average H3K4me3 signal at common peaks across all cell types is highly variant, with BMDMs showing the strongest signal. f Hierarchical clustering of RNAPII (8WG16) binding is closely correlated with the H3K4me3 tree, rather than the expression tree. g The average number of RNAPII peaks at the promoters is consistent across cell types, however less than in H3K4me3 marked promoters. h The average RNAPII signal at common peaks at the promoters is highly variant with ESCs displaying the strongest signal. i Hierarchical clustering of H3K27me3 marked promoters across all cell types results in a tree where only the relationships of MBs and MTs are reconstituted. j The average number of H3K27me3 peaks at the promoters is variable across the cell types, with B cells showing the largest number of detected peaks in all cell types. k The average H3K27me3 signal at common peaks is highly variant across cell types with MEFs showing the strongest signal
Fig. 2
Fig. 2
Epigenetic and expression profiles for 31 distinct clusters and their characterisation. a Hierarchical clustering of the profiles of H3K27me3 (peaks), H3K4me3 (peaks), RNAPII (peaks) and expression signal (reads per million) across 117,438 distinct gene promoter-cell type pairs. 31 clusters of distinct signatures were detected. b Average number of peaks /Average RNA-seq signal at representative clusters from 31 clusters, displaying divergent epigenetic and transcription profiles. c Under and over-representation of cell types in each cluster (significance was assessed with hypergeometric test). d Under and over-representation of gene types per cluster (significance was assessed with hypergeometric test)
Fig. 3
Fig. 3
Transcription factor binding and motif enrichment across the clusters. a Transcription-related factor binding enrichment using the CODEX (Sánchez-Castillo et al. 2015) ChIP-seq data compendium (see Methods). All clusters were significantly enriched (hypergeometric test - P value < 0.01) for at least one factor. b Thirteen clusters showed at least one de-novo motif enrichment with more than 15% of targets and P value < 10− 10
Fig. 4
Fig. 4
Promoter dynamic across cell types and chromatin states. a Hierarchical clustering of the average profile signals across clusters results in the identification of 9 major profile sub-groups. b Significant chromatin state transitions across cell types and clusters. Four major chromatin state changes across cell type pairs emerged, namely H3K27me3-only <− > bivalent-wide-H3K27me3, H3K27me3-only <− > bivalent-narrow-H3K27me3, bivalent-narrow-H3K27me3 < −> bivalent-active and bivalent-active <− > highly-active. c Bivalent-wide-H3K27me3 cluster 3 promoters in ESCs overlapped highly H3K27me3-only cluster 1 promoters in B cells and were enriched for ‘pattern specification process’ (P value < 10− 30). Bivalent-narrow-H3K27me3 cluster 5 promoters in ESCs overlapped highly with bivalent-wide-H3K27me3 cluster 3 promoters in B cells and were enriched for ‘Nervous system development’ (P value < 10− 30). Highly-active cluster 19 promoters in ESCs overlapped highly with boundary-H3K27me3-active cluster 17 promoters in B cells and were enriched for ‘ncRNA metabolic process’ (P value < 1.7.10− 23). d Significant sets of genes overlapping in 3 distinct cell types and clusters. 98 genes enriched for ‘cell fate commitment’ (P value < 3.2.10− 7) were present in B cells in cluster 1, in DCS in cluster 2 and in BMDMS in cluster 3
Fig. 5
Fig. 5
RNAPII pausing across clusters and cell types. a Distribution of pausing indices across gene promoters in all 31 clusters in our study. Clusters are ordered according to their mean pausing index. The colours in the background denote the level of RNAPII pausing - grey: no pausing, yellow: low pausing, red: mid pausing, dark red: high pausing. b Distribution of expression levels (log2(FPKM+ 1)) of genes in each cluster. The clusters arranged in the same order as in Fig. 5a. The colour background denotes a threshold on expression (log2(FPKM+ 1) =1) as defined in Additional file 1: Figure S1 – grey: lowly or not expressed, green: expressed. c Four representative clusters displaying four combinations of RNAPII pausing and gene expression. d Distribution of developmental (GO:0045165, GO:0048864, GO:0007498) and cell cycle (GO:0007049) genes across clusters. e RNAPII pausing vs expression for developmental and cell cycle genes (see Methods) across cell types. f Mean pausing indices for diverse gene sets in each cell type. The gene sets were developmental, cell-cycle as well as bivalent, H3K4me3-only and H3K27me3-only genes in ES cells

Similar articles

Cited by

References

    1. Reik W. Stability and flexibility of epigenetic gene regulation in mammalian development. Nat Publ Group. 2007;447:425–432. - PubMed
    1. Rivera CM, Ren B. Mapping Human Epigenomes. Cell. 2013;155:39–55. doi: 10.1016/j.cell.2013.09.011. - DOI - PMC - PubMed
    1. Zhu J, Adli M, Zou JY, Verstappen G, Coyne M, Zhang X, et al. Genome-wide chromatin state transitions associated with developmental and environmental cues. Cell. 2013;152:642–654. doi: 10.1016/j.cell.2012.12.033. - DOI - PMC - PubMed
    1. Xie W, Schultz MD, Lister R, Hou Z, Rajagopal N, Ray P, et al. Epigenomic analysis of multilineage differentiation of human embryonic stem cells. Cell. 2013;153:1134–1148. doi: 10.1016/j.cell.2013.04.022. - DOI - PMC - PubMed
    1. Thurman RE, Rynes E, Humbert R, Vierstra J, Maurano MT, Haugen E, et al. The accessible chromatin landscape of the human genome. Nature. 2012;489:75–82. doi: 10.1038/nature11232. - DOI - PMC - PubMed

Publication types