. 2018 Feb 20;6(1):38.
doi: 10.1186/s40168-018-0422-7.

The genomic underpinnings of eukaryotic virus taxonomy: creating a sequence-based framework for family-level virus classification

Affiliations

The genomic underpinnings of eukaryotic virus taxonomy: creating a sequence-based framework for family-level virus classification

Pakorn Aiewsakun et al. Microbiome. .

Abstract

Background: The International Committee on Taxonomy of Viruses (ICTV) classifies viruses into families, genera and species and provides a regulated system for their nomenclature that is universally used in virus descriptions. Virus taxonomic assignments have traditionally been based upon virus phenotypic properties such as host range, virion morphology and replication mechanisms, particularly at family level. However, gene sequence comparisons provide a clearer guide to their evolutionary relationships and provide the only information that may guide the incorporation of viruses detected in environmental (metagenomic) studies that lack any phenotypic data.

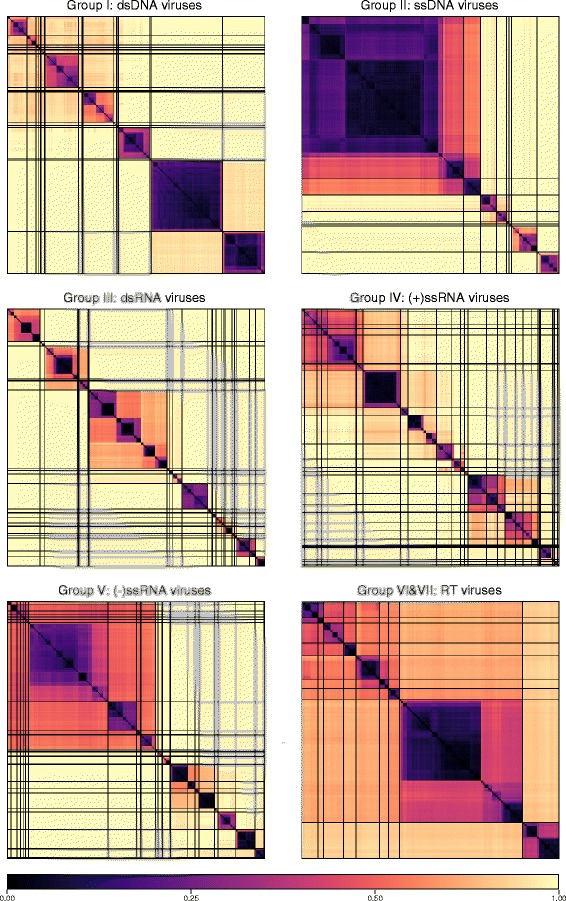
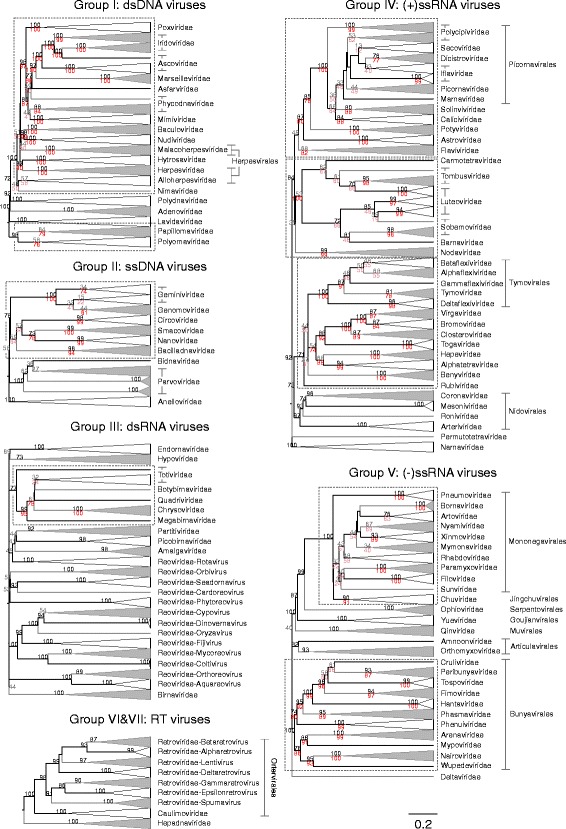
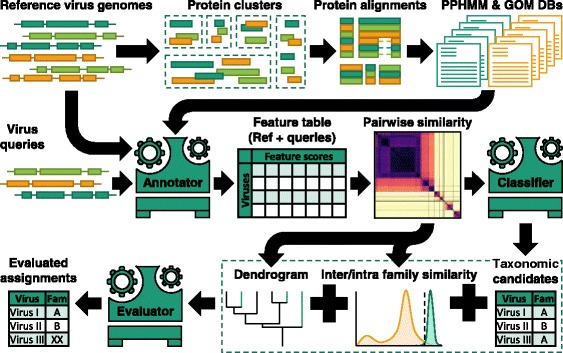
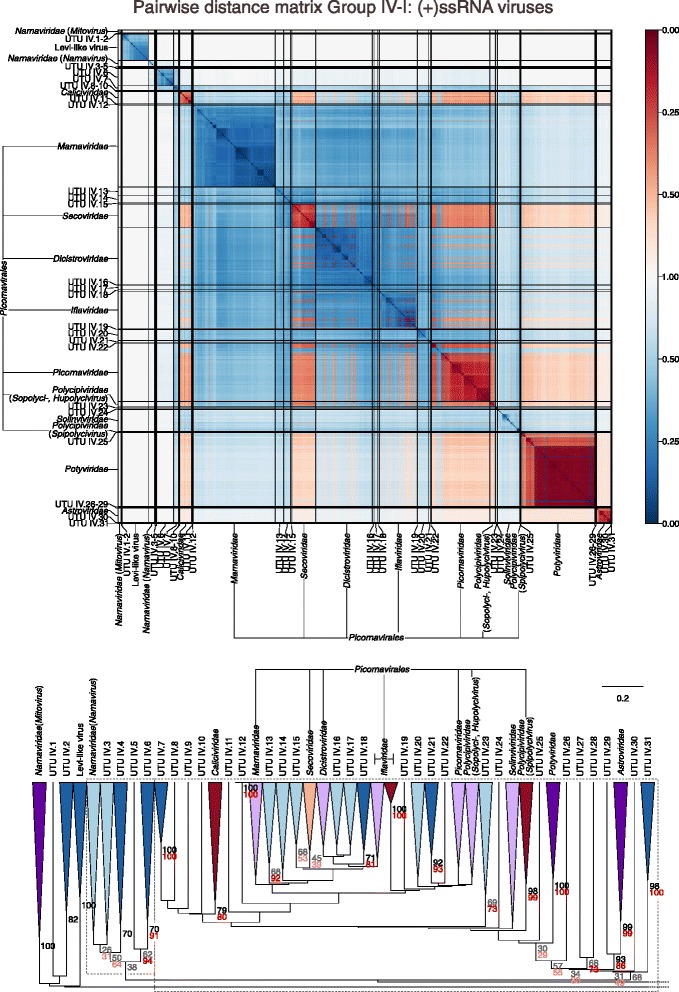
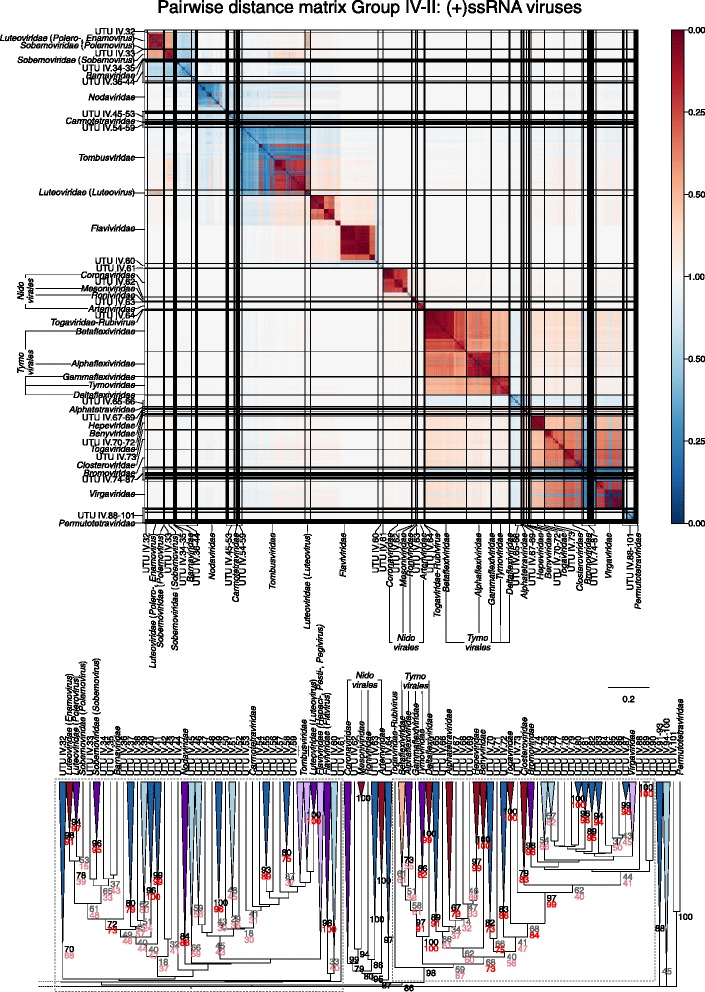
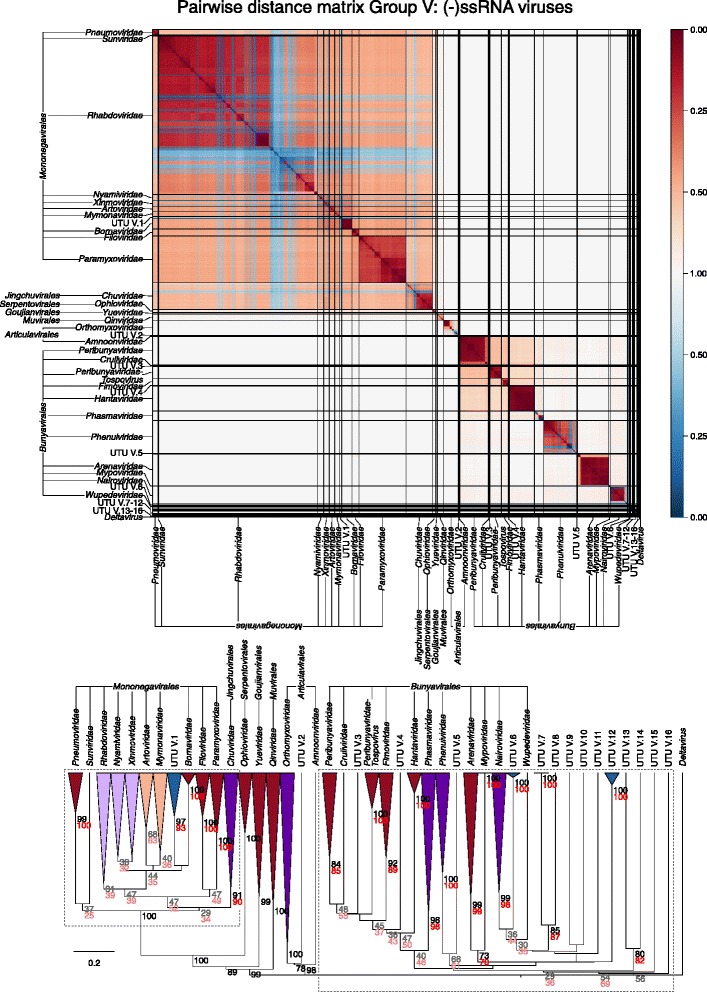
Results: The current study sought to determine whether the existing virus taxonomy could be reproduced by examination of genetic relationships through the extraction of protein-coding gene signatures and genome organisational features. We found large-scale consistency between genetic relationships and taxonomic assignments for viruses of all genome configurations and genome sizes. The analysis pipeline that we have called 'Genome Relationships Applied to Virus Taxonomy' (GRAViTy) was highly effective at reproducing the current assignments of viruses at family level as well as inter-family groupings into orders. Its ability to correctly differentiate assigned viruses from unassigned viruses, and classify them into the correct taxonomic group, was evaluated by threefold cross-validation technique. This predicted family membership of eukaryotic viruses with close to 100% accuracy and specificity potentially enabling the algorithm to predict assignments for the vast corpus of metagenomic sequences consistently with ICTV taxonomy rules. In an evaluation run of GRAViTy, over one half (460/921) of (near)-complete genome sequences from several large published metagenomic eukaryotic virus datasets were assigned to 127 novel family-level groupings. If corroborated by other analysis methods, these would potentially more than double the number of eukaryotic virus families in the ICTV taxonomy.

Conclusions: A rapid and objective means to explore metagenomic viral diversity and make informed recommendations for their assignments at each taxonomic layer is essential. GRAViTy provides one means to make rule-based assignments at family and order levels in a manner that preserves the integrity and underlying organisational principles of the current ICTV taxonomy framework. Such methods are increasingly required as the vast virosphere is explored.

Keywords: Baltimore classification; Hidden Markov model; Metagenomic; Taxon; Taxonomy; Virus; Virus classification.


Conflict of interest statement

Ethics approval

Not applicable

Consent for publication

Not applicable

Competing interests

Both authors declare that they have no competing interests.

Publisher’s Note

Springer Nature remains neutral with regard to jurisdictional claims in published maps and institutional affiliations.

Figures

Fig. 1
Fig. 1
Heat maps of Jaccard distances between virus taxonomic groups. Pairwise distances, D (based upon 1 – J, the composite generalised Jaccard similarity index) were computed between each sequence in the Baltimore group and plotted on heat maps as colour-coded points (see scale at the bottom of the figure). The light grey solid lines indicate boundaries between each virus taxonomic group, and the data is organised such that groups with high similarities are closer to one another. For larger heat maps with annotations for virus family and order, see Additional file9: Figures S1–S6
Fig. 2
Fig. 2
Virus dendrograms based on composite Jaccard distances. UPGMA dendrograms were constructed from pairwise distance matrices shown in Fig. 1. Tips are labelled with family and genus assignments used in our virus classification study. Virus taxonomy at the order level is also shown to the right of the dendrograms. The scale bar for D is shown at the bottom (see Additional file 10: Figures S7–S12 for dendrograms additionally annotated for individual sequences (accession numbers) and genus assignments). Bootstrap clade support values (≥ 30%) are shown on the branches. Those in black (≥ 70%) and grey (< 70%) were calculated for the entire dendrograms. A number of specific clades were re-bootstrapped (dotted boxes) with pruned signature tables, and for these, the derived clade support values are shown in red (≥ 70%) or pink (< 70%)
Fig. 3
Fig. 3
Feature importance in different virus groups for family assignments. Mutual information (MI) scores are used to evaluate what features were predictive of virus taxonomy. Features with high MI scores are those that vary among virus taxonomic groups, but are at the same time, shared values by viruses in the same family. Only features associated with protein profiles and have MI scores greater than 0.1 are shown. Assignments to replicative, other non-structural and structural genes are described in the ‘Methods’ section
Fig. 4
Fig. 4
Overview of virus taxonomy prediction by GRAViTy. Schematic diagram of the processing steps used to construct classifiers based on viruses with assigned taxonomic status (reference virus genomes) and the pipeline used to classify viruses of interest (virus queries). In summary, protein sequences are extracted from reference virus genomes and clustered based on pairwise BLASTp bit scores. Sequences in each cluster are then aligned and turned into a protein profile hidden Markov model (PPHMM). Reference genomes are subsequently scanned against the database of PPHMMs to determine the locations of their genes and genomic organisation models (GOMs) for each virus family are constructed. PPHMM and GOM databases are the main machinery of our genome annotator (Annotator). To classify viruses of interest, they, together with the reference viruses, are first annotated with information on the presence of genes and the degree of similarity of their genomic organisation to various reference families (Feature table). Pairwise similarity scores (composite generalised Jaccard similarity) is then estimated and passed to the classifier to identify taxonomic candidates for each query using the 1-nearest neighbour algorithm. A UPGMA dendrogram and a similarity acceptance cut-off for each virus family are also estimated from the pairwise similarity scores and used by the evaluator to evaluate the taxonomic candidates. The analysis is performed in parallel for the six virus Baltimore groups; those showing best matches are the finalised taxonomic assignments
Fig. 5
Fig. 5
Genome relationships of metagenomic-derived viruses in Baltimore group II. Pairwise distance matrices (upper panel) and dendrogram (lower panel) for ssDNA viruses classified by ICTV (red) and newly described, currently unclassified viruses (blue). Novel taxa predicted by GRAViTy are labelled as unassigned taxonomy units (UTU) and numbered sequentially. Bootstrap clade support values (≥ 30%) are shown on the branches. Those in black (≥ 70%) and grey (< 70%) were calculated for the entire dendrograms. Several clades were re-bootstrapped with pruned signature tables (dotted boxes), and the re-bootstrap clade support values are shown in red (≥ 70%) or pink (< 70%). The shading of clades depicts the degree of bootstrap support; ≥ 70% dark shading; < 70% light shading. Clades containing both classified and unclassified viruses were shaded in purple
Fig. 6
Fig. 6
Genome relationships of metagenomic-derived viruses in Baltimore group III (see legend to Fig. 5)
Fig. 7
Fig. 7
Genome relationships of metagenomic-derived viruses in Baltimore group IV, part 1 (see legend to Fig. 5)
Fig. 8
Fig. 8
Genome relationships of metagenomic-derived viruses in Baltimore group IV, part 2 (see legend to Fig. 5)
Fig. 9
Fig. 9
Genome relationships of metagenomic-derived viruses in Baltimore group V (see legend to Fig. 5)

References

    1. Abergel C, Legendre M, Claverie JM. The rapidly expanding universe of giant viruses: Mimivirus, Pandoravirus, Pithovirus and Mollivirus. FEMS Microbiol Rev. 2015;39:779–796. doi: 10.1093/femsre/fuv037. - DOI - PubMed
    1. Baltimore D. Expression of animal virus genomes. Bacteriol Rev. 1971;35:235–241. - PMC - PubMed
    1. Edwards RA, Rohwer F. Viral metagenomics. Nat Rev Microbiol. 2005;3:504–510. doi: 10.1038/nrmicro1163. - DOI - PubMed
    1. Mokili JL, Rohwer F, Dutilh BE. Metagenomics and future perspectives in virus discovery. Curr Opin Virol. 2012;2:63–77. doi: 10.1016/j.coviro.2011.12.004. - DOI - PMC - PubMed
    1. Rosario K, Breitbart M. Exploring the viral world through metagenomics. Curr Opin Virol. 2011;1:289–297. doi: 10.1016/j.coviro.2011.06.004. - DOI - PubMed

Publication types

LinkOut - more resources