. 2018 Feb 19;9(1):716.
doi: 10.1038/s41467-018-03137-8.

Insight into induced charges at metal surfaces and biointerfaces using a polarizable Lennard-Jones potential

Affiliations

Insight into induced charges at metal surfaces and biointerfaces using a polarizable Lennard-Jones potential

Isidro Lorenzo Geada et al. Nat Commun. .

Abstract

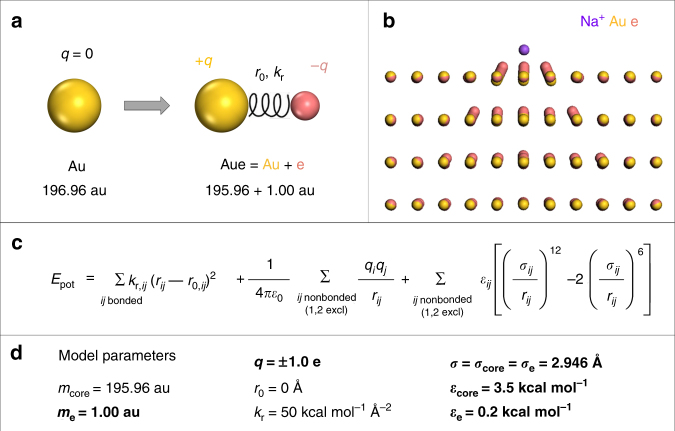
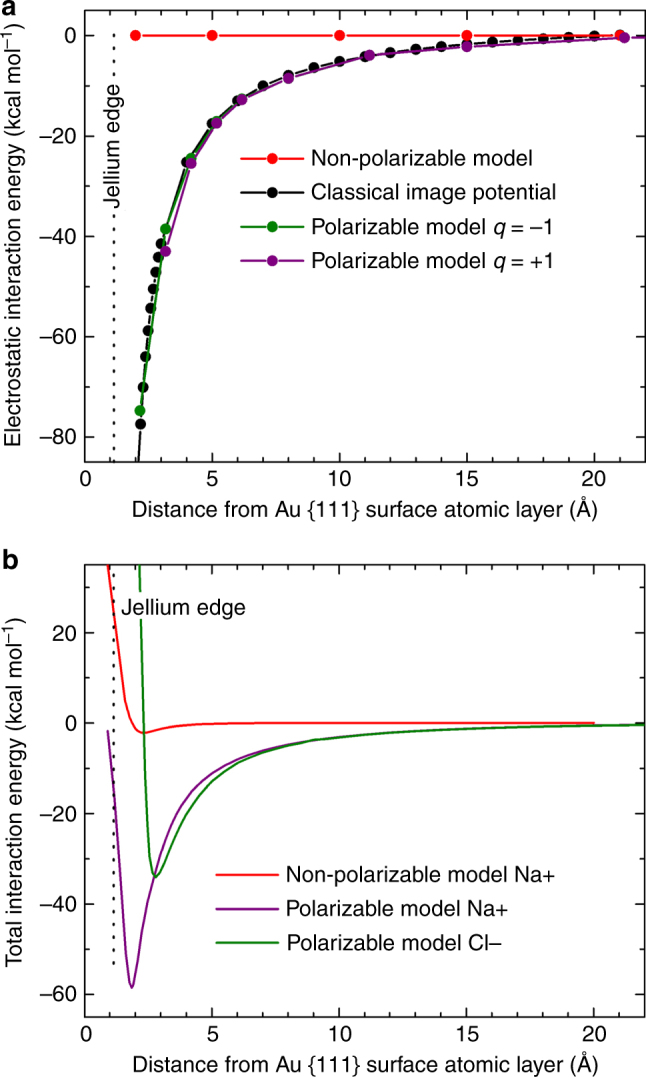
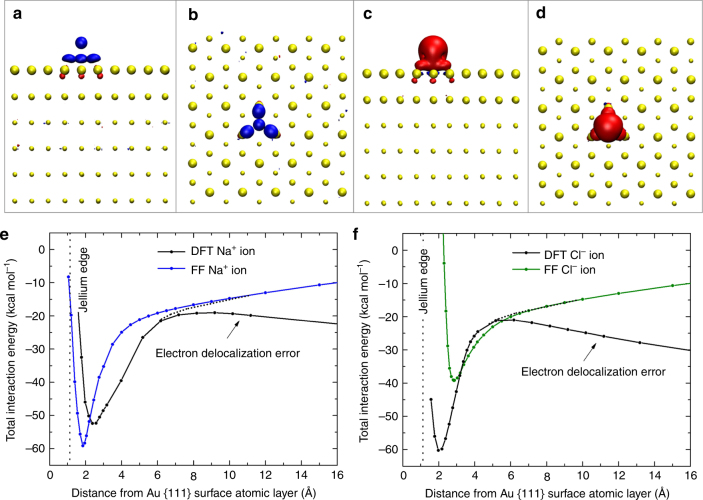
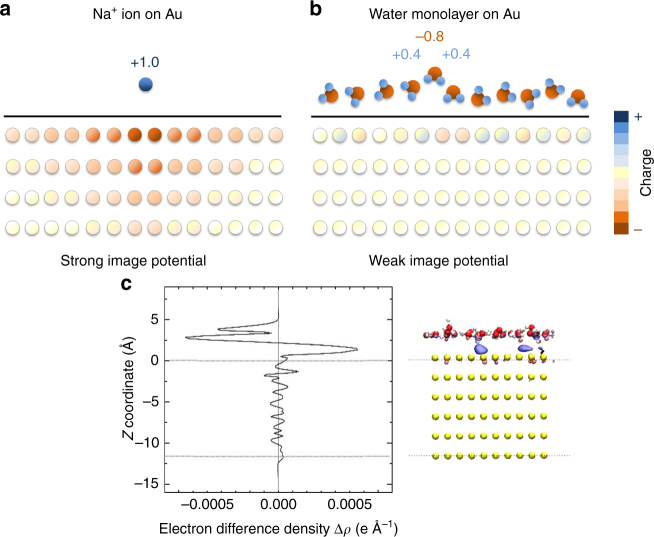
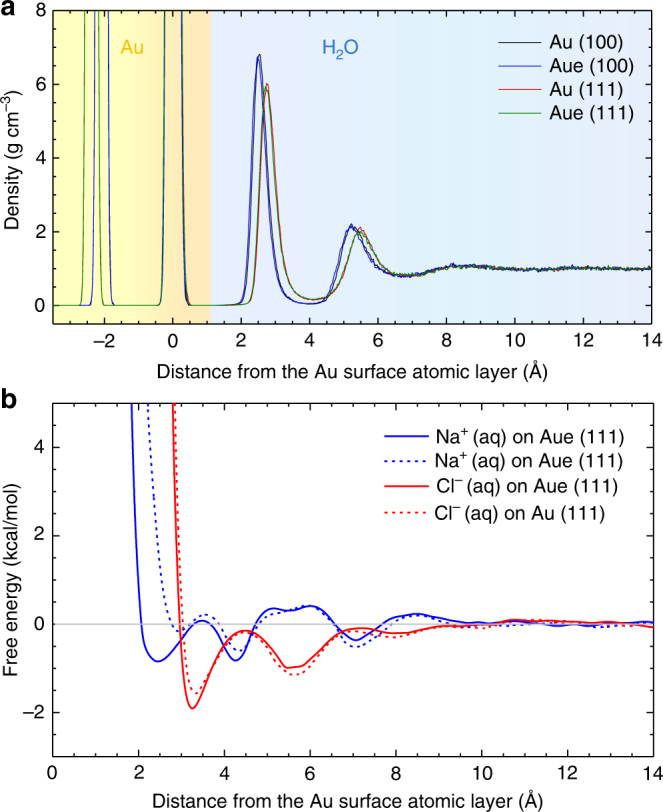
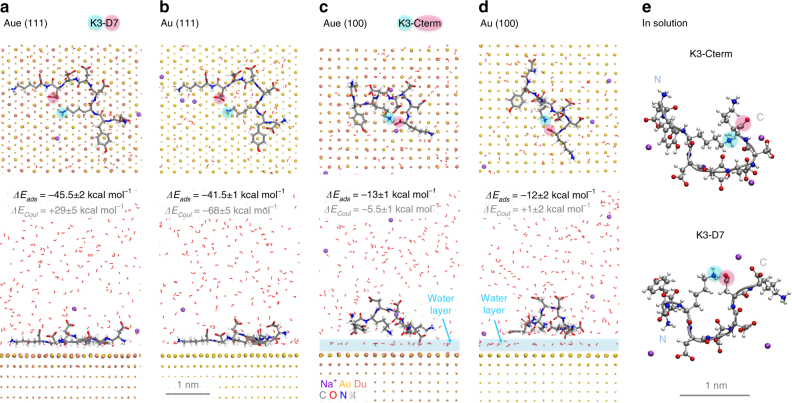
Metallic nanostructures have become popular for applications in therapeutics, catalysts, imaging, and gene delivery. Molecular dynamics simulations are gaining influence to predict nanostructure assembly and performance; however, instantaneous polarization effects due to induced charges in the free electron gas are not routinely included. Here we present a simple, compatible, and accurate polarizable potential for gold that consists of a Lennard-Jones potential and a harmonically coupled core-shell charge pair for every metal atom. The model reproduces the classical image potential of adsorbed ions as well as surface, bulk, and aqueous interfacial properties in excellent agreement with experiment. Induced charges affect the adsorption of ions onto gold surfaces in the gas phase at a strength similar to chemical bonds while ions and charged peptides in solution are influenced at a strength similar to intermolecular bonds. The proposed model can be applied to complex gold interfaces, electrode processes, and extended to other metals.


Conflict of interest statement

The authors declare no competing financial interests.

Figures

Fig. 1
Fig. 1
Polarizable Lennard–Jones model for gold. a Extension of the simple Lennard–Jones model with dummy electrons to add features of the free electron gas. The virtual electrons rest at the atom core and carry a mass of 1 au. b Visualization of the dummy electrons on the Au (111) surface in the presence of an adsorbed sodium ion in vacuum. The induced charges spread across several atomic layers laterally and beneath the top atomic layer. c The energy expression contains terms for harmonic bond stretching, Coulomb energy, and van-der-Waals energy (Lennard–Jones potential). d The model uses five independent parameters (highlighted in bold) including the mass of the dummy electron me, a combination of the charge q and the bond stretching constant kr, whereby a certain ratio α = q2/(2kr) determines the magnitude of the image potential, as well as the Lennard–Jones parameters σ, εcore, and εe. The total mass of the gold atom (mcore + me) and the rest position of the dummy electron r0 = 0 Å are constants
Fig. 2
Fig. 2
Interaction of a positive charge (sodium ion) and a negative charge (chloride ion) with the metal surface in vacuum. a The electrostatic interaction energy as a function of distance from the surface using energy minimization. The polarizable model closely approximates the classical image potential and shows a large improvement over the non-polarizable Lennard–Jones potential. The curve remains the same for any cation or anion with a charge of +1.0e or −1.0e regardless of chemical identity. b The total energy of interaction of a sodium ion and a chloride ion with the Au (111) surface as a function of distance in molecular dynamics simulation at 298 K. Stable minima are seen near 1.86 Å and 2.81 Å distance from the surface atoms, respectively. The presence of Coulomb and Lennard–Jones interactions in the polarizable model imposes a barrier to dissolution in the metal of >50 kcal mol−1. The non-polarizable model does not reproduce the strong attraction. Computations involved 3D periodic simulation boxes and common Ewald summation of Coulomb interactions. A box size of at least 10 × 10 × 100 nm3 is recommended to reduce errors in the computed image charge potential due to long-range interactions to <1%
Fig. 3
Fig. 3
Equilibrium position and total interaction energy of sodium and chloride ions on gold (111) surfaces in DFT calculations and with the polarizable force field. a, b Na+ ions are preferably located above epitaxial (hollow) sites in DFT calculations and in calculations with the polarizable FF. The contour of the electron density difference upon binding shows induced negative charge (blue) atop the surface atoms, similar to positions of dummy atoms (Fig. 1b) (contour level 0.02e Å−3). c, d Cl ions preferably bind to epitaxial (hollow) sites, too, in DFT calculations and with the polarizable FF. The contour of the electron density difference upon binding shows induced positive charge (dark red) atop the surface atoms (contour level 0.02e Å−3) and some negative charge in the plane of surface atoms. e, f Total interaction energies of Na+ and Cl ions. Similar curves are seen for sodium ions (e) in DFT calculations and with the polarizable FF. Differences are noted for chloride (f). The larger chloride ion approaches the Au surface very closely in DFT, possibly due to chemisorption, which is neglected with the force field. DFT does not reproduce long-range features (>5 Å distance) of the image potential that decay as 1/r with distance r. Therefore, the vertical position of the DFT curve remains uncertain. Small identical simulation boxes of 1.44 × 1.50 × 10.0 nm3 and a series of energy minimizations were employed to obtain both types of data
Fig. 4
Fig. 4
Origin of major differences in the magnitude of the image potential for isolated ions in the gas phase vs. charge-neutral molecules on gold surfaces. a An isolated ion with a net charge of +1.0e in the gas phase induces significant charges in the metal surface that spread across several atomic layers vertically and several nanometers laterally. b In contrast, neutral water molecules in the condensed phase contain dipoles with opposite charges in close proximity, unable to induce a long-range pattern of image charges. Electrostatic interactions are screened and the image potential is more than order of magnitude smaller. The reduction in image potential in (b) also applies for metal-oxide and metal-ceramic interfaces. c Electron density difference at the interface of a water monolayer with an Au (111) surface according to DFT (blue = negative charge, isovalue −0.027e Å−3, red = positive charge, isovalue +0.027e Å−3). Induced charges are small, illustrated by visualization on the right hand side showing some negative induced charge in the vicinity of positively charged hydrogen atoms of water molecules close to the gold surface (blue = negative charge difference, red = positive charge difference)
Fig. 5
Fig. 5
Density profile of water and free energy profiles of dissolved ions on the gold surface. a Computed density profile of water on the Au (111) and Au (100) surfaces with and without polarization. The difference between the polarizable and the nonpolarizable model is barely visible. Two distinct and two further weak surface layers of water are seen on both surfaces. Water molecules approach the top layer of the metal surface atoms 0.25 Å more closely on the (100) surface than on the (111) surface. b Computed free energy profile of sodium and chloride ions on the Au (111) surface in water with and without polarization. Polarization significantly changes preferred distances and adsorption energies of the ions, which is particularly visible for sodium ions at ~2.5 Å distance. Chloride ions exhibit different preferred distances compared to sodium ions and are more strongly attracted, enhanced at ~3.3 Å distance due to polarization. Adsorption energies are on the order of van-der-Waals contacts and weak hydrogen bonds. The zero point of the z coordinate corresponds to the position of the top layer of gold surface atoms in (a) and (b)
Fig. 6
Fig. 6
Representative conformations and adsorption energies of an ionic peptide on gold surfaces. The interaction of the peptide DYKDDDDK (FLAG-Tag) with gold (111) and (100) surfaces was analyzed in aqueous solution at 298 K and pH 7 (FLAG-Na3) using the polarizable model (Aue) and the nonpolarizable model (Au).  a, b. On the (111) surface, the peptide assumes a flat-on conformation in direct contact with the surface using both models. The preferred peptide conformation is very similar and involves a K3-D7 salt bridge (highlighted). Adsorption is driven by soft epitaxy, i.e., proximity of polarizable atoms (C, O, N) to hollow sites in the 2nd and 3rd subsurface layer, and avoidance of atoms in the top layer. Overall adsorption is somewhat stronger using the polarizable model and the contribution of Coulomb energy to adsorption is of opposite sign (see text). c, d On the (100) surface, the peptide maintains a distance of one water layer from the Au surface atoms (see highlight) and retains conformational flexibility similar to that in solution. The preferred adsorbed conformation involves an ion pair between K3 and the C terminus. Adsorption energies are about the same for polarizable and non-polarizable models and much weaker in comparison to the (111) surface. Coulomb contributions to the adsorption energy differ significantly between the two models. e Preferred conformations of the FLAG-tag peptide in solution. The K3-Cterm salt bridge corresponds to lowest energy, while also K3-D7 bridges, Nterm-D7, D4-K8, Nterm-D6, Nterm-D5, and D6-K8 bridges were temporarily observed. Water molecules are partially shown in panels (ad). The three sodium ions per peptide often move several nanometers away from the peptide and are shown only partly in panels (a) and (b)

References

    1. Yao J, Yang M, Duan Y. Chemistry, biology, and medicine of fluorescent nanomaterials and related systems: new insights into biosensing, bioimaging, genomics, diagnostics, and therapy. Chem. Rev. 2014;114:6130–6178. doi: 10.1021/cr200359p. - DOI - PubMed
    1. Dreaden EC, Alkilany AM, Huang XH, Murphy CJ, El-Sayed MA. The golden age: gold nanoparticles for biomedicine. Chem. Soc. Rev. 2012;41:2740–2779. doi: 10.1039/C1CS15237H. - DOI - PMC - PubMed
    1. Xia Y, Xiong Y, Lim B, Skrabalak SE. Shape-controlled synthesis of metal nanocrystals: simple chemistry meets complex physics? Angew. Chem. Int. Ed. 2009;48:60–103. doi: 10.1002/anie.200802248. - DOI - PMC - PubMed
    1. Chiu CY, et al. Platinum nanocrystals selectively shaped using facet-specific peptide sequences. Nat. Chem. 2011;3:393–399. doi: 10.1038/nchem.1025. - DOI - PubMed
    1. Ruan LY, et al. A rational biomimetic approach to structure defect generation in colloidal nanocrystals. ACS Nano. 2014;8:6934–6944. doi: 10.1021/nn501704k. - DOI - PubMed

Publication types

LinkOut - more resources