. 2018 Feb 19;8(1):3219.
doi: 10.1038/s41598-018-21528-1.

Imaging of electrical activity in small diameter fibers of the murine peripheral nerve with virally-delivered GCaMP6f

Affiliations

Imaging of electrical activity in small diameter fibers of the murine peripheral nerve with virally-delivered GCaMP6f

Hans E Anderson et al. Sci Rep. .

Abstract

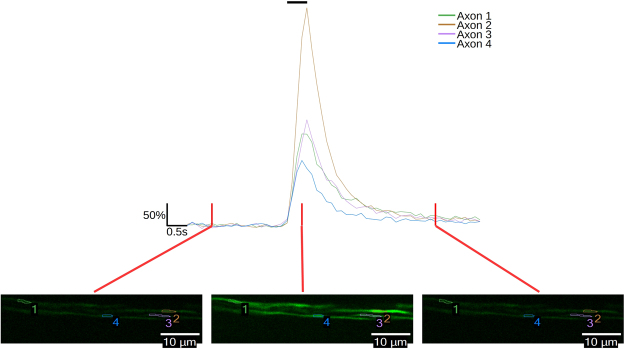
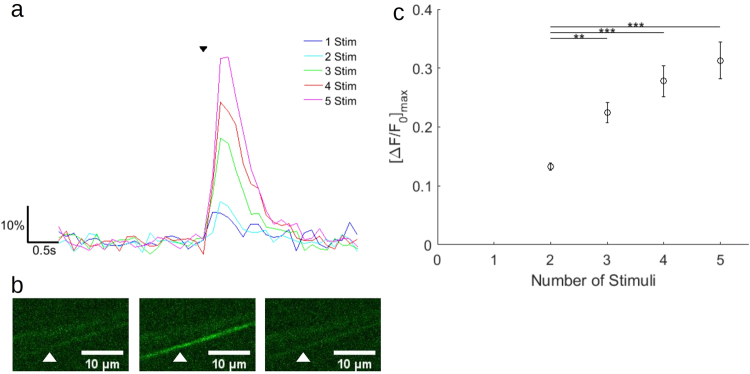
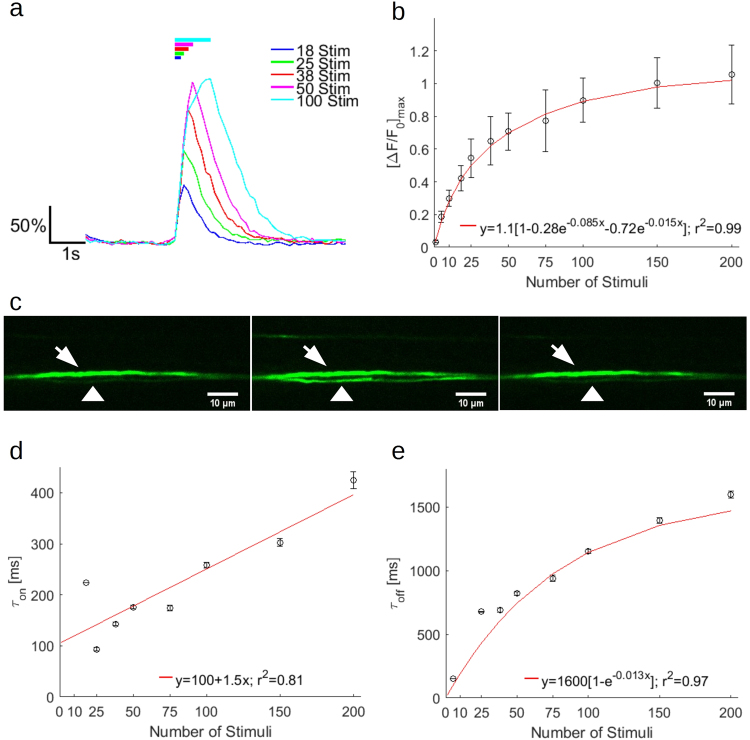
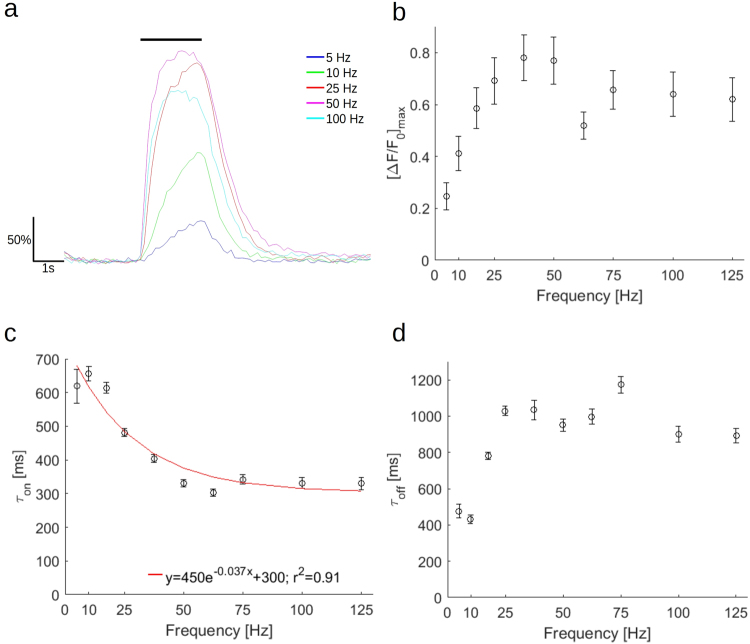
Current neural interfaces are hampered by lack of specificity and selectivity for neural interrogation. A method that might improve these interfaces is an optical peripheral nerve interface which communicates with individual axons via optogenetic reporters. To determine the feasibility of such an interface, we delivered the genetically encoded calcium indicator GCaMP6f to the mouse peripheral nerve by intramuscular injection of adenoassociated viral vector (AAV1) under the control of the CAG (chicken beta actin- cytomegalovirus hybrid promoter). Small diameter axons in the common peroneal nerve were transduced and demonstrated electrically inducible calcium transients ex vivo. Responses to single electrical stimuli were resolvable, and increasing the number of stimuli resulted in a monotonic increase in maximum fluorescence and a prolongation of calcium transient kinetics. This work demonstrates the viability of using a virally-delivered, genetically-encoded calcium indicator to read-out from peripheral nerve axons.


Conflict of interest statement

The authors declare no competing interests.

Figures

Figure 1
Figure 1
GCaMP6f reports neural activity in small diameter axons of the mouse common peroneal nerve. Traces of GCaMP6f fluorescence following a 50 Hz, 500 ms electrical stimuli train for four regions of interest from four axons identified in false color fluorescence images at the bottom, showing fluorescence before the stimulus train (left), immediately at the end of the stimulus train (center), and 3.75 seconds after the stimulus train (right). Time points corresponding to each image are indicated with a vertical red line. A black bar at the top of the traces indicates the time of stimulus. Fluorescence change is reported as percent ΔF/F0.
Figure 2
Figure 2
GCaMP6f detects small numbers of electrical stimuli in small diameter axons of the mouse common peroneal nerve. (a) Representative fluorescence traces from averages of six trials from two axons. Stimulus at 100 Hz for 1–5 stimuli indicated by small black arrowhead. Fluorescence is reported as percent ΔF/F0. 1–2 stimuli were from one axon, 3–5 were from another. (b) Images from a single trial of 5 stimuli. Left, before stimulus. Center, at end of stimulus train. Right, 2.5 s after stimulus train. White arrowhead indicates axon responding to 5 stimuli displayed in (a). (c) The mean peak response of axons to small numbers of stimuli (n = 7 axons from 5 mice). Error bars represent mean ± S.E.M. (Kruskal-Wallis nonparametric analysis of variance, p = 7.88e-07). Bars indicate significant results from Tukey-Kramer multiple comparison. **P < 0.01, ***P < 0.001. (P-values presented in Supplementary Table S2).
Figure 3
Figure 3
Increasing the number of stimuli at constant frequency increases maximum fluorescence change, and slows kinetics of GCaMP6f in small diameter axons. (a) Representative fluorescence traces from averages of six trials from a single axon, for varying numbers of stimuli at a constant frequency of 100 Hz. Fluorescence is reported as percent ΔF/F0. Durations of the stimulus train are indicated as solid, color coded bars at the top of the image. (b) Mean peak fluorescence of following 1–200 stimulus trains. A double exponential fit is indicated with a red line. (Kruskal-Wallis nonparametric analysis of variance, p = 3.71e-21). (c) Images from a single trial of 100 stimuli. Left, before stimulus. Center, at end of stimulus train. Right, 3.75 s after stimulus train. White arrowhead indicates axon in (a). White arrow indicates axon unresponsive to stimulus. (d) Rise time constant in ms computed from single exponential fits of averages from each axonal response to 1–200 stimuli. A linear fit is indicated with a red line. (Kruskal-Wallis nonparametric analysis of variance, p = 1.13e-12). (e) Off time constant in ms computed from single exponential fits of averages from each axonal response to 1–200 stimuli. (Kruskal-Wallis nonparametric analysis of variance, p = 2.69e-11). (b,d,e) Error bars represent mean ± S.E.M. (n = 22 axons from 4 mice). (P-values presented in Supplementary Table S3).
Figure 4
Figure 4
Increasing the frequency of a constant duration stimulus has a nonlinear effect on peak fluorescence change and kinetics of GCaMP6f in small diameter axons. (a) Representative traces from averages of six trials from a single axon for varying frequencies of electrical stimulus trains with a train duration of 2 s. A black bar at the top of the image indicates stimulus train duration. Fluorescence is reported as percent ΔF/F0. (b) Mean peak fluorescence following stimulation with 5–125 Hz. (Kruskal-Wallis nonparametric analysis of variance, p = 0.1246). (c) Rise time constant in ms computed from single exponential fits of averages from each axonal response to 5–125 Hz. A single exponential fit is indicated with a red line. (Kruskal-Wallis nonparametric analysis of variance, p = 1.13e-05). (d) Off time constant in ms computed from single exponential fits of averages from each axonal response to 5–125 Hz. (Kruskal-Wallis nonparametric analysis of variance, p = 4.89e-06). (b,c,d) Error bars represent mean ± S.E.M. (n = 14 axons from 3 mice). (P-values presented in Supplementary Table S5).

References

    1. Loeb GE, Davoodi R. The functional reanimation of paralyzed limbs. IEEE Eng. Med. Biol. Mag. 2005;24:45–51. doi: 10.1109/MEMB.2005.1511499. - DOI - PubMed
    1. Lobel, D. A. & Lee, K. H. Brain machine interface and limb reanimation technologies: restoring function after spinal cord injury through development of a bypass system. in Mayo Clinic Proceedings89, 708–714 (Elsevier, 2014). - PubMed
    1. Grill WM, Norman SE, Bellamkonda RV. Implanted Neural Interfaces: Biochallenges and Engineered Solutions. Annu. Rev. Biomed. Eng. 2009;11:1–24. doi: 10.1146/annurev-bioeng-061008-124927. - DOI - PubMed
    1. Navarro X, et al. A critical review of interfaces with the peripheral nervous system for the control of neuroprostheses and hybrid bionic systems. J. Peripher. Nerv. Syst. 2005;10:229–258. doi: 10.1111/j.1085-9489.2005.10303.x. - DOI - PubMed
    1. Towne C, Montgomery KL, Iyer SM, Deisseroth K, Delp SL. Optogenetic Control of Targeted Peripheral Axons in Freely Moving Animals. PLoS ONE. 2013;8:e72691. doi: 10.1371/journal.pone.0072691. - DOI - PMC - PubMed

Publication types

LinkOut - more resources