. 2018 Feb 19;9(3):286.
doi: 10.1038/s41419-018-0312-8.

The mycotoxin phomoxanthone A disturbs the form and function of the inner mitochondrial membrane

Affiliations

The mycotoxin phomoxanthone A disturbs the form and function of the inner mitochondrial membrane

Philip Böhler et al. Cell Death Dis. .

Abstract

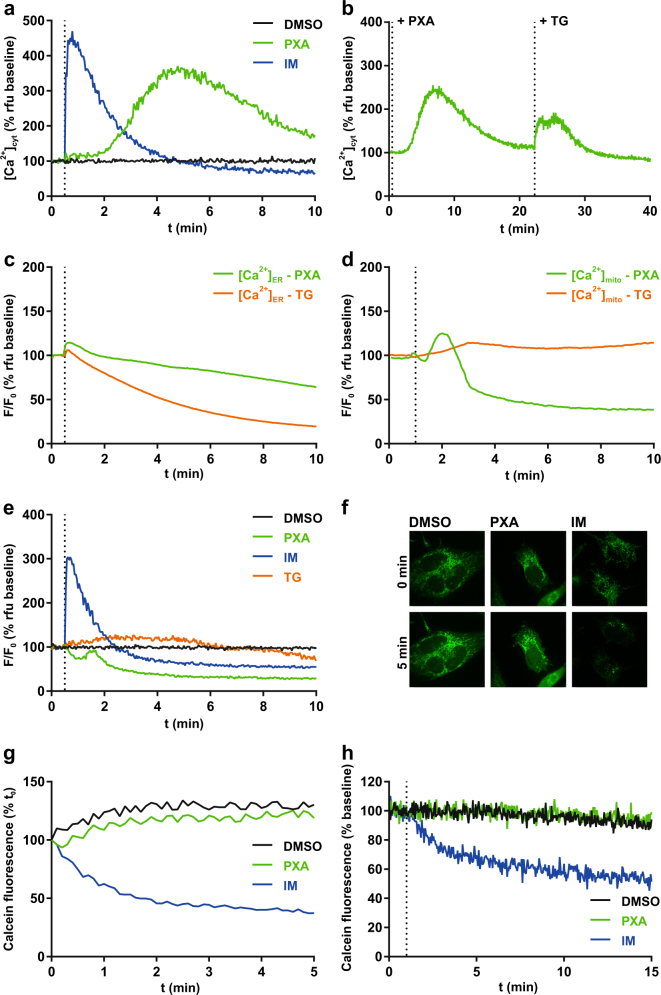
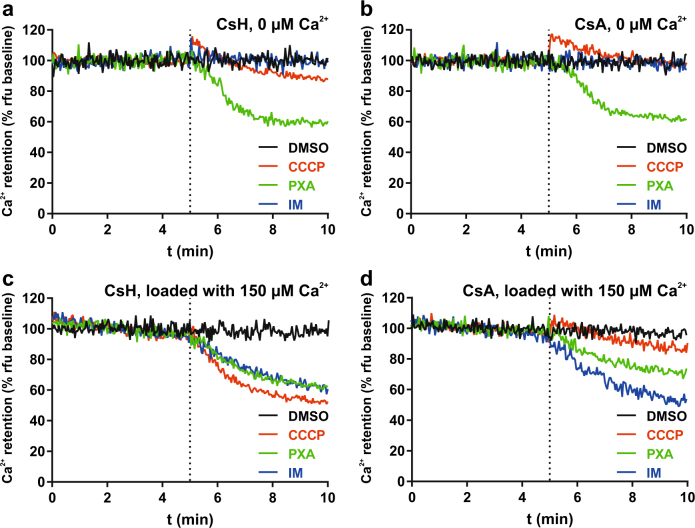
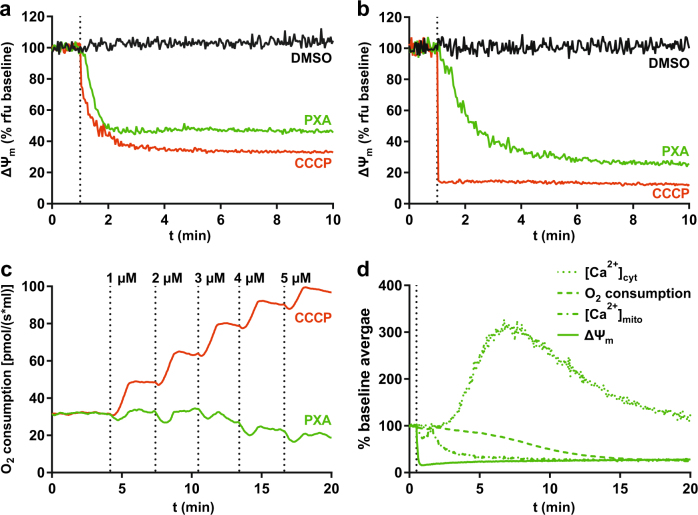
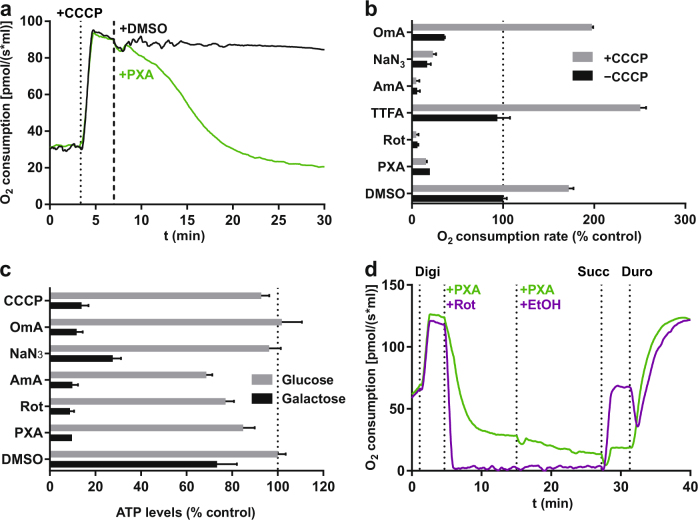
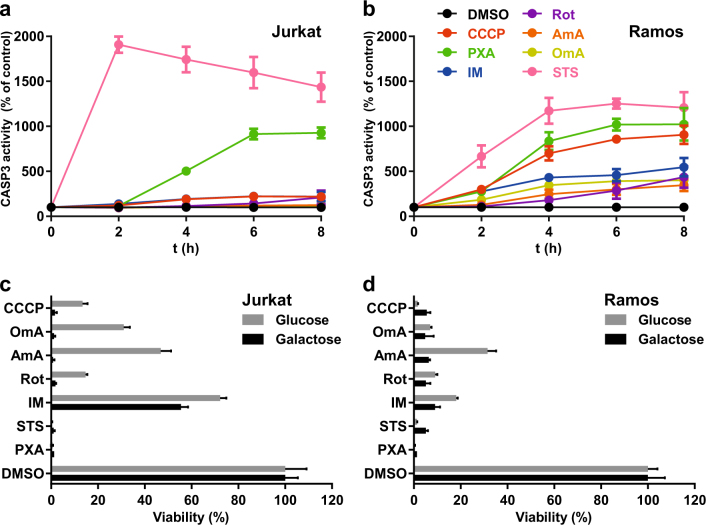
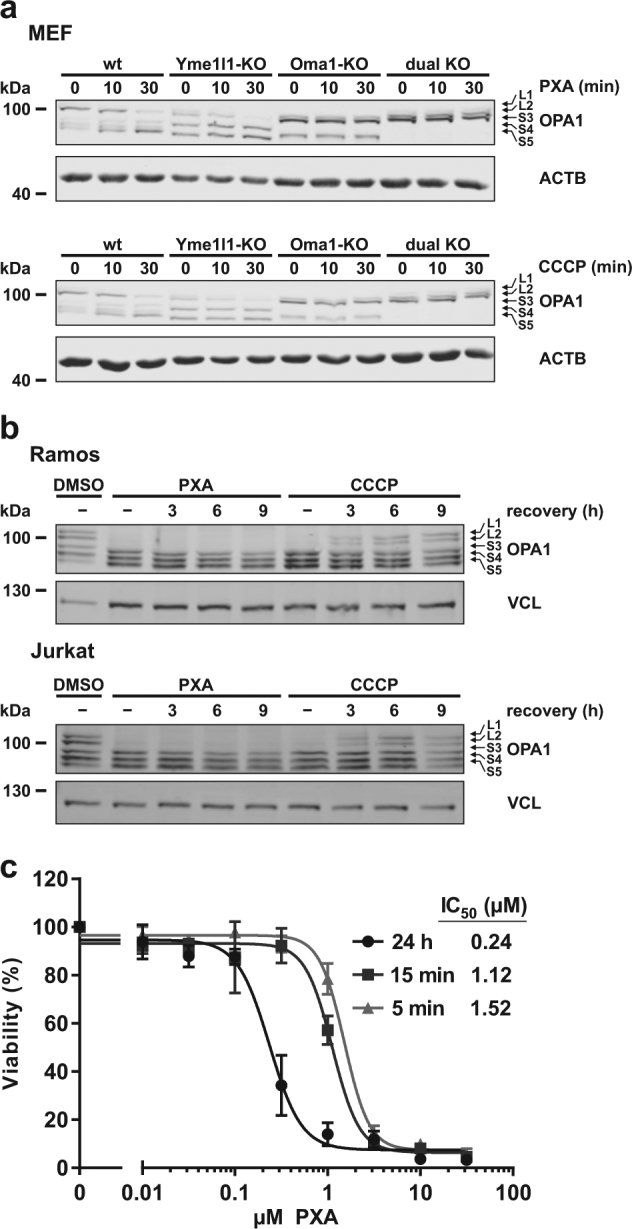
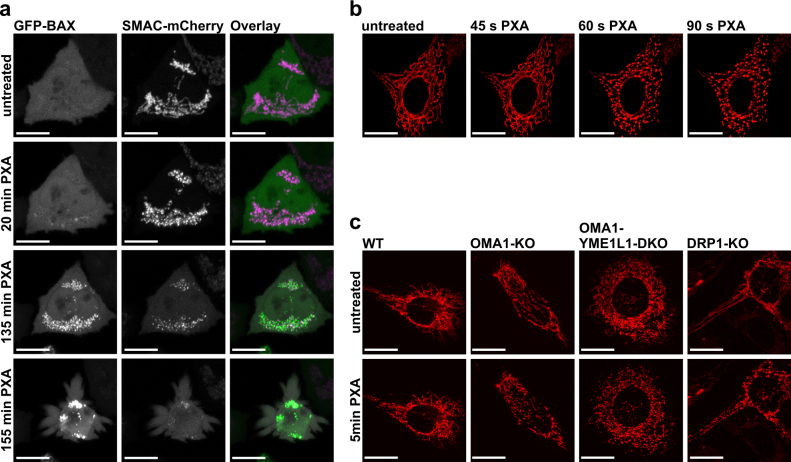
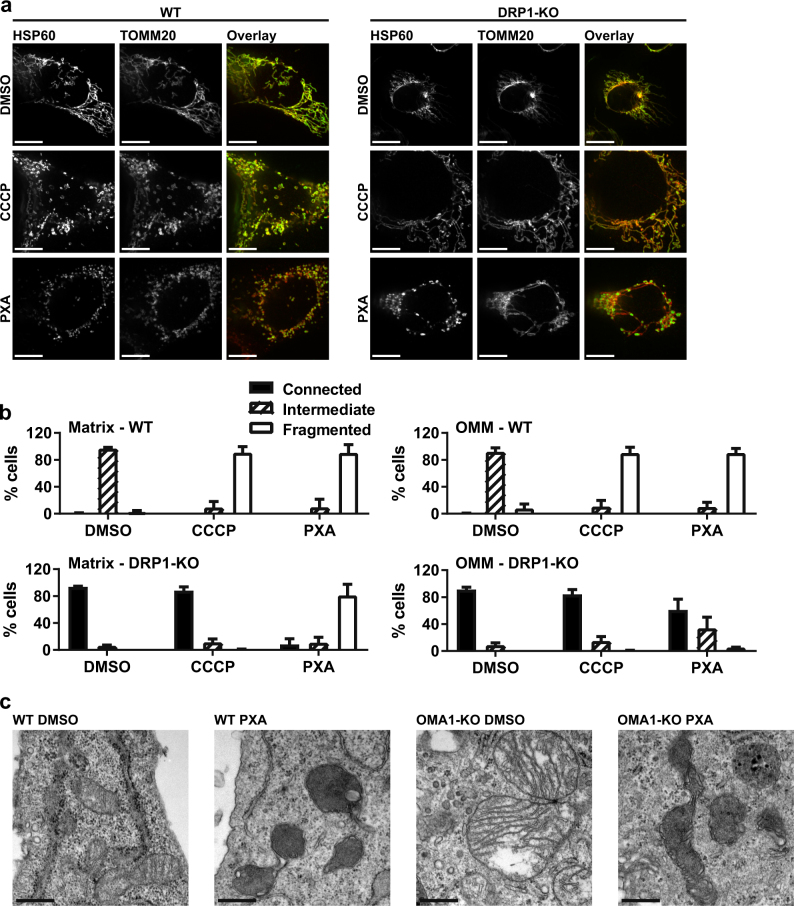
Mitochondria are cellular organelles with crucial functions in the generation and distribution of ATP, the buffering of cytosolic Ca2+ and the initiation of apoptosis. Compounds that interfere with these functions are termed mitochondrial toxins, many of which are derived from microbes, such as antimycin A, oligomycin A, and ionomycin. Here, we identify the mycotoxin phomoxanthone A (PXA), derived from the endophytic fungus Phomopsis longicolla, as a mitochondrial toxin. We show that PXA elicits a strong release of Ca2+ from the mitochondria but not from the ER. In addition, PXA depolarises the mitochondria similarly to protonophoric uncouplers such as CCCP, yet unlike these, it does not increase but rather inhibits cellular respiration and electron transport chain activity. The respiration-dependent mitochondrial network structure rapidly collapses into fragments upon PXA treatment. Surprisingly, this fragmentation is independent from the canonical mitochondrial fission and fusion mediators DRP1 and OPA1, and exclusively affects the inner mitochondrial membrane, leading to cristae disruption, release of pro-apoptotic proteins, and apoptosis. Taken together, our results suggest that PXA is a mitochondrial toxin with a novel mode of action that might prove a useful tool for the study of mitochondrial ion homoeostasis and membrane dynamics.


Conflict of interest statement

The authors declare that they have no conflict of interest.

Figures

Fig. 1
Fig. 1. PXA causes an increase of [Ca2+]cyt and a release of [Ca2+]mito but not [Ca2+]ER.
a Live measurement of the effect of PXA (10 µM) on [Ca2+]cyt in Ramos cells, where DMSO (0.1% v/v) was used as vehicle control and ionomycin (IM; 2 µM) was used as positive control, and b live measurement of [Ca2+]cyt after PXA followed by thapsigargin (TG; 10 µM). Measurements were performed by flow cytometry using the Ca2+-sensitive fluorescent probe Fluo-4-AM (Ex 488 nm, Em 530 ± 30 nm) in the absence of extracellular Ca2+ by maintaining the cells in Krebs-Ringer buffer containing 0.5 mM EGTA during measurement. c, d Comparison of the effect of PXA (10 µM) and thapsigargin (TG; 1 µM) on either [Ca2+]ER or [Ca2+]mito as measured by the Ca2+-sensitive fluorescent protein CEPIA targeted to the respective organelle in HeLa cells. All traces were normalised (F/F0) where F0 is the starting fluorescence of each trace. e Comparison of the effect of PXA (10 µM), ionomycin (IM; 2 µM), and thapsigargin (TG; 1 µM) on [Ca2+]mito in Ramos cells stably transfected with the Ca2+-sensitive ratiometric fluorescent protein mito-Pericam. DMSO (0.1% v/v) was used as vehicle control. F/F0 is the ratio of fluorescence with excitation at 488 nm (high [Ca2+]) to 405 nm (low Ca2+]). f, g Live imaging and quantification of the effect of PXA (10 µM) on mPTP opening in HeLa cells as measured by mitochondrial calcein fluorescence using the calcein/cobalt quenching method. DMSO (0.1% v/v) was used as vehicle control and ionomycin (IM; 2 µM) was used as positive control. Mitochondrial calcein fluorescence was quantified. h Additional live measurement of the effect of PXA on mPTP opening in Ramos cells by the calcein/cobalt quenching method using flow cytometry
Fig. 2
Fig. 2. Live measurement of the effect of PXA on mitochondrial Ca2+ retention capacity.
Isolated mitochondria were stained with calcium green AM and maintained in the presence of either (a, c) CsH or (b, d) CsA, and fluorescence was measured either (a, b) directly after staining or (c, d) after first loading the mitochondria with 150 µM Ca2+
Fig. 3
Fig. 3. PXA dissipates the mitochondrial membrane potential (ΔΨm) but does not increase cellular respiration.
a Live measurement of the effect of PXA (10 µM) on ΔΨm in Ramos cells. Measurements were performed by flow cytometry using the ΔΨm-sensitive fluorescent probe TMRE (Ex 488 nm, Em 575 ± 26 nm). A decrease in TMRE fluorescence corresponds to a decrease in ΔΨm. The protonophore carbonyl cyanide m-chlorophenyl hydrazone (CCCP; 10 µM) was used as positive control for mitochondrial depolarisation. b Live measurement of the effect of PXA (10 µM) ΔΨm in isolated mitochondria. Measurements were performed by flow cytometry using the ΔΨm-sensitive fluorescent probe TMRM (Ex 488 nm, Em 575 ± 26 nm). The mitochondria were maintained in the presence of 1.6 µM CsH to prevent passive TMRM leakage. c Titration of PXA to determine the effect on cellular respiration in Ramos cells as measured by oxygen consumption. CCCP was used as positive control for increase of respiration. Measurement of extracellular [O2] was performed using an oxygraph. d Comparison of the kinetics of the effects of PXA on [Ca2+]cyt (as measured by Fluo-4-AM fluorescence), [Ca2+]mito (as measured by mito-Pericam fluorescence), O2 consumption (as measured by changes in extracellular [O2]) and ΔΨm (as measured by TMRE fluorescence). Graphs were partially adapted from other figures
Fig. 4
Fig. 4. Effect of PXA on electron transport chain and OXPHOS.
a Live measurement of the effect of PXA on uncoupled cellular respiration in intact Ramos cells. Cells were first treated with 1 µM CCCP to uncouple respiration and then with either 10 µM PXA or 0.1% v/v DMSO (vehicle control) to test for inhibition. Measurement of extracellular [O2] was performed using an oxygraph. b Comparative measurements of the effect of PXA and other compounds on basal and uncoupled respiration in Ramos cells. Respiration was uncoupled by CCCP (1 µM). PXA (10 µM) was compared to the complex-specific ETC inhibitors rotenone (Rot; complex I; 10 µM), thenoyltrifluoroacetone (TTFA; complex II; 10 µM), antimycin A (AmA; complex III; 10 µM), azide (NaN3; complex IV; 1 mM) and oligomycin A (OmA; complex V; 10 µM). Measurement was performed in a microplate reader using the fluorescence-based MITO-ID® Extracellular O2 Sensor Kit (High Sensitivity) (Enzo). c Comparative measurements of the effect of PXA and other compounds on ATP levels in Ramos cells after 120 min of treatment. PXA (10 µM) was compared to complex-specific ETC inhibitors (see above) as well as CCCP (1 µM). Measurement was performed in a microplate reader using the luminescence-based Mitochondrial ToxGlo™ Assay (Promega). Cells were incubated in full growth medium containing either glucose or galactose as the only available sugar. Galactose alone forces the cells to resort exclusively to OXPHOS for ATP synthesis. d Live measurement of mitochondrial respiration in Ramos cells permeabilized by digitonin (Digi; 5 µg/ml). The effect of PXA (first 1 µM, then increased to 10 µM as indicated) was compared to that of the known complex I inhibitor rotenone (Rot; 1 µM). To specifically induce complex II and III of the electron transport chain, succinate (Succ; 10 mM) and duroquinol (Duro; 1 mM) were used, respectively. Measurement of extracellular [O2] was performed using an oxygraph
Fig. 5
Fig. 5. Comparative measurements of the effect of PXA and other compounds on apoptosis induction and cytotoxicity in Jurkat and Ramos cells.
PXA (10 µM) was compared to the protonophore carbonyl cyanide m-chlorophenyl hydrazone (CCCP; 10 µM), the Ca2+ ionophore ionomycin (IM; 10 µM), the apoptosis inducer staurosporine (STS; 10 µM), and the complex-specific ETC inhibitors rotenone (Rot; complex I; 10 µM), antimycin A (AmA; complex III; 10 µM) and oligomycin A (OmA; complex V; 10 µM). Data shown are the means of three independent experiments; error bars = SD. a, b Measurement of apoptosis induction based on cleavage of the pro-fluorescent CASP3 substrate Ac-DEVD-AMC, which results in release of AMC (Ex 360 nm, Em 450 nm), as an indicator of apoptosis. c, d Measurement of cytotoxicity after 24 h of treatment in the presence of either glucose or galactose as the only available sugar. Galactose alone forces the cells to resort exclusively to OXPHOS for ATP synthesis. Measurement was performed in a microplate reader using the MTT viability assay
Fig. 6
Fig. 6. PXA causes irreversible OMA1-dependent OPA1 processing and primes cells for death.
a Effect of PXA (10  µM) and of the protonophore carbonyl cyanide m-chlorophenyl hydrazone (CCCP; 10  µM) on OPA1 processing in cells deficient for the OPA1 protease OMA1 and/or YME1L1. Proteins were detected by immunoblot. Beta-actin (ACTB) was used as loading control. b Examination of the recovery of long OPA1 forms in Ramos or Jurkat cells after 5 min of treatment with either PXA (10 µM) or CCCP (10 µM) followed by removal of the substance and a recovery period of up to 9 h. Proteins were detected by immunoblot. Vinculin (VCL) was used as loading control. c Comparison of the effect of PXA on cell viability if the stimulus was removed after treatment. Measurement was performed in a microplate reader using the MTT viability assay. Data shown are the means of three independent experiments; error bars = SD
Fig. 7
Fig. 7. Effects of PXA on mitochondrial integrity and morphology.
a Confocal live imaging of a HCT116 cell expressing GFP-BAX (green) and SMAC-mCherry (magenta) after treatment with 10 µM PXA. b Confocal live imaging of a HeLa cell stably expressing the fluorescent dye mito-DsRed, which localises to the mitochondrial matrix, after treatment with 10 µM PXA. c Confocal live imaging of MEF cells (WT, OMA1-KO, OMA1-YME1L1-DKO and DRP1-KO) before and after treatment with 10 µM PXA. The cells are stably expressing the fluorescent dye mito-DsRed, which localises to the mitochondrial matrix. All scale bars are equivalent to 10 µm
Fig. 8
Fig. 8. Effect of PXA on mitochondrial matrix morphology.
a Confocal images of MEF cells (WT and DRP1-KO) at 30 min after treatment with either 0.1% v/v DMSO (vehicle control), 10 µM CCCP (positive control for fragmentation) or 10 µM PXA. HSP60 (green) was stained as a marker for the mitochondrial matrix, and TOMM20 (red) was stained as a marker for the outer mitochondrial membrane (OMM). Scale bars are equivalent to 10 µm. b Quantification of mitochondrial morphology by classification of 200 individual cells in each of three independent experiments; error bars = SD. c Transmission electron microscopy images of MEF cells (WT or OMA1-KO) after treatment with either 10 µM PXA or with 0.1% v/v DMSO (vehicle control) for 30 min. Scale bars are equivalent to 0.5 µm

References

    1. Vyas S, Zaganjor E, Haigis MC. Mitochondria and Cancer. Cell. 2016;166:555–566. doi: 10.1016/j.cell.2016.07.002. - DOI - PMC - PubMed
    1. Rizzuto R, De Stefani D, Raffaello A, Mammucari C. Mitochondria as sensors and regulators of calcium signalling. Nat. Rev. Mol. Cell Biol. 2012;13:566–578. doi: 10.1038/nrm3412. - DOI - PubMed
    1. Nunnari J, Suomalainen A. Mitochondria: in sickness and in health. Cell. 2012;148:1145–1159. doi: 10.1016/j.cell.2012.02.035. - DOI - PMC - PubMed
    1. Mishra P, Chan DC. Metabolic regulation of mitochondrial dynamics. J. Cell Biol. 2016;212:379–387. doi: 10.1083/jcb.201511036. - DOI - PMC - PubMed
    1. Youle RJ, van der Bliek AM. Mitochondrial fission, fusion, and stress. Science. 2012;337:1062–1065. doi: 10.1126/science.1219855. - DOI - PMC - PubMed

Publication types