Review
. 2018 Feb 19;9(1):711.
doi: 10.1038/s41467-018-03109-y.

Formalising recall by genotype as an efficient approach to detailed phenotyping and causal inference

Affiliations
Review

Formalising recall by genotype as an efficient approach to detailed phenotyping and causal inference

Laura J Corbin et al. Nat Commun. .

Abstract

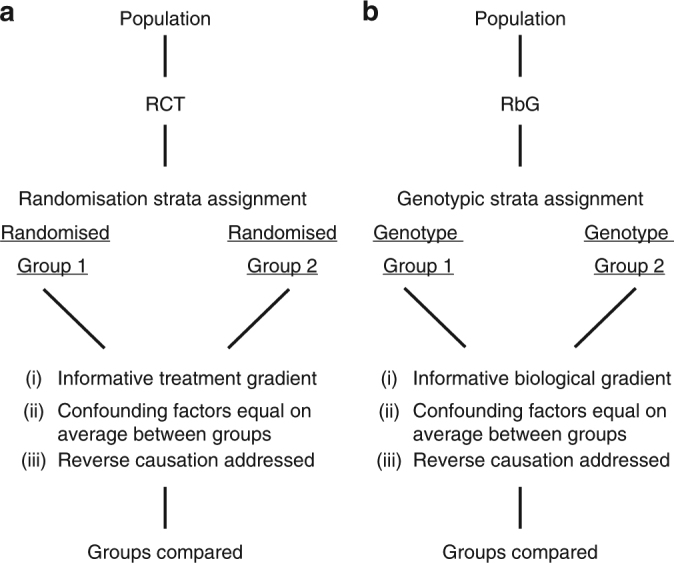
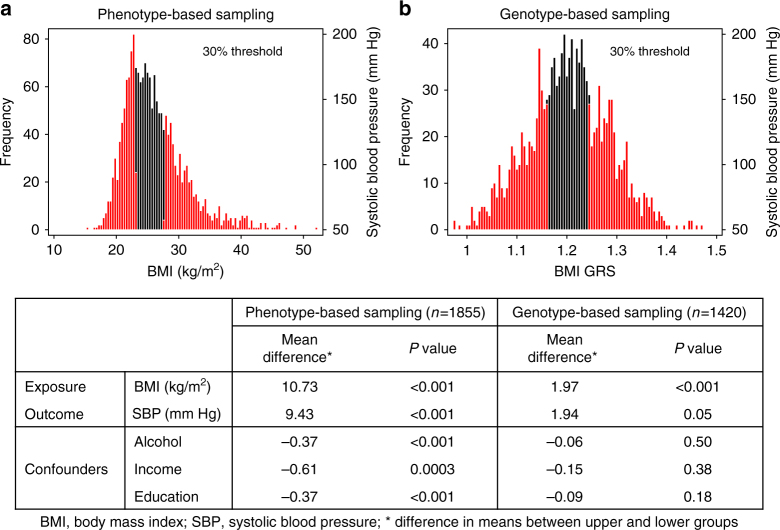
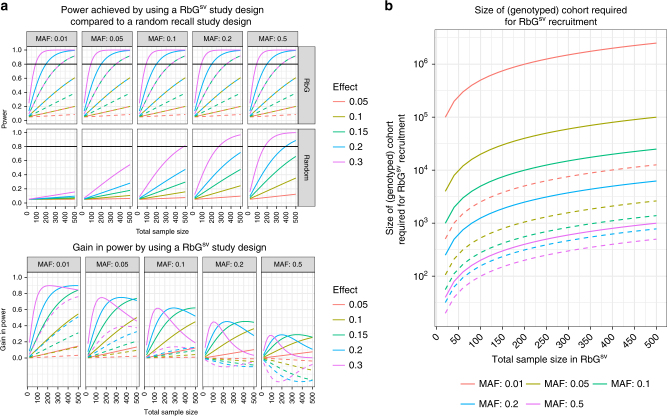
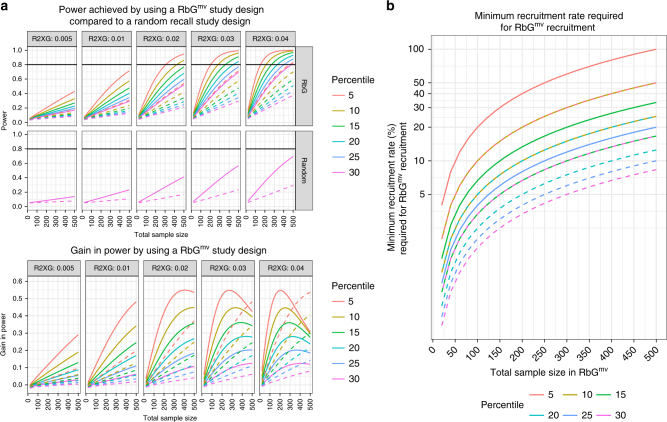
Detailed phenotyping is required to deepen our understanding of the biological mechanisms behind genetic associations. In addition, the impact of potentially modifiable risk factors on disease requires analytical frameworks that allow causal inference. Here, we discuss the characteristics of Recall-by-Genotype (RbG) as a study design aimed at addressing both these needs. We describe two broad scenarios for the application of RbG: studies using single variants and those using multiple variants. We consider the efficacy and practicality of the RbG approach, provide a catalogue of UK-based resources for such studies and present an online RbG study planner.


Conflict of interest statement

TF has consulted for Boehringer Ingelheim and Sanofi and received research funding fromGSK. The remaining authors have no conflicts of interest.

Figures

Fig. 1
Fig. 1
Properties of RbG strata compared to randomised control trials. a For randomised controlled trials (RCTs), participants are randomly allocated to intervention or control groups. Randomisation should equally distribute any confounding variables between the two groups. b For Recall-by-Genotype (RbG) studies, strata are defined by genotype and, analogous to RCTs, potential confounding factors are equally distributed between groups. Hence, RbG studies are not subject to reverse causality or confounding factors with respect to the phenotype under study
Fig. 2
Fig. 2
Contrast between phenotype and genotype-based sampling strategies. Histograms show the distributions of a body mass index (BMI) and b the BMI genetic risk score (GRS) in the Avon Longitudinal Study of Parents and Children (ALSPAC). For a description of the ALSPAC data, please see Supplementary Note 2. Red bars represent the top and bottom 30% of these distributions. Mean differences in BMI, systolic blood pressure (SBP) and confounding factors (alcohol, income and education) were compared between the top and bottom 30% of the a BMI and b BMI GRS distribution. a For extreme-phenotype recall studies, participants at the extreme ends of the phenotypic distribution are invited to participate in the study. As an exemplar of this, phenotype data from 1855 individuals in ALSPAC was used. While differences in BMI and SBP are observed between the top and bottom 30% of the BMI distribution, extreme-phenotype sampling strategies are often prone to confounding and potential reverse causality (as shown by the association of the recalled strata with confounding factors). b In contrast, RbG studies have the ability to generate reliable gradients of biological difference in combination with essentially randomised groups. As an exemplar of this, genetic data from 1420 individuals in ALSPAC was used to generate a BMI GRS. Differences in BMI and SBP are observed between the top and bottom 30% of the BMI GRS distribution that are not prone to confounding and reverse causality (as shown by the lack of association of the recalled strata with confounding factors)
Fig. 3
Fig. 3
Comparative power: RbGsv versus random recall study design. a Top panel: A comparison of power (y-axis) achieved by an RbGsv study design versus a random sample selection design for a given minor allele frequency (MAF) and standardized per-allele effect size. The x-axis is the total sample size of the recall experiment. Solid lines represent the situation where an equal number of major and minor homozygotes are recruited. Dashed lines represent the situation where an equal number of major homozygotes and heterozygotes are recruited. Lower panel: A representation of the difference (y-axis) between the power within an RbGsv study design and that from the equivalent random recall experiment. Solid lines represent the situation where an equal number of major and minor homozygotes are recruited. Dashed lines represent the situation where an equal number of major homozygotes and heterozygotes are recruited. b An illustration of the expected number of participants with genotypic data (y-axis) needed in order to recruit sufficient minor homozygotes or heterozygotes for a given RbGsv study sample size (x-axis) and minor allele frequency (MAF) (assuming HWE and a 100% participation rate). Solid lines represent the situation where an equal number of major and minor homozygotes are recruited. Dashed lines represent the situation where an equal number of major homozygotes and heterozygotes are recruited. For details of how the power calculations were carried out, see Supplementary Note 1. Here we assume a Type I error rate (alpha) of 0.05 and equal-sized genotype groups
Fig. 4
Fig. 4
Comparative power: RbGmv versus random recall study design. a Top panel: A comparison of power (y-axis) achieved by an RbGmv study design versus a random sample selection design for a given RXG2 (variance in exposure explained by the genetic risk score (GRS)) and percentile. The x-axis is the total sample size. Lower panel: A representation of the difference (y-axis) between the power within an RbGmv study design and that from the equivalent random recall experiment. In both the top and bottom panels, solid lines represent the situation where the variance in outcome explained by exposure (RYX2) is equal to 0.3 and dashed lines represent the situation where RYX2 is equal to 0.1. b An illustration of the minimum recruitment rate needed in order to recruit sufficient study participants for a given RbGmv study sample size (x-axis) and percentile. Solid lines represent the situation where the size of the genotyped cohort (or biobank) is equal to 5000 people and dashed lines represent the situation where the size of the genotyped cohort (or biobank) is equal to 10,000 people. For details of how the power calculations were carried out, see Supplementary Note 1. Here we use the analytical method and assume a Type I error rate (alpha) of 0.05 and equal-sized genotype groups. The ‘percentile’ is the threshold used to recruit from the GRS distribution in the genotyped cohort (or biobank) in the RbGmv study (e.g., percentile 5 corresponds to recruitment from the top and bottom 5%)

Similar articles

Cited by

References

    1. McCarthy MI, et al. Genome-wide association studies for complex traits: consensus, uncertainty and challenges. Nat. Rev. Genet. 2008;9:356–369. doi: 10.1038/nrg2344. - DOI - PubMed
    1. Houle D, Govindaraju DR, Omholt S. Phenomics: the next challenge. Nat. Rev. Genet. 2010;11:855–866. doi: 10.1038/nrg2897. - DOI - PubMed
    1. Davey Smith G, Hemani G. Mendelian randomization: genetic anchors for causal inference in epidemiological studies. Hum. Mol. Genet. 2014;23:R89–R98. doi: 10.1093/hmg/ddu328. - DOI - PMC - PubMed
    1. Burgess S, Timpson NJ, Ebrahim S, Davey Smith G. Mendelian randomization: where are we now and where are we going? Int. J. Epidemiol. 2015;44:379–388. doi: 10.1093/ije/dyv108. - DOI - PubMed
    1. Davey Smith G, Ebrahim S. ‘Mendelian randomization’: can genetic epidemiology contribute to understanding environmental determinants of disease? Int. J. Epidemiol. 2003;32:1–22. doi: 10.1093/ije/dyg070. - DOI - PubMed

Publication types

Grants and funding

LinkOut - more resources