. 2018 Mar;20(3):332-343.
doi: 10.1038/s41556-018-0040-4. Epub 2018 Feb 19.

Identification of distinct nanoparticles and subsets of extracellular vesicles by asymmetric flow field-flow fractionation

Affiliations

Identification of distinct nanoparticles and subsets of extracellular vesicles by asymmetric flow field-flow fractionation

Haiying Zhang et al. Nat Cell Biol. 2018 Mar.

Abstract

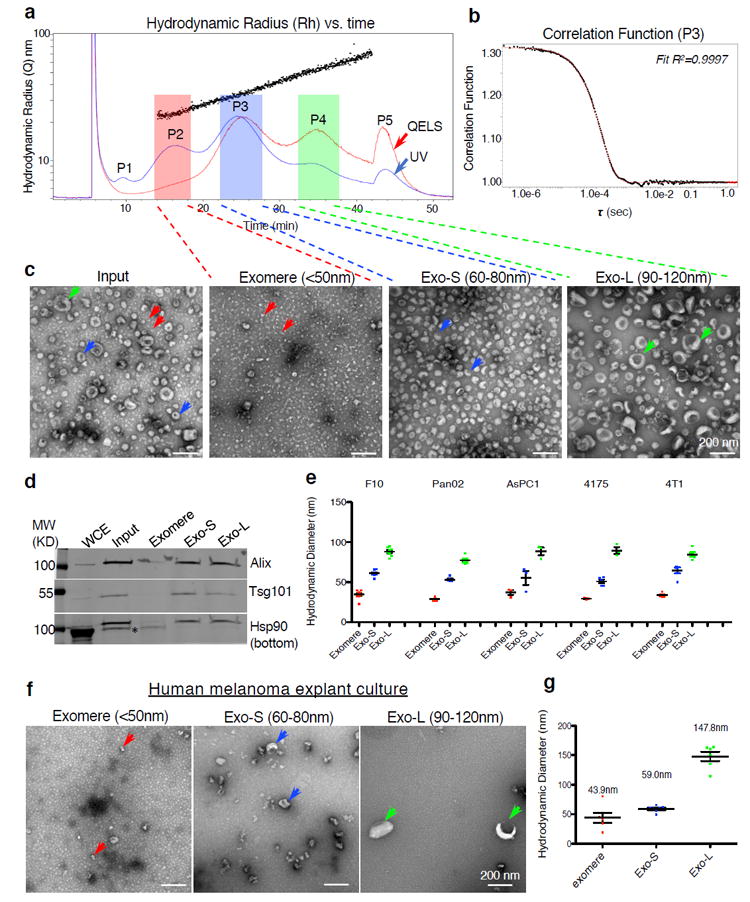
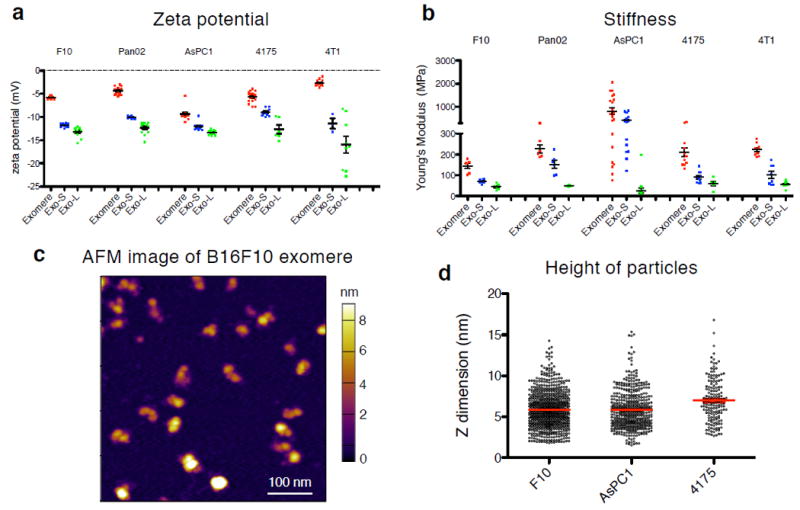
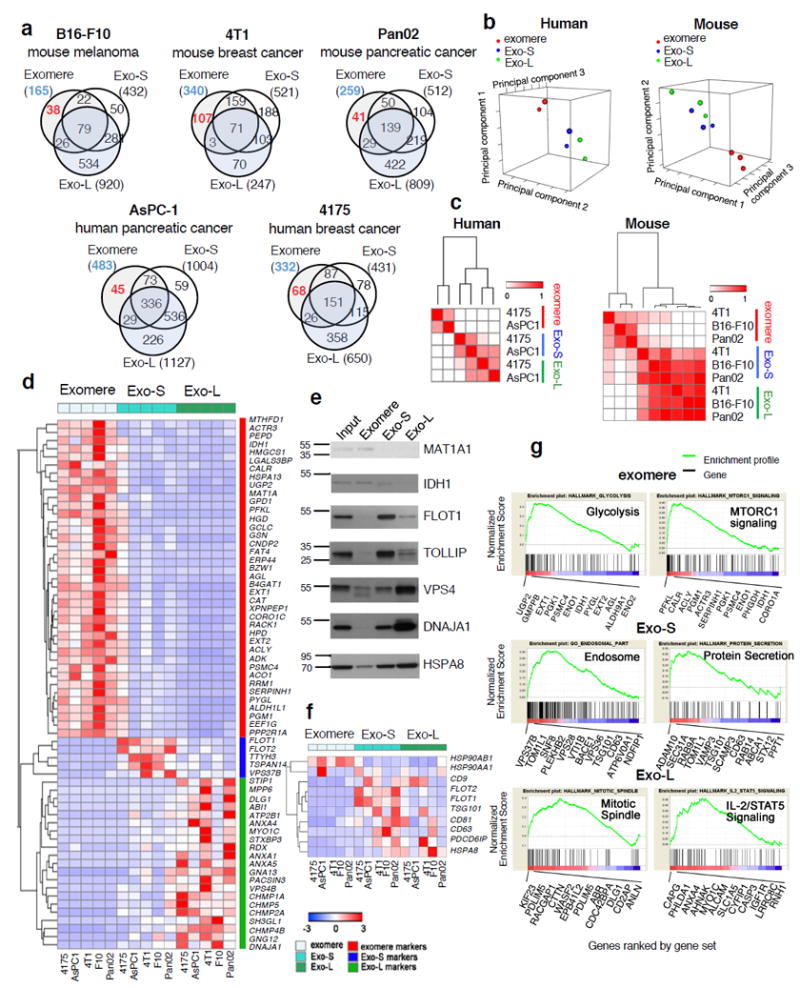
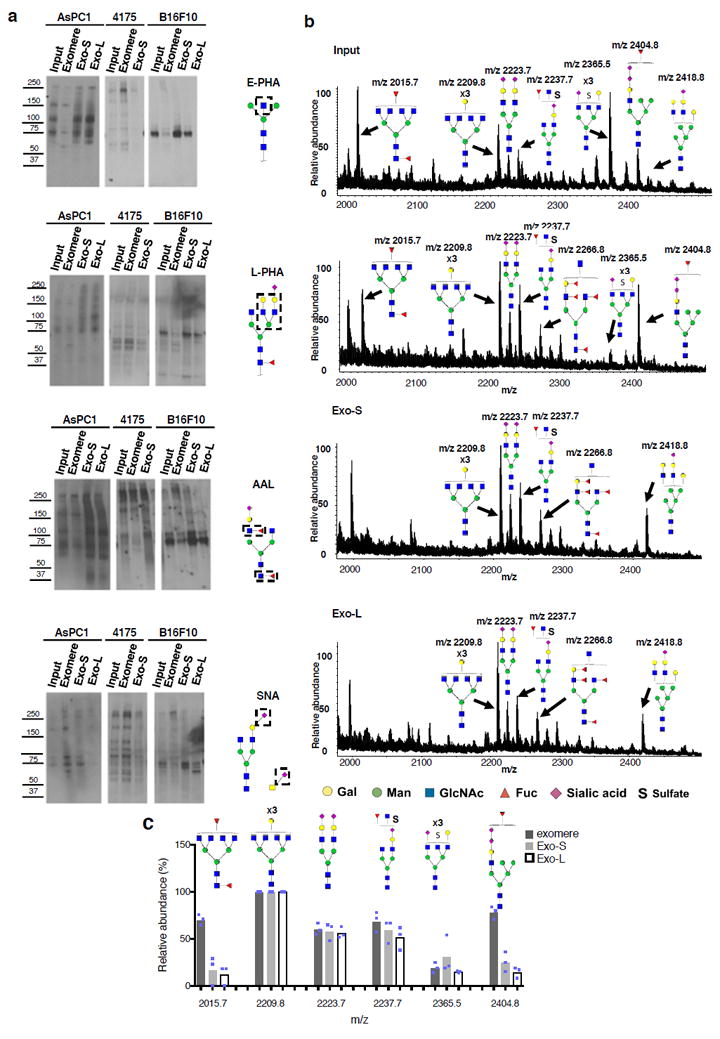
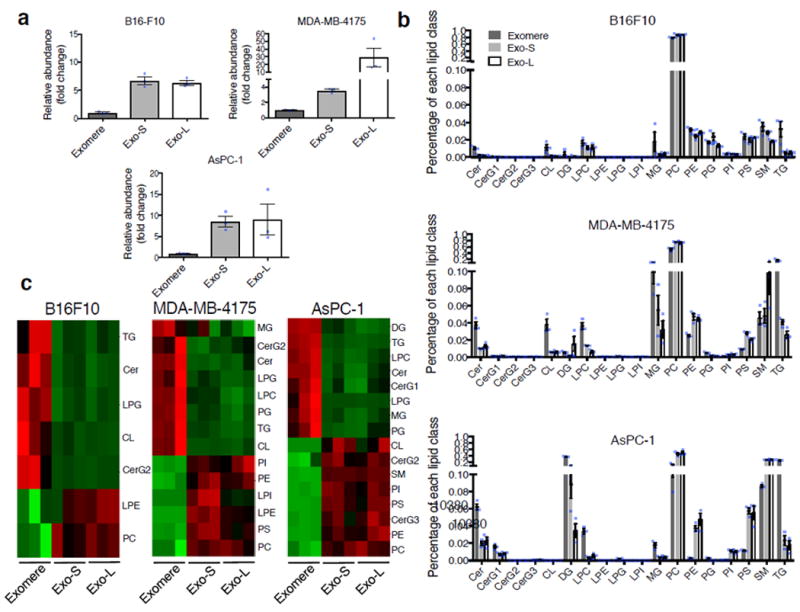
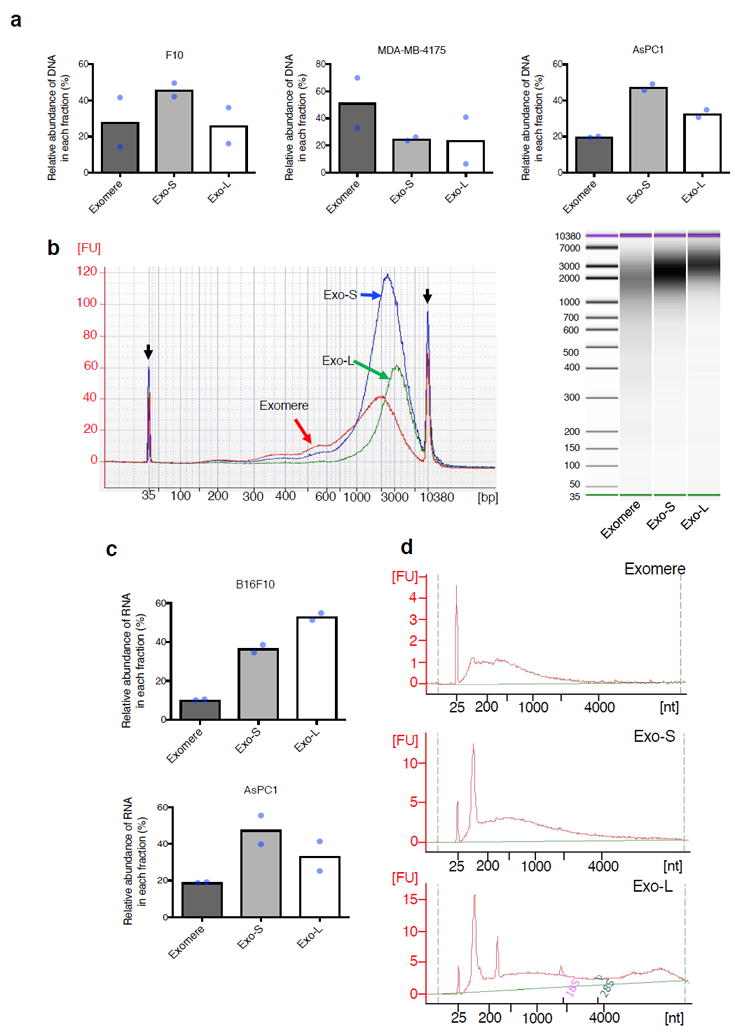
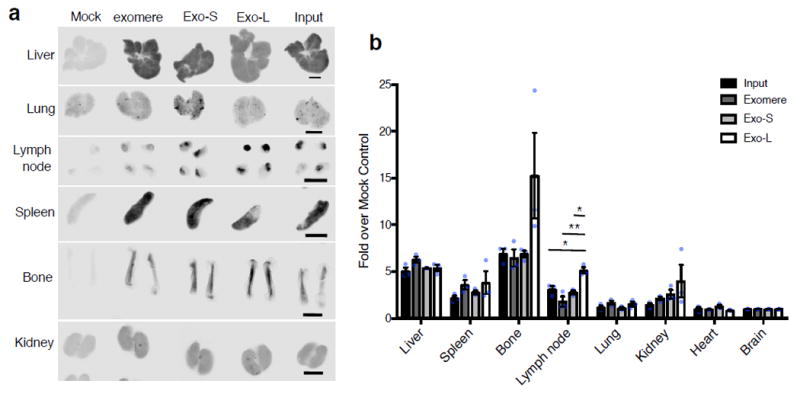
The heterogeneity of exosomal populations has hindered our understanding of their biogenesis, molecular composition, biodistribution and functions. By employing asymmetric flow field-flow fractionation (AF4), we identified two exosome subpopulations (large exosome vesicles, Exo-L, 90-120 nm; small exosome vesicles, Exo-S, 60-80 nm) and discovered an abundant population of non-membranous nanoparticles termed 'exomeres' (~35 nm). Exomere proteomic profiling revealed an enrichment in metabolic enzymes and hypoxia, microtubule and coagulation proteins as well as specific pathways, such as glycolysis and mTOR signalling. Exo-S and Exo-L contained proteins involved in endosomal function and secretion pathways, and mitotic spindle and IL-2/STAT5 signalling pathways, respectively. Exo-S, Exo-L and exomeres each had unique N-glycosylation, protein, lipid, DNA and RNA profiles and biophysical properties. These three nanoparticle subsets demonstrated diverse organ biodistribution patterns, suggesting distinct biological functions. This study demonstrates that AF4 can serve as an improved analytical tool for isolating extracellular vesicles and addressing the complexities of heterogeneous nanoparticle subpopulations.


Conflict of interest statement

Competing Financial Interests

The authors have no competing financial interests.

Figures

Figure 1
Figure 1
Identification, via AF4 and EM imaging analysis, of exomeres and two distinct subpopulations of exosomes released by tumor cells. (a) A representative AF4 fractionation profile of B16-F10-derived exosomes. x- axis, time (min); y-axis (scale) and black dots, hydrodynamic radius (nm); red and blue lines illustrate the QELS (DLS) intensity and UV absorbance (shown on a relative scale), respectively. P1-P5 marks the peaks detected based on UV absorbance. Fractions were pooled for exomeres (hydrodynamic diameter <50 nm,); Exo-S (60-80 nm); and Exo-L (90-120 nm). (b) Representative correlation function at peak 3 (P3), t = 25.1 min. For (a) and (b) the experiment was repeated independently 50 times with similar results. (c) TEM imaging analysis of exosome input mixture (pre-fractionation) and fractionated exomeres, Exo-S and Exo-L subpopulations. Arrows point to exomeres (red), Exo-S (blue) and Exo-L (green). Scale bar, 200 nm. This experiment was repeated 7 times independently with similar results. (d) Western blotting analysis of exosomal marker proteins in fractionated samples. 100 μg of whole cell extract (WCE) and 10 μg of exosome and exomere mixture input and each subset were analyzed. This experiment was done once. (e) Measurement of hydrodynamic diameters of exomeres, Exo-S and Exo-L derived from representative cell lines (i.e. B16-F10 (F10), AsPC-1, Pan02, MDA-MB-4175 (4175) and 4T1) in the batch mode using Zetasizer after pooling fractions collected for each subset of nanoparticles from an individual AF4 fractionation. Data are presented as mean±SEM (standard error of the mean), in the order of exomere, Exo-S and Exo-L: B16-F10 (n=10, 9, and 8 independent measurements, respectively); Pan02 (n=11, 6, 11); AsPC-1 (n=5, 5, 5); 4175 (n=3, 5, 3); 4T1 (n=5, 5, 5)) (f) TEM imaging analysis of fractions collected from explant culture of fresh human melanoma tissue. Scale bar, 200 nm. This experiment was performed with two independent specimens with similar results. (g) Batch mode measurement of hydrodynamic diameters of fractions shown in (f). Data are presented as mean±SEM (exomeres and Exo-L, n=6; Exo-S, n=7 independent measurements). Statistical source data are provided in Supplementary Table 8, and unprocessed blots are provided in Supplementary Figure 7.
Figure 2
Figure 2
Characterization of physical and mechanical properties of exomeres and exosome subpopulations. Zeta potential (a) and stiffness (b) of exomeres and exosome subpopulations derived from various cancer cells were measured using Zetasizer and AFM indentation, respectively. Young’s modulus was used to express particle stiffness. At least 3 and 5 replicates for each group of particles was measured for zeta potential and stiffness, respectively. Data are presented as mean±SEM. For (a), in the order of exomere, Exo-S and Exo-L: B16-F10 (n=8, 10, and 12 independent measurements, respectively); Pan02 (n=13, 11, 13); AsPC-1 (n=12, 12, 12); 4175 (n=17, 9, 6); 4T1 (n=13, 3, 9); for (b), B16-F10 (n=6, 6, 6 particles measured); Pan02 (n=6, 6, 6); AsPC-1 (n=21, 19, 16); 4175 (n=11, 10, 5); 4T1 (n=9, 8, 9)). (c) Representative AFM image of exomeres derived from B16F10. This experiment was repeated with samples derived from 3 different cell lines with similar results. (d) AFM imaging analysis of the height (z-dimension) of exomeres derived from B16F10 (n=754 particles analyzed), AsPC1 (n=475) and MDA-MB-4175 (n=160). Mean±SEM is depicted. Statistical source data are provided in Supplementary Table 8.
Figure 3
Figure 3
Proteomic profiling of exomeres and exosome subpopulations derived from various cancer cells. (a) Venn diagram of proteins identified in each subset of particles. (b) Principal component analysis and (c) Consensus clustering analysis of normalized proteomic mass spectrometry datasets from human (MDA-MB-4175 and AsPC1) and mouse (B16F10, 4T1, and Pan02) cell lines. (d) Heat map illustration of unique proteins specifically associated with exomeres, Exo-S and Exo-L. Scale shown is intensity (area) subtracted by mean and divided by row standard deviation (i.e. Δ (area-mean)/SD). (e) Western blot analysis of representative signature proteins in fractionated samples. An equal amount (10 μg) of exosome and exomere input mixture and each subset were analyzed. This experiment was done once. (f) Heat map illustration of the relative abundance of conventional exosome markers in exomeres, Exo-S and Exo-L. Scale shown is intensity (area) subtracted by mean and divided by row standard deviation (i.e. Δ (area-mean)/SD). (g) Identification of top candidate gene sets enriched in exomere, Exo-S and Exo-L populations by gene set enrichment analysis (GSEA). Proteins in each subset of nanoparticles are ranked by GSEA based on their differential expression level. Whether a pre-specified pathway is significantly overrepresented toward the top or bottom of the ranked gene list in each subset of nanoparticle is evaluated using the normalized enrichment score (the green line). Black vertical lines mark the positions where the members of a particular pathway appear in the ranked list of genes. Proteins that contributed most to the enrichment score are listed below the plot. For all proteomic analysis (b-d, f-g), a total of 30 samples (3 nanoparticle subtypes derived from 5 different cell lines; and two independent biological replicates for each nanoparticle sample) were subjected to statistical analysis. Unprocessed blots are provided in Supplementary Figure 7.
Figure 4
Figure 4
Characterization of N-glycosylation of proteins associated with exomere, Exo-S and Exo-L. (a) Lectin blotting analysis of N-glycan profile of proteins associated with exomeres versus exosome subpopulations Exo-S and Exo-L. Phaseolus vulgaris erythroagglutinin (E-PHA) and Phaseolus vulgaris leucoagglutinin (L-PHA) recognize bisected and branched N-glycans, respectively. Aleuria aurantia lectin (AAL) recognizes Fucα6GlcNAc and Fucα3GlcNAc. Sambucus nigra lectin (SNA) recognizes α-2,6-linked sialic acid. All experiments were repeated independently twice with similar results except for AAL and E-PHA blotting for B16-F10 and 4175 which were done once. (b) Mass spectrometric analysis of N-glycans of glycoproteins present in exomeres, Exo-S and Exo–L subsets of B16F10. One representative experiment of two biologically independent replicates is shown. (c) Comparison of the relative abundance of the top six most abundant N-glycan structures among exomere, Exo-S and Exo-L of B16F10. The assignments (m/z) [charge; neutral exchange] for MALDI-MS and nanoLC-ESI-MS/MS are the following: (2015.8 [-H; 0]; 1007.4a [-2H; 0]), (2209.8 [-H; 0]; 1104.4a [-2H; 0]), (2237.7b [-H; Na-H]; 732.57a [-3H; 0]), (2365.5b [-H;4K-4H]; 783.9a [-3H; 0] and 1182.4a,b [-2H; 4K-4H]), and (2404.8b [-H; 2K-2H]; 1201.9b [-2H; 2K-2H]). Data shown were quantified and normalized to the most abundant structure in the sample. Results are represented as average of three independent analytical measurements of one representative experiment. Statistical source data are provided in Supplementary Table 8, and unprocessed blots are provided in Supplementary Figure 7. Note: aThe product ion spectra for this species did not allow a complete structural assignment. bAssignments admit neutral exchanges of protons with cations in sialoglycans, including the presence of potassium and sodium.
Figure 5
Figure 5
Characterization of lipid composition in exomeres and exosome subsets. (a) Comparison of total lipid content of each subset of nanoparticles derived from different cell lines. Total signal intensity of each sample after normalization to sample weight and internal standards was compared to that of exomeres from the same set of samples (expressed as fold change). Data are presented as mean±SEM (n=3 biologically independent samples). (b) Relative abundance of each lipid class present in each subset of nanoparticles from different cell lines. Data are presented as mean±SEM (n=3 biologically independent samples). For (a) and (b), statistical source data are provided in Supplementary Table 8. (c) Heat map illustration of lipid classes specifically associated with exomeres, Exo-S and Exo-L (ANOVA test, q<0.05). Statistical analysis was performed on a total of 9 samples for each cell line (3 different nanoparticle subtypes and 3 independent biological repeats for each nanoparticle sample). Abbreviation: Cer, ceramide; CerG1-3, glucosylceramides; CL, cardiolipin; DG, diglyceride; LPC, lysophosphatidylcholine; LPE, lysophosphatidylethanolamine; LPG, lysophosphatidylglycerol; LPI, lysophosphatidylinositol; MG, monoglyceride; PC, phosphatidylcholine; PE, phosphatidylethanolamine; PG, phosphatidylglycerol; PI, phosphatidylinositol; PS, phosphatidylserine; SM, sphingomyelin; TG, triglyceride.
Figure 6
Figure 6
Characterization of nucleic acid association with exomere and exosome subsets. (a) Relative abundance of DNA associated with each subpopulation of particles from representative fractionations of B16F10, AsPC1 and MDA-MB-4175. (b) Agilent Bioanalyzer analysis of the size distribution of DNA associated with different subsets of particles. Data shown are the electropherograms (left) and electrophoresis images (right) from a representative of two independent experiments on AsPC1-derived particles. Black arrows, internal standards (35bp and 10380bp). Red line, exomeres; blue line, Exo-S; green line, Exo-L. (c) Relative abundance of total RNA associated with each subpopulation of particles from representative fractionations of B16F10 and AsPC1. (d) Size distribution of RNA isolated from different fractions of B16F10. Shown are representative profiles from one of two independent experiments. For (a) and (c), data shown are mean (n=2 biologically independent samples). Statistical source data are provided in Supplementary Table 8.
Figure 7
Figure 7
Organ biodistribution of B16F10-derived exomeres and exosome subpopulations in syngeneic naïve mice. (a) Whole organ imaging of NIR dye-labeled exomeres, Exo-S and Exo-L from a representative experiment using the Odyssey imaging system (LI-COR Biosciences; n=4 independent experiments). The dynamic range of signal intensity was adjusted for each organ so that the differences among these nanoparticle subsets can be easily recognized. Scale bar, 2.5 mm. (b) Quantification of the nanoparticle uptake in different organs in one representative experiment. This experiment was repeated independently 4 times with similar results. Signal intensity in each organ was acquired using the Image Studio (LI-COR Biosciences), and normalized to the brain from the same animal due to undetectable uptake of nanoparticles in this organ. Fold changes (y axis) were then calculated for each organ between the experimental group (i.e. input, exomere, Exo-S and Exo-L) versus the mock control. n=3 animals per group, results shown are mean ± SEM. Statistical significance determined using one way ANOVA (* p<0.05; ** p<0.01, unmarked, not significant). For lymph nodes, the p value for comparison between input versus Exo-L, exomere versus Exo-L and Exo-S versus Exo-L are 0.022, 0.001 and 0.01 respectively. Statistical source data are provided in Supplementary Table 8.

Comment in

  • Size matters in nanoscale communication.
    Zijlstra A, Di Vizio D. Zijlstra A, et al. Nat Cell Biol. 2018 Mar;20(3):228-230. doi: 10.1038/s41556-018-0049-8. Nat Cell Biol. 2018. PMID: 29476154 Free PMC article.

Similar articles

Cited by

References

    1. Thery C, Zitvogel L, Amigorena S. Exosomes: composition, biogenesis and function. Nature reviews Immunology. 2002;2:569–579. - PubMed
    1. S ELA, Mager I, Breakefield XO, Wood MJ. Extracellular vesicles: biology and emerging therapeutic opportunities. Nature reviews Drug discovery. 2013;12:347–357. - PubMed
    1. Raposo G, Stoorvogel W. Extracellular vesicles: exosomes, microvesicles, and friends. The Journal of cell biology. 2013;200:373–383. - PMC - PubMed
    1. Balaj L, et al. Tumour microvesicles contain retrotransposon elements and amplified oncogene sequences. Nature communications. 2011;2:180. - PMC - PubMed
    1. Choi DS, Kim DK, Kim YK, Gho YS. Proteomics, transcriptomics and lipidomics of exosomes and ectosomes. Proteomics. 2013;13:1554–1571. - PubMed

Publication types

MeSH terms