. 2018 Feb 5:11:25.
doi: 10.3389/fnmol.2018.00025. eCollection 2018.

High Throughput Measurement of Locomotor Sensitization to Volatilized Cocaine in Drosophila melanogaster

Affiliations

High Throughput Measurement of Locomotor Sensitization to Volatilized Cocaine in Drosophila melanogaster

Ana Filošević et al. Front Mol Neurosci. .

Abstract

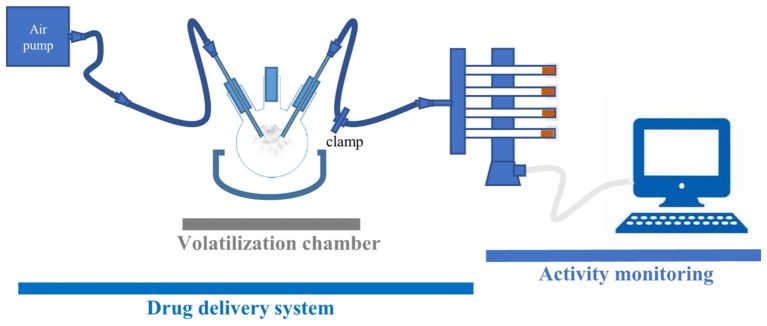
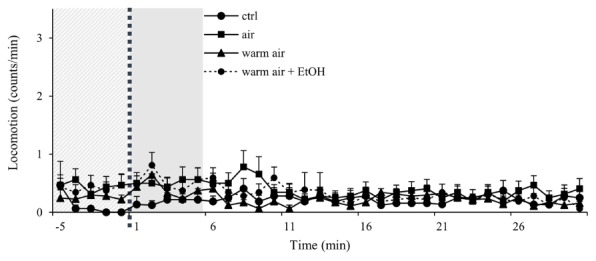
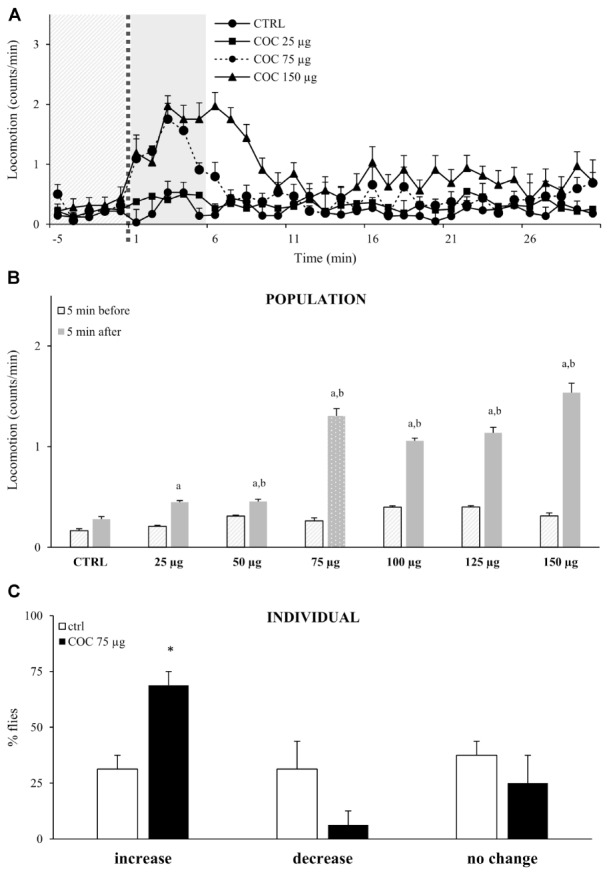
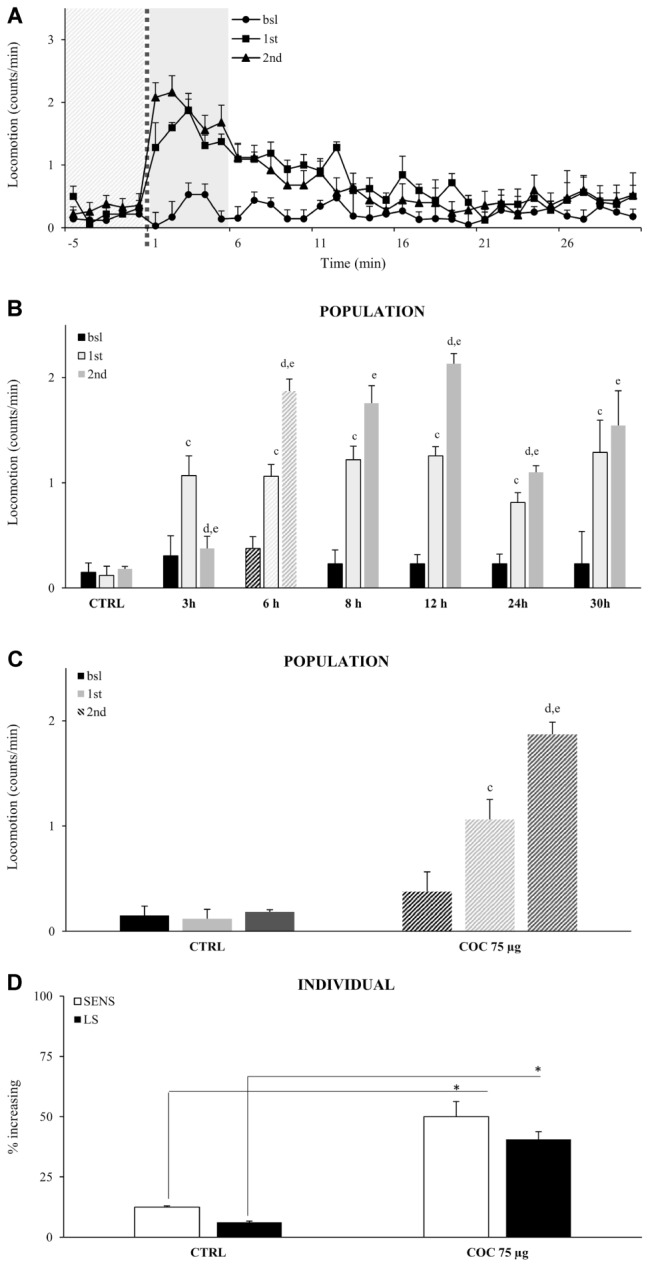
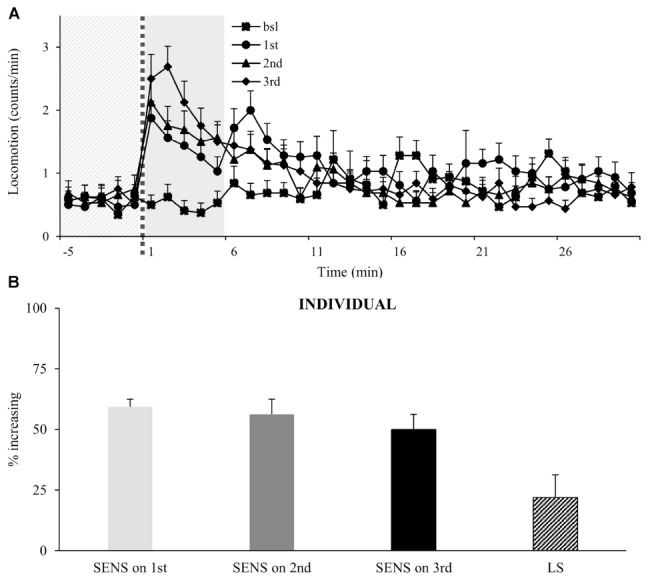
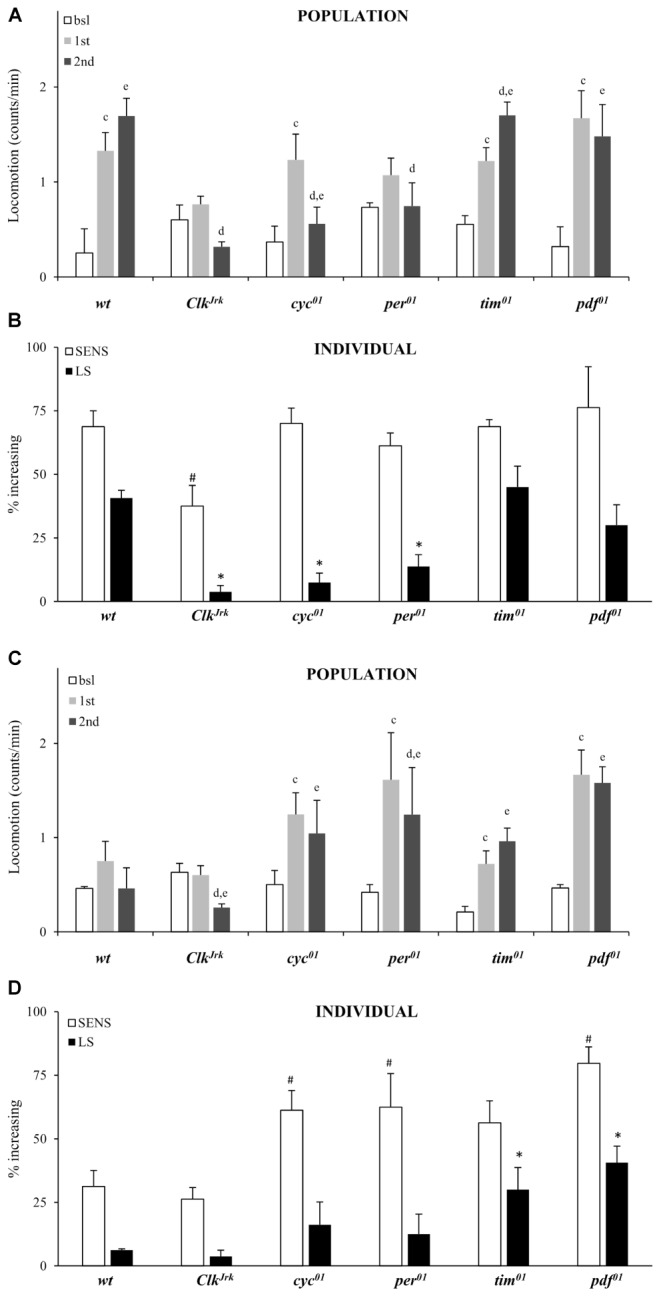
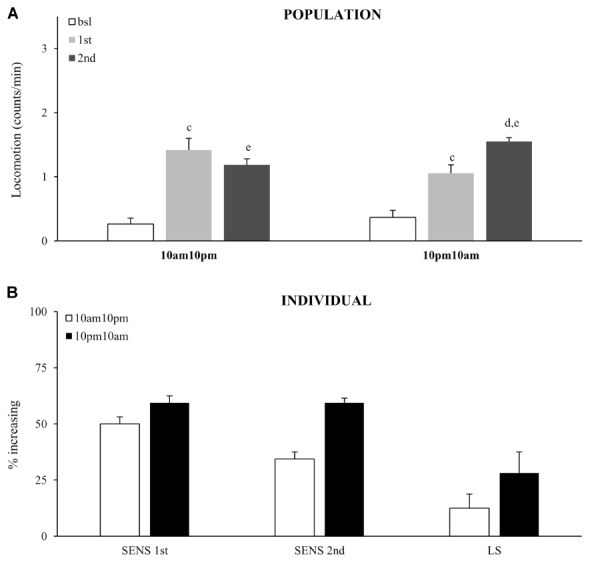
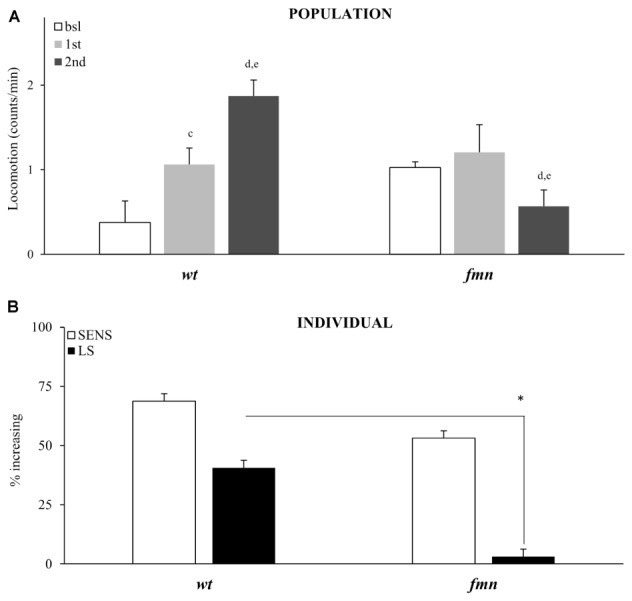
Drosophila melanogaster can be used to identify genes with novel functional roles in neuronal plasticity induced by repeated consumption of addictive drugs. Behavioral sensitization is a relatively simple behavioral output of plastic changes that occur in the brain after repeated exposures to drugs of abuse. The development of screening procedures for genes that control behavioral sensitization has stalled due to a lack of high-throughput behavioral tests that can be used in genetically tractable organism, such as Drosophila. We have developed a new behavioral test, FlyBong, which combines delivery of volatilized cocaine (vCOC) to individually housed flies with objective quantification of their locomotor activity. There are two main advantages of FlyBong: it is high-throughput and it allows for comparisons of locomotor activity of individual flies before and after single or multiple exposures. At the population level, exposure to vCOC leads to transient and concentration-dependent increase in locomotor activity, representing sensitivity to an acute dose. A second exposure leads to further increase in locomotion, representing locomotor sensitization. We validate FlyBong by showing that locomotor sensitization at either the population or individual level is absent in the mutants for circadian genes period (per), Clock (Clk), and cycle (cyc). The locomotor sensitization that is present in timeless (tim) and pigment dispersing factor (pdf) mutant flies is in large part not cocaine specific, but derived from increased sensitivity to warm air. Circadian genes are not only integral part of the neural mechanism that is required for development of locomotor sensitization, but in addition, they modulate the intensity of locomotor sensitization as a function of the time of day. Motor-activating effects of cocaine are sexually dimorphic and require a functional dopaminergic transporter. FlyBong is a new and improved method for inducing and measuring locomotor sensitization to cocaine in individual Drosophila. Because of its high-throughput nature, FlyBong can be used in genetic screens or in selection experiments aimed at the unbiased identification of functional genes involved in acute or chronic effects of volatilized psychoactive substances.

Keywords: Drosophila melanogaster; addiction; circadian genes; cocaine; locomotor activity; locomotor sensitization; neuronal plasticity.


Figures

FIGURE 1
FIGURE 1
FlyBong platform for measuring changes in locomotor activity of Drosophila after delivery of vCOC. Cocaine dissolved in ethanol is pipetted into three-neck flask, which is then heated to the cocaine volatilization temperature. Single flies are housed in the individual tubes of the vertical Drosophila monitor (TriKinetics) and exposed to vCOC for 1 min by turning on the air pump and removing the clamp. Their locomotor activity is monitored as the number of crossings of the midline of the tube per minute for 30 min before and 30 min after vCOC exposure.
FIGURE 2
FIGURE 2
Control experiments show minimal disturbance of locomotor activity in wt males. Kinetic line graphs of locomotor activity in different control groups. Group no treatment represent flies with normal activity without any experimental exposures, air - 2.5 L/min air flow for 1 min, warm air - 2.5 L/min air flow for 1 min, following 8 min of heating, warm air + EtOH - 2.5 L/min air flow for 1 min following 8 min of heating of 75 μL of 96% ethanol. Experiments n = 32 flies per group, were repeated for each group three times. Light gray panel represents locomotor activity 5 min before exposure for all groups, dotted line is time of the exposure, and darker gray panel denotes 5 min after exposure. Data are plotted as mean + SEM of counts/min, with a resolution of 1 min.
FIGURE 3
FIGURE 3
Exposure to vCOC transiently and dose-dependently increases locomotor activity. (A) Kinetic graph of locomotion expressed as number of counts per minute for a control group of flies exposed to warm air (ctrl) and of groups exposed to vCOC concentrations of 25 μg (COC 25 μg), 75 μg (COC 75μg), or 150 μg (COC 150μg). Experiments n = 32 flies per group, were repeated for each group three times The light gray panel indicates the 5 min immediately prior to exposure, the dotted line is the time of exposure and the dark gray panel indicates 5 min after exposure. (B) Mean locomotor activity + SEM for vCOC concentrations ranging from 25 to 150 μg (n = 32 flies per treatment) for the 5 min immediately before and after cocaine exposure. Statistical significance (p ≤ 0.05) indicated by a: within group comparison of locomotion before and after administration (t-test for dependent samples); b: between group comparison for 5 min after exposure (t-test for independent samples). (C) Changes in level of locomotor response of individual flies where amount of locomotor activity for individual fly after exposure to 75 μg of vCOC (8 min heating, 1 min exposure and 2.5 L/min air flow) or warm air control (ctrl) (n = 32 for each group). Changes are categorized as increase, decrease or no change, based on locomotion in the 5 min immediately after exposure, compared to the 5 min before. χ2 test statistical significance (p ≤ 0.05) between group comparison.
FIGURE 4
FIGURE 4
Locomotor sensitization to vCOC depends on time interval between exposures wile only limited number of individual flies in a population develops locomotor sensitization to vCOC. (A) Kinetic graph of average locomotion (counts per minute) for group of flies (n = 32) before administration (bsl), and after administrations of 75 μg vCOC first at 09:00 AM (1st) and then a second administration at 03:00 PM (2nd). Light gray panel 5 min before exposure, dotted line is time of the exposure, dark gray panel 5 min after exposure. (B) Histogram of different duration of time intervals between two administrations of vCOC (75 μg), plotted as a mean of population (32 flies) locomotor activity 5 min before (bsl) and 5 min after COC (1st) exposures at 09:00 AM and 2nd at different time points [12:00 AM (3 h), 03:00 PM (6 h), 05:00 PM (8 h), 09:00 PM (12 h), 09:00 AM of the following day (24 h) and 03:00 PM of the following day (30 h)], +SEM. The control (CTRL) group was exposed to warm air (8 min of heating, 1 min exposure, and 2.5 L/min air flow rate). Statistical significance (p ≤ 0.05) indicated by: c: within group comparison of bsl with 1st; d: 1st with 2nd; e: bsl with 2nd (t-tests for dependent samples). (C) Population response of the control group (CTRL) exposed to warm air and a group exposed twice to vCOC (COC 75 μg) using our standard protocol, with the first administration at 9:00 AM and the second at 3:00 PM. Data are plotted as mean of population (32 flies) locomotor activity 5 min before and 5 min after (1st and 2nd) exposure to COC, +SEM. Statistical significance (p ≤ 0.05) indicated by: c: comparison of bsl with 1st; d: 1st with 2nd; e: bsl with 2nd (within group comparison using t-test for dependent samples). (D) Analysis of individual flies from data in part (A). Percent of individual flies in a population that show sensitivity (SENS) and locomotor sensitization (LS) in control (CTRL) and group exposed to vCOC (COC 75 μg). χ2 test statistical significance p ≤ 0.05. Starting data were same as (C) from which categories increase, decrease and same were divided.
FIGURE 5
FIGURE 5
Multiple exposures to cocaine increases locomotor activity of a population, while sensitivity of individual flies does not change. (A) Kinetic graph of mean locomotion (counts/minute) for group of flies (n = 32) both before (bsl) administration, and after exposure to volatilized 45 μg cocaine on three occasions: the first at 09:00 AM (1st), the second at 07:00 PM (2nd) and the third at 09:00 AM of the next day (3rd). The light gray panel indicates the 5 min immediately prior to exposure, the dotted line is the time of exposure and the dark gray panel indicates 5 min after exposure. (B) Analysis of individual flies from data in part (A). Percentage of individual flies in population which show sensitivity (SENS) and locomotor sensitization (LS). Starting data were same as (A) from which categories increase, decrease and same were divided.
FIGURE 6
FIGURE 6
Locomotor sensitization to vCOC depends on circadian genes. (A) Average locomotor activity of flies 5 min before drug exposures (bsl), 5 min after first exposure (first) and 5 min after second (second) exposure to 75 μg of vCOC given 6 h apart. Fly populations were either wild type (wt) or mutant for circadian genes ClkJrk, per01, cyc01, tim01 and pdf01 (n = 32 for each group). Statistical significance (p ≤ 0.05) indicated by: c: comparison of baseline to after first administration; d: after first to after second and e: baseline to after second administration (all within the group using t-test for dependent samples). (B) Percentage of individual flies showing sensitivity or increasing locomotor activity to the first exposure of vCOC (bsl vs. 1st) and flies showing further increase in locomotor activity to the second exposure (LS) (bsl vs. 1st vs. 2nd). χ2 test showed statistical significance p ≤ 0.05 for comparison of wt to mutants in SENS (#) and () LS. Starting data were same as (A) from which categories increase, decrease and same were divided. (C) Average locomotor activity (counts/min) during baseline, 5 min before exposures (bsl), 5 min after first exposure (1st) and 5 min after second (2nd) exposure to warm air flow (2.5 L/min, for 1 min after 8 min of heating), given 6 h apart. Fly populations were either wild type (wt) or mutants for circadian genes ClkJrk, per01, cyc01, tim01, and pdf01 (n = 32 for each group). Statistical significance (p ≤ 0.05) indicated by: c: comparison of baseline activity to after first administration; d: comparison of activity after first and second exposures; e: comparison of baseline activity to after second administration. All tests were within the group, using t-test for dependent samples. (D) Percentage of individual flies showing sensitivity or increased locomotor activity to a first exposure to warm air flow (2.5 L/min, for 1 min after 8 min of heating) and flies showing further increase in locomotor activity to a second exposure (LS). χ2 test showed statistical significance (p ≤ 0.05) for comparison of wt to mutants in SENS (#) and () LS. Starting data were same as (C) from which categories increase, decrease and same were divided.
FIGURE 7
FIGURE 7
Time of day modulates locomotor sensitization, without affecting sensitivity to the first exposure. (A) Average locomotor activity (counts/min) during baseline, 5 min before drug exposures (bsl), 5 min after first exposure (1st) and 5 min after second (2nd) exposure to 75 μg of vCOC given 12 h apart for of a population of wild type (wt) (n = 32 for each group). Statistical significance (p ≤ 0.05) indicated by: c: comparison of baseline to after first administration; d: after first to after second; e: baseline to after second administration (all within the group using t-test for dependent samples). (B) Percentage of individual flies showing increase in locomotor activity to the first exposure of vCOC compared to baseline (SENS 1st), percentage of flies that show increase in locomotor activity to the second exposure, relative to the first (SENS 2nd), and a subgroup that shows increase after first and further increase after second exposure (LS). Starting data were same as (A) from which categories increase, decrease and same were divided.
FIGURE 8
FIGURE 8
Locomotor sensitization to vCOC is dependent on a functional dopaminergic transporter. (A) Average locomotor activity (counts/min) during baseline, 5 min before drug exposures (bsl), 5 min after first exposure (1st) and 5 min after 2nd) exposure to 75 μg of vCOC given 6 h apart for a population of wild type (wt), and flies mutant in dopaminergic transporter, fumin (fmn) (n = 32 for each group). Statistical significance p ≤ 0.05; c: comparison of baseline to after first administration, d: after first to after second and e: baseline to after second administration (all within the group using t-test for dependent samples). (B) Percent of individual flies increasing locomotor activity to first exposure of vCOC (bsl vs. 1st) and flies showing further increase in locomotor activity to the second exposure (LS) (bsl vs. 1st vs. 2nd). χ2 test showed statistical significance p ≤ 0.05 () for wt compared to fmn in LS. Starting data were same as (A) from which categories increase, decrease and same were divided.

References

    1. Abarca C., Albrecht U., Spanagel R. (2002). Cocaine sensitization and reward are under the influence of circadian genes and rhythm. Proc. Natl. Acad. Sci. U.S.A. 99 9026–9030. 10.1073/pnas.142039099 - DOI - PMC - PubMed
    1. Andretic R., Chaney S., Hirsh J. (1999). Circadian genes are required for cocaine sensitization in Drosophila. Science 285 1066–1068. 10.1126/science.285.5430.1066 - DOI - PubMed
    1. Andretic R., van Swinderen B., Greenspan R. (2005). Dopaminergic modulation of arousal in Drosophila. Curr. Biol. 15 1165–1175. 10.1016/j.cub.2005.05.025 - DOI - PubMed
    1. Bainton R. J., Tsai L. T., Schwabe T., DeSalvo M., Gaul U., Heberlein U. (2005). moody encodes two GPCRs that regulate cocaine behaviors and blood-brain barrier permeability in Drosophila. Cell 123 145–156. 10.1016/j.cell.2005.07.029 - DOI - PubMed
    1. Bainton R. J., Tsai L. T., Singh C. M., Moore M. S., Neckameyer W. S., Heberlein U. (2000). Dopamine modulates acute responses to cocaine, nicotine and ethanol in Drosophila. Curr. Biol. 10 187–194. 10.1016/S0960-9822(00)00336-5 - DOI - PubMed

LinkOut - more resources