Review
. 2018 Feb 5:12:5.
doi: 10.3389/fncir.2018.00005. eCollection 2018.

Neuromodulation via the Cerebrospinal Fluid: Insights from Recent in Vitro Studies

Affiliations
Review

Neuromodulation via the Cerebrospinal Fluid: Insights from Recent in Vitro Studies

Andreas Bjorefeldt et al. Front Neural Circuits. .

Abstract

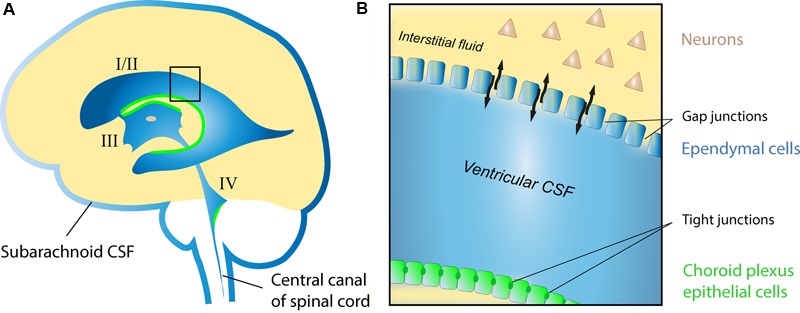
The cerebrospinal fluid (CSF) occupies the brain's ventricles and subarachnoid space and, together with the interstitial fluid (ISF), forms a continuous fluidic network that bathes all cells of the central nervous system (CNS). As such, the CSF is well positioned to actively distribute neuromodulators to neural circuits in vivo via volume transmission. Recent in vitro experimental work in brain slices and neuronal cultures has shown that human CSF indeed contains neuromodulators that strongly influence neuronal activity. Here we briefly summarize these new findings and discuss their potential relevance to neural circuits in health and disease.

Keywords: cerebrospinal fluid; neural circuit; neuromodulation.


Figures

FIGURE 1
FIGURE 1
Schematic drawing of the human CSF system. (A) The position of the lateral (I/II), third (III), and fourth (IV) ventricles with respective choroid plexa (green), and the subarachnoid CSF compartments surrounding the brain and spinal cord. (B) Enlargement of area highlighted in (A) showing the interface between ventricular CSF and the ISF of the parenchyma in the adult brain. Note the restricted molecular exchange across the choroid plexus epithelial lining, where cells are adjoined by tight junctions (blood-CSF barrier), as opposed to areas of the ventricular lining composed of ependymal cells connected by gap junctions (black arrows indicate free exchange of molecules between CSF and ISF at these sites).
FIGURE 2
FIGURE 2
Effects of human CSF on CA1 pyramidal cells in the rat hippocampus. (A) Example traces of spontaneous action potentials recorded at resting membrane potential (Vrest) in aCSF and after 10 min of hCSF perfusion. (B) Summary graph of the effect of hCSF on spontaneous firing at Vrest. (C,D) Summary bar graphs showing effect of hCSF on Vrest under conditions of unperturbed (C) and clamped (D) G-protein activity. (E) Example traces of action potential threshold recorded in aCSF and after 10 min of hCSF perfusion. (F,G) Summary bar graphs showing effect of hCSF on action potential threshold under conditions of unperturbed (F) and clamped (G) G-protein activity. (H) Example traces of action potentials evoked by depolarizing current injections from –70 mV in aCSF and after 10 min of hCSF perfusion. (I) Summary graph of the effect of hCSF on the frequency-current (input–output) relationship in CA1 pyramidal cells. (J) Summary graph showing normalized change in rheobase, gain (slope), amount of injected current required to reach 50% of maximum firing frequency (I Fmax/2) and maximum firing frequency (Fmax) in hCSF. (K) Summary graph showing effect of hCSF on the EPSP slope (upper left graph), fiber volley (lower left graph), and paired-pulse ratio (PPR) in extracellular field recordings from CA1 stratum radiatum. (L) Summary graph of the effect of normal vs. dialyzed hCSF (hCSF and D. hCSF) on the EPSP slope (upper graph) and fiber volley (lower graph) in extracellular field recordings. P < 0.05; ∗∗P < 0.01; ∗∗∗P < 0.001. Adapted from Bjorefeldt et al. (2015).
FIGURE 3
FIGURE 3
Effects of human CSF on fast-spiking and non-fast-spiking rat hippocampal CA1 interneurons. (A) Example of cell morphology in the FS interneuron group. (B) Example traces of spontaneous action potentials recorded at Vrest in aCSF and after 10 min of hCSF perfusion in a FS interneuron. (C,D) Summary bar graphs showing effect of hCSF on Vrest (C) and spontaneous firing frequency (D) in the FS interneuron group. (E) Example traces of action potentials evoked by depolarizing current injection from –70 mV in aCSF and after 10 min of hCSF perfusion. (F) Summary graph of the effect of hCSF on the frequency-current (input–output) relationship in FS CA1 interneurons. (G) Summary graph showing normalized change in rheobase, gain (slope), amount of injected current required to reach 50% of maximum firing frequency (I Fmax/2) and maximum firing frequency (Fmax) in hCSF. (H) Summary graph of the effect of hCSF on the threshold of first elicited action potential in response to depolarizing current injection from –70 mV in FS interneurons. (I) Example of cell morphology in the NFS interneuron group. (J) Example traces of spontaneous action potentials recorded at Vrest in aCSF and after 10 min of hCSF perfusion in a NFS interneuron. (K,L) Summary bar graphs showing effect of hCSF on Vrest (K) and spontaneous firing frequency (L) in the NFS interneuron group. (M) Example traces of action potentials evoked by depolarizing current injection from –70 mV in aCSF and after 10 min of hCSF perfusion. (N) Summary graph of the effect of hCSF on the frequency-current (input–output) relationship in NFS CA1 interneurons. (O) Summary graph showing normalized change in rheobase, gain (slope), amount of injected current required to reach 50% of maximum firing frequency (I Fmax/2) and maximum firing frequency (Fmax) in hCSF. (P) Summary graph of the effect of hCSF on the threshold of first elicited action potential in response to depolarizing current injection from –70 mV in NFS interneurons. P < 0.05; ∗∗P < 0.01; ∗∗∗P < 0.001. Adapted from Bjorefeldt et al. (2016).
FIGURE 4
FIGURE 4
Microelectrode array recordings of neuronal culture to study the impact of human CSF on neuronal network activity. Representative image of a (A) multielectrode array (MEA), (B) synchronous neuronal network activity detected by 59 electrodes, (C) cortical neural cells cultures on MEAs, and cortical neuronal morphology. (D) Schematic drawing of a recording procedure used to study the functional impact of human CSF samples on neuronal cultures. Examples show the neuronal network activity of cortical neurons exposed to cultivation media, aCSF and human CSF samples from a healthy individual.

Similar articles

Cited by

References

    1. Agnati L. F., Fuxe K., Zoli M., Ozini I., Toffano G., Ferraguti F. (1986). A correlation analysis of the regional distribution of central enkephalin and beta-endorphin immunoreactive terminals and of opiate receptors in adult and old male rats. Evidence for the existence of two main types of communication in the central nervous system: the volume transmission and the wiring transmission. Acta Physiol. Scand. 128 201–207. 10.1111/j.1748-1716.1986.tb07967.x - DOI - PubMed
    1. Agnati L. F., Guidolin D., Guescini M., Genedani S., Fuxe K. (2010). Understanding wiring and volume transmission. Brain Res. Rev. 64 137–159. 10.1016/j.brainresrev.2010.03.003 - DOI - PubMed
    1. Barth A. L., Poulet J. F. (2012). Experimental evidence for sparse firing in the neocortex. Trends Neurosci. 35 345–355. 10.1016/j.tins.2012.03.008 - DOI - PubMed
    1. Bjorefeldt A., Andreasson U., Daborg J., Riebe I., Wasling P., Zetterberg H., et al. (2015). Human cerebrospinal fluid increases the excitability of pyramidal neurons in the in vitro brain slice. J. Physiol. 593 231–243. 10.1113/jphysiol.2014.284711 - DOI - PMC - PubMed
    1. Bjorefeldt A., Wasling P., Zetterberg H., Hanse E. (2016). Neuromodulation of fast-spiking and non-fast-spiking hippocampal CA1 interneurons by human cerebrospinal fluid. J. Physiol. 594 937–952. 10.1113/JP271553 - DOI - PMC - PubMed

Publication types