Review
. 2018 Feb 5:9:33.
doi: 10.3389/fneur.2018.00033. eCollection 2018.

Magnetic Resonance Spectroscopy, Positron Emission Tomography and Radiogenomics-Relevance to Glioma

Affiliations
Review

Magnetic Resonance Spectroscopy, Positron Emission Tomography and Radiogenomics-Relevance to Glioma

Gloria C Chiang et al. Front Neurol. .

Abstract

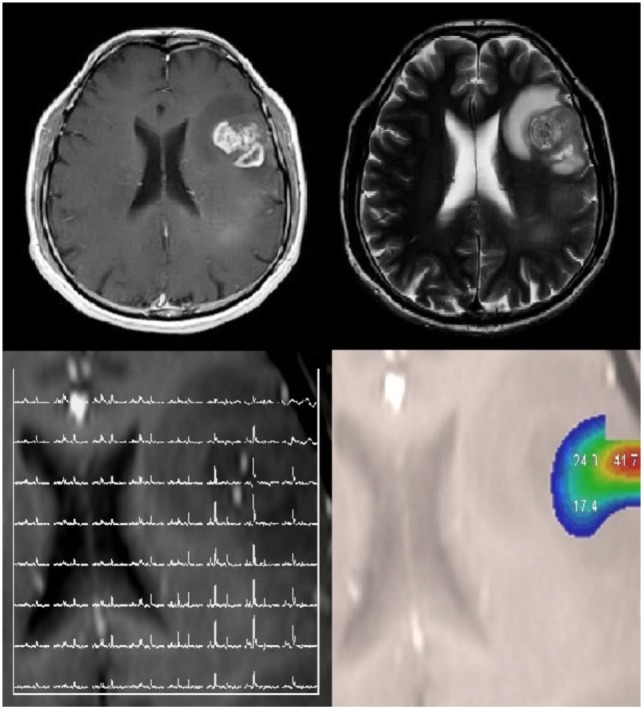
Advances in metabolic imaging techniques have allowed for more precise characterization of gliomas, particularly as it relates to tumor recurrence or pseudoprogression. Furthermore, the emerging field of radiogenomics where radiographic features are systemically correlated with molecular markers has the potential to achieve the holy grail of neuro-oncologic neuro-radiology, namely molecular diagnosis without requiring tissue specimens. In this section, we will review the utility of metabolic imaging and discuss the current state of the art related to the radiogenomics of glioblastoma.

Keywords: glioma; magnetic resonance spectroscopy; neurooncology; neuroradiology; positron-emission tomography; radiogenomics.


Figures

Figure 1
Figure 1
Multivoxel MRS of a glioblastoma. (A) Contrast-enhanced axial MR image demonstrating an enhancing mass in the left parietal lobe. (B) Corresponding multivoxel or spectroscopic imaging data displayed as color maps that show the spatial distributions of (left-to-right) total choline (tCho), total creatine (tCr), and N-acetylaspartate (NAA). Note marked elevation of tCho and decrease of NAA at the location of the tumor. (C) The same spectroscopic imaging data displayed as color maps of metabolite ratios: (left-to-right) tCho:NAA, tCr:NAA, and lactate or Lac:NAA. Because NAA decreased while tCho and Lac increased and tCr did not change appreciably, the maps of metabolite ratios to NAA result in enhancement and better definition of metabolite signals at the location of the tumor. Arrow on Lac:NAA map shows Lac to extend beyond the tumor margins. (D) (Left) Grid plot of the multivoxel data overlaid on the corresponding MR image of the tumor, and (right) a spectrum in a single voxel extracted from the multivoxel data at the location of the tumor (red box on left panel), showing clearly elevated tCho and Lac and decreased NAA resonances. No copyright permissions were required for use of these images.
Figure 2
Figure 2
MRS of R-2-hydroxyglutarate (2HG) in an oligodendroglioma. Sagittal 3D T2 FLAIR (A) and axial T2-weighted (B) imaging shows a T2-hyperintense mass in the left parietal lobe. Single voxel MRS in the tumoral region demonstrates elevated 2HG concentration (C), compatible with an isocitrate dehydrogenase-mutated glioma. No copyright permissions were required for use of these images.
Figure 3
Figure 3
Simultaneous fluoro-2-deoxy-d-glucose (FDG) positron emission tomography (PET)-MRI of a glioblastoma. (A) Contrast-enhanced axial MR image demonstrating a heterogeneously enhancing mass in the corpus callosum. (B) Co-registered PET-MR image accurately demonstrating that the focus of elevated FDG avidity corresponds to the solidly enhancing component. (C) FDG PET image, without co-registration with MRI, demonstrates a focus of elevated FDG-avidity. No copyright permissions were required for use of these images.
Figure 4
Figure 4
Anaplastic astrocytoma, status post surgery, radiation, and chemotherapy. (A) Contrast-enhanced coronal MR image demonstrating nodular enhancement about a right frontal operculum cavity. (B) Simultaneous co-registered positron emission tomography (PET)-MR image accurately demonstrating that the area of nodular enhancement has no associated elevated fluoro-2-deoxy-d-glucose (FDG) avidity. (C) Coronal image from a fused FDG PET-CT demonstrating no elevated FDG avidity in the region of nodular enhancement, although the anatomical resolution is limited compared to the PET-MR. No copyright permissions were required for use of these images.
Figure 5
Figure 5
Radiogenomics involves correlating molecular alterations in tumors with conventional and advanced imaging findings. A patient with a left frontal glioblastoma, which was isocitrate dehydrogenase wild type, EGFR amplified, with phosphatase and tensin homolog loss, and a mutated TERT promoter. This lesion is shown on T1-weighted contrast-enhanced and T2-weighted images. Multivoxel MR spectroscopy and choline-to-N-acetylaspartate color maps are also shown. No copyright permissions were required for use of these images.

References

    1. Balmaceda C, Critchell D, Mao X, Cheung K, Pannullo S, DeLaPaz RL, et al. Multisection 1H magnetic resonance spectroscopic imaging assessment of glioma response to chemotherapy. J Neurooncol (2006) 76(2):185–91.10.1007/s11060-005-5261-2 - DOI - PubMed
    1. Vigneron D, Bollen A, McDermott M, Wald L, Day M, Moyher-Noworolski S, et al. Three-dimensional magnetic resonance spectroscopic imaging of histologically confirmed brain tumors. Magn Reson Imaging (2001) 19(1):89–101.10.1016/S0730-725X(01)00225-9 - DOI - PubMed
    1. Wang Q, Zhang H, Zhang J, Wu C, Zhu W, Li F, et al. The diagnostic performance of magnetic resonance spectroscopy in differentiating high-from low-grade gliomas: a systematic review and meta-analysis. Eur Radiol (2016) 26(8):2670–84.10.1007/s00330-015-4046-z - DOI - PubMed
    1. Senft C, Hattingen E, Pilatus U, Franz K, Schänzer A, Lanfermann H, et al. Diagnostic value of proton magnetic resonance spectroscopy in the noninvasive grading of solid gliomas: comparison of maximum and mean choline values. Neurosurgery (2009) 65(5):908–913; discussion 913.10.1227/01.NEU.0000356982.82378.BA - DOI - PubMed
    1. Elias AE, Carlos RC, Smith EA, Frechtling D, George B, Maly P, et al. MR spectroscopy using normalized and non-normalized metabolite ratios for differentiating recurrent brain tumor from radiation injury. Acad Radiol (2011) 18(9):1101–8.10.1016/j.acra.2011.05.006 - DOI - PubMed

LinkOut - more resources