. 2018 Feb 5:9:144.
doi: 10.3389/fimmu.2018.00144. eCollection 2018.

Blood CXCR3+ CD4 T Cells Are Enriched in Inducible Replication Competent HIV in Aviremic Antiretroviral Therapy-Treated Individuals

Affiliations

Blood CXCR3+ CD4 T Cells Are Enriched in Inducible Replication Competent HIV in Aviremic Antiretroviral Therapy-Treated Individuals

Riddhima Banga et al. Front Immunol. .

Abstract

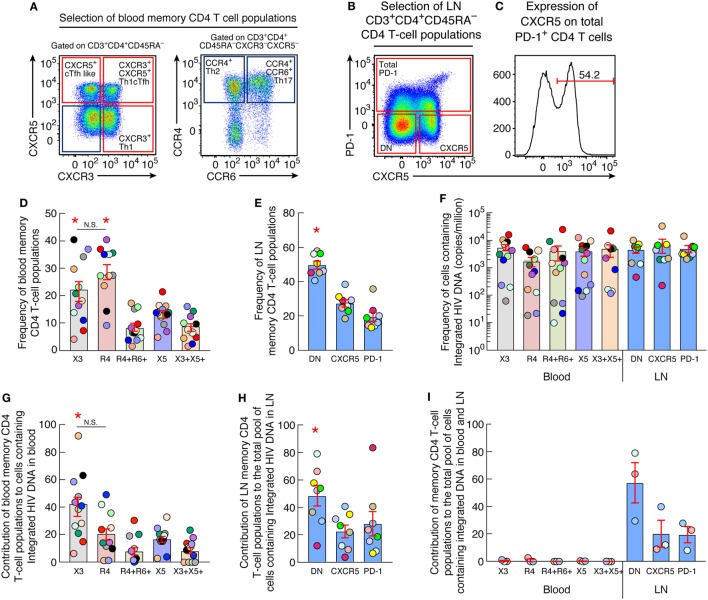
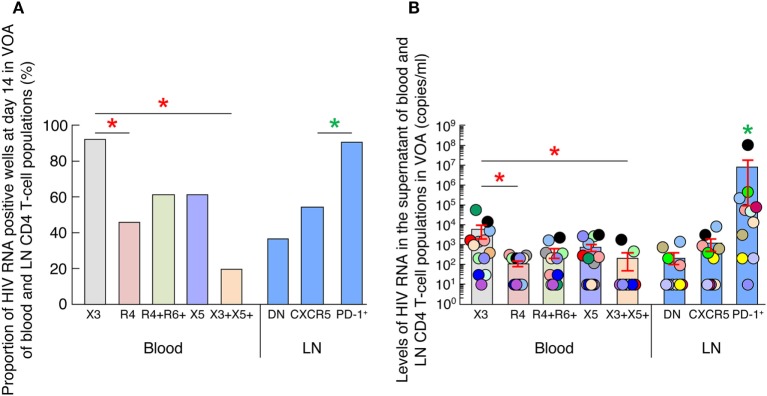
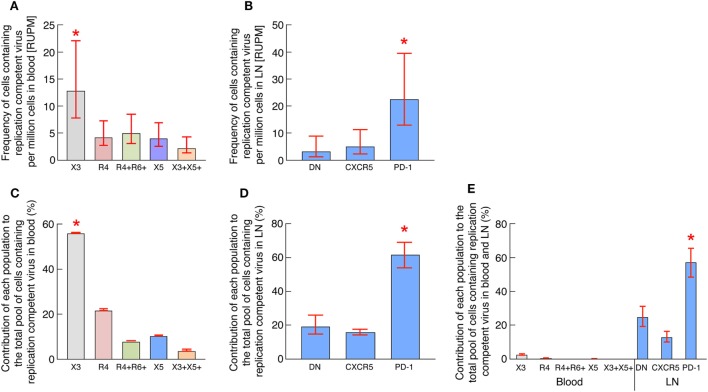
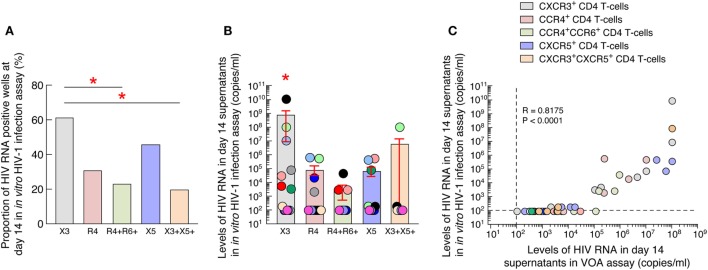
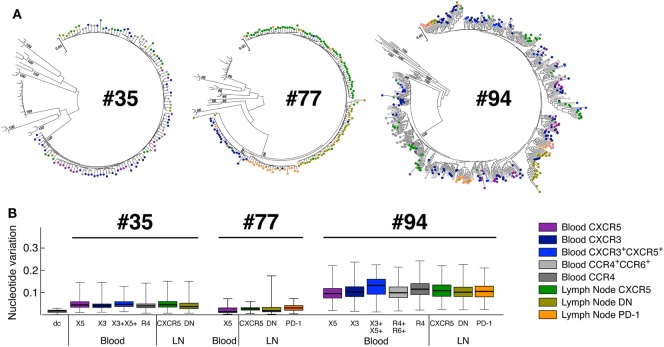
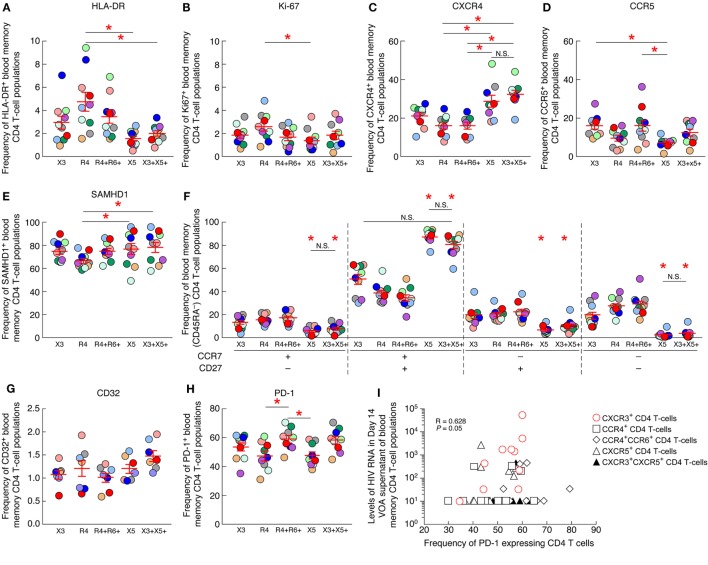
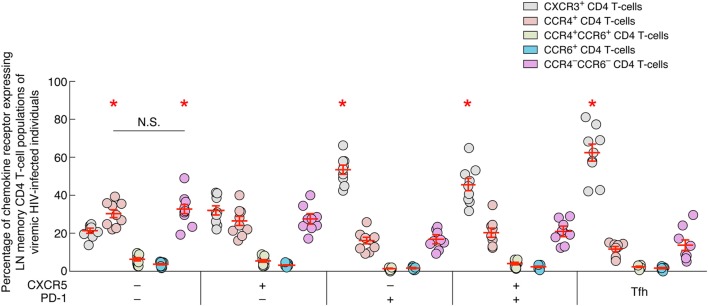
We recently demonstrated that lymph nodes (LNs) PD-1+/T follicular helper (Tfh) cells from antiretroviral therapy (ART)-treated HIV-infected individuals were enriched in cells containing replication competent virus. However, the distribution of cells containing inducible replication competent virus has been only partially elucidated in blood memory CD4 T-cell populations including the Tfh cell counterpart circulating in blood (cTfh). In this context, we have investigated the distribution of (1) total HIV-infected cells and (2) cells containing replication competent and infectious virus within various blood and LN memory CD4 T-cell populations of conventional antiretroviral therapy (cART)-treated HIV-infected individuals. In the present study, we show that blood CXCR3-expressing memory CD4 T cells are enriched in cells containing inducible replication competent virus and contributed the most to the total pool of cells containing replication competent and infectious virus in blood. Interestingly, subsequent proviral sequence analysis did not indicate virus compartmentalization between blood and LN CD4 T-cell populations, suggesting dynamic interchanges between the two compartments. We then investigated whether the composition of blood HIV reservoir may reflect the polarization of LN CD4 T cells at the time of reservoir seeding and showed that LN PD-1+ CD4 T cells of viremic untreated HIV-infected individuals expressed significantly higher levels of CXCR3 as compared to CCR4 and/or CCR6, suggesting that blood CXCR3-expressing CD4 T cells may originate from LN PD-1+ CD4 T cells. Taken together, these results indicate that blood CXCR3-expressing CD4 T cells represent the major blood compartment containing inducible replication competent virus in treated aviremic HIV-infected individuals.

Keywords: CXCR3; T follicular helper cells; circulating T follicular helper cell counterpart; lymph node; replication competent virus.


Figures

Figure 1
Figure 1
Quantification of HIV Integrated DNA in blood and lymph node memory CD4 T-cell populations (A) Representative flow cytometry profile of blood memory (CD45RA) CD4 T-cell populations expressing chemokine receptors isolated from one representative aviremic long-term-treated HIV-1-infected individual. (B) Representative flow cytometry profile of lymph nodes (LN) memory (CD45RA) CD4 T-cell populations expressing CXCR5 and/or PD-1 isolated from one aviremic HIV-1-infected long term-treated subject. (C) Representative flow cytometry profile of surface expression of CXCR5 on LN PD-1+ memory CD4 T cells isolated from one representative aviremic long-term-treated HIV-1-infected individual. (D) Frequency of chemokine receptor expressing blood memory (CD45RA) CD4 T cells isolated from aviremic long-term-treated HIV-1-infected individuals (N = 12). (E) Frequency of CXCR5 and/or PD-1-expressing LN CD4 T cells isolated from aviremic long-term-treated HIV-1-infected individual (N = 8). (F) Frequency of cells containing integrated HIV DNA (copies per million cells) within chemokine receptor expressing blood (N = 12) and CXCR5 and/or PD-1 expressing LN (N = 8) memory CD4 T-cell populations. (G) Contribution of chemokine receptor expressing blood memory CD4 T-cell populations to the total pool of cells containing integrated HIV DNA in blood (N = 12). (H) Contribution of CXCR5 and/or PD-1 expressing LN memory CD4 T-cell populations to the total pool of cells containing integrated HIV DNA in LN (N = 8). (I) Contribution of blood and LN memory CD4 T-cell populations of matched individuals to the total body pool of cells containing integrated HIV DNA in blood and LN compartments (N = 3). HIV-infected individuals are color coded (D–I). Histograms correspond to mean of blood or lymph node CD4 T-cell population (D–I); red bars correspond to SEM (D–I). “X3” corresponds to blood CXCR3-expressing CD4 T cells; “R4” corresponds to blood CCR4-expressing CD4 T cells; R4+R6+ corresponds to blood CCR4+CCR6+ CD4 T cells; “X5” corresponds to blood CXCR5-expressing CD4 T cells; And X3+X5+ corresponds to blood CXCR3+CXCR5+ CD4 T cells. “LN” corresponds to lymph node. Red stars indicate statistical significance (P < 0.05). Statistical significance (P-values) was obtained using one-way ANOVA (Kruskal–Wallis test) followed by Wilcoxon matched-pairs two-tailed signed rank test (D–I).
Figure 2
Figure 2
HIV replication and production of blood and lymph node (LN) memory CD4 T cell populations. (A) Proportion of HIV RNA positive wells among blood (N = 13) and LN (N = 11) memory CD4 T-cell populations at day 14 of virus outgrowth assay (VOA). Wells with detectable HIV-1 RNA (≥20 HIV-1 RNA copies/mL) were referred to as HIV-1 RNA-positive wells. (B) Levels of HIV-1 RNA in blood (N = 13) and LN (N = 11) memory CD4 T cell populations at day 14 of VOA. Undetectable values were arbitrarily defined as 10 HIV-1 RNA copies/mL. HIV-infected individuals are color coded (C). “X3” corresponds to blood CXCR3-expressing CD4 T cells; “R4” corresponds to blood CCR4-expressing CD4 T cells; R4+R6+ corresponds to blood CCR4+CCR6+ CD4 T cells; “X5” corresponds to blood CXCR5-expressing CD4 T cells; And X3+X5+ corresponds to blood CXCR3+CXCR5+ CD4 T cells. “LN” corresponds to lymph node. Red stars indicate statistical significance with in blood compartment (P < 0.05). Green stars indicate statistical significance within LN compartment (P < 0.05). Statistical significance (P-values) was either obtained using two-tailed Chi-square analysis for comparison of positive proportions (A) or using one-way ANOVA (Kruskal–Wallis test) followed by Wilcoxon matched-pairs two-tailed signed rank test (B).
Figure 3
Figure 3
Blood CXCR3-expressing CD4 T cells of long-term-treated aviremic HIV-1-infected individuals are enriched in cells containing replication competent virus. (A) Estimated RNA-unit per million (RUPM) frequencies in chemokine receptor expressing blood memory CD4 T-cell populations (N = 13). (B) Estimated RUPM frequencies in CXCR5 and/or PD-1 expressing lymph node (LN) memory CD4 T-cell populations (N = 11). (C) Estimated contribution of blood memory CD4 T-cell populations to the pool of cells containing replication competent virus in blood (N = 13). (D) Estimated contribution of LN memory CD4 T-cell populations to the pool of cells containing replication competent virus in LN compartment (N = 11). (E) Estimated contribution of blood and LN memory CD4 T-cell populations of matched individuals to the total pool of cells containing replication competent virus in blood and LN compartments (N = 6). Contribution of memory CD4 T-cell populations to the pool of cells containing replication competent virus was calculated as previously described (17). Histograms correspond to estimated mean (A–E) and red bars correspond to the lower and upper confidence interval at 0.95 (A–E). “X3” corresponds to blood CXCR3-expressing CD4 T cells; “R4” corresponds to blood CCR4-expressing CD4 T cells; R4+R6+ corresponds to blood CCR4+CCR6+ CD4 T cells; “X5” corresponds to blood CXCR5-expressing CD4 T cells; And X3+X5+ corresponds to blood CXCR3+CXCR5+ CD4 T cells. “LN” corresponds to lymph node. Red stars indicate statistical significance (P < 0.05). Statistical significance (P-values) was either obtained using Extreme Limiting Dilution analysis (http://bioinf.wehi.edu.au/software/elda/) (A,B), by pairwise comparisons of proportion with FDR correction (multiple tests) (C,E) or by Fisher’s exact test for pairwise comparisons (D) (36).
Figure 4
Figure 4
Blood CXCR3+ CD4 T cells of antiretroviral therapy (ART)-treated aviremic HIV-1-infected individuals represent the major source of infectious HIV-1 in blood. (A) Proportion of HIV-1-infected individuals with detectable HIV-1 RNA (≥200 HIV-1 RNA copies/mL) in the in vitro HIV-1 infection assay. (B) Levels of HIV-1 RNA in blood memory CD4 T cell populations at day 14 of in vitro HIV-1 infection assay (N = 13). (C) Correlation between HIV-1 RNA levels measured in VOA and in in vitro HIV-1 infection assay in supernatants of blood memory CD4 T-cell populations (N = 13). Undetectable values were arbitrarily defined as 100 HIV-1 RNA copies/mL (B,C). Each individual is uniquely color coded in (B). Each CD4 T-cell population is uniquely colored in (C). Histograms correspond to mean (A,B); red bars correspond to SEM (B). “X3” corresponds to blood CXCR3-expressing CD4 T cells; “R4” corresponds to blood CCR4-expressing CD4 T cells; R4+R6+ corresponds to blood CCR4+CCR6+ CD4 T cells; “X5” corresponds to blood CXCR5-expressing CD4 T cells; And X3+X5+ corresponds to blood CXCR3+CXCR5+ CD4 T cells. Red stars indicate statistical significance (P < 0.05) (A,B). Statistical significance (P-values) was either obtained using two-tailed Chi-square analysis for comparison of positive proportions (A) or using one-way ANOVA (Kruskal–Wallis test) followed by Wilcoxon matched-pairs two-tailed signed rank test (B) or Spearman rank test for correlation (C).
Figure 5
Figure 5
Phylogenetic relationship of HIV-1 envelope sequences derived from CD4 T-cell populations. Sequences of the highly variable EnvV1V4 region (Hxb 6540-7668) were derived from blood and LN memory CD4 T-cell populations isolated from aviremic-treated HIV-1-infected individuals (N = 3). Virus quasi-species were amplified and sequenced [single molecule, real-time (SMRT) method/PacBio Systems]. (A) Phylogenetic relationship of HIV-1 envelope sequences derived from CD4 T-cell populations (N = 3). The phylogenetic relationship was inferred by the Maximum Likelihood method based on the General Time Reversible substitution model (GTR + G). Each tree includes reference sequences from subtype B and non-B HIV-1-infected individuals. (B) Nucleotide variations observed within each blood and LN memory CD4 T-cell population estimated using the Gama distributed kimura-two-parameter. CD4 T-cell populations were color coded (A,B). dc corresponds to the laboratory isolate control used to monitor sequence diversity induced by the method. “X3” corresponds to blood CXCR3-expressing CD4 T cells; “R4” corresponds to blood CCR4-expressing CD4 T cells; R4+R6+ corresponds to blood CCR4+CCR6+ CD4 T cells; “X5” corresponds to blood CXCR5-expressing CD4 T cells; And X3+X5+ corresponds to blood CXCR3+CXCR5+ CD4 T cells. “LN” corresponds to lymph node.
Figure 6
Figure 6
PD-1 expression on blood CXCR3+ CD4 T cells positively correlates with the levels of HIV-1 RNA produced in the virus outgrowth assay (VOA) culture supernatants. Percentage of expression of HLA-DR (A), Ki-67 (B), CXCR4 (C), CCR5 (D), SAMHD1 (E) on chemokine receptor expressing blood memory (CD45RA) CD4 T-cell populations isolated from aviremic long-term-treated HIV-1-infected individuals (N = 10). (F) Differentiation profile of chemokine receptor expressing blood memory (CD45RA) CD4 T-cell populations isolated from aviremic long-term-treated HIV-1-infected individuals (N = 10). Percentage of CD32+ (N = 7) (G) or PD-1+ (N = 10) (H) chemokine receptor expressing blood memory (CD45RA) CD4 T-cell populations isolated from aviremic long-term-treated HIV-1-infected individuals. (I) Correlation between HIV-1 RNA levels detected in day 14 VOA supernatants of chemokine receptor expressing blood memory CD4 T-cell populations and the percentage of PD-1-expressing CD4 T cells within each chemokine receptor expressing blood memory CD4 T-cell population. Undetectable values were arbitrarily defined as 10 HIV-1 RNA copies/mL (I). Red bars correspond to SEM (A–H). “X3” corresponds to blood CXCR3-expressing CD4 T cells; “R4” corresponds to blood CCR4-expressing CD4 T cells; R4+R6+ corresponds to blood CCR4+CCR6+ CD4 T cells; “X5” corresponds to blood CXCR5-expressing CD4 T cells; And X3+X5+ corresponds to blood CXCR3+CXCR5+ CD4 T cells. Each HIV-infected individual was color coded (A–H). Red stars indicate statistical significance (P < 0.05) (A–H). Statistical significance (P-values) was either obtained using one-way ANOVA (Kruskal–Wallis test) followed by Wilcoxon matched-pairs two-tailed signed rank test (A–H) or Spearman rank test for correlation (I).
Figure 7
Figure 7
Chemokine receptor expression on lymph node memory CD4 T cell populations of viremic HIV-infected individuals. Percentage of chemokine receptor expression on lymph nodes (LNs) CD4 T-cell populations of viremic HIV-infected individuals (N = 9). Red bars correspond mean ± SEM. CD4 T-cell populations were color coded. Red stars indicate statistical significance (P < 0.05). Statistical significance (P-values) was either obtained using one-way ANOVA (Kruskal–Wallis test) followed by Wilcoxon matched-pairs two-tailed signed rank test.

Similar articles

Cited by

References

    1. Rothenberger MK, Keele BF, Wietgrefe SW, Fletcher CV, Beilman GJ, Chipman JG, et al. Large number of rebounding/founder HIV variants emerge from multifocal infection in lymphatic tissues after treatment interruption. Proc Natl Acad Sci U S A (2015) 112:E1126–34. 10.1073/pnas.1414926112 - DOI - PMC - PubMed
    1. Fischer M, Hafner R, Schneider C, Trkola A, Joos B, Joller H, et al. HIV RNA in plasma rebounds within days during structured treatment interruptions. AIDS (2003) 17:195–9. 10.1097/00002030-200301240-00009 - DOI - PubMed
    1. Chun T-W, Stuyver L, Mizell SB, Ehler LA, Mican JA, Baseler M, et al. Presence of an inducible HIV-1 latent reservoir during highly active antiretroviral therapy. Proc Natl Acad Sci U S A (1997) 94:13193–7. 10.1073/pnas.94.24.13193 - DOI - PMC - PubMed
    1. Siliciano JD, Kajdas J, Finzi D, Quinn TC, Chadwick K, Margolick JB, et al. Long-term follow-up studies confirm the stability of the latent reservoir for HIV-1 in resting CD4+ T cells. Nat Med (2003) 9:727–8. 10.1038/nm880 - DOI - PubMed
    1. Van Lint C, Bouchat S, Marcello A. HIV-1 transcription and latency: an update. Retrovirology (2013) 10:1. 10.1186/1742-4690-10-67 - DOI - PMC - PubMed

Publication types