. 2018 Feb 5:9:158.
doi: 10.3389/fimmu.2018.00158. eCollection 2018.

Characteristics of Infection Immunity Regulated by Toxoplasma gondii to Maintain Chronic Infection in the Brain

Affiliations

Characteristics of Infection Immunity Regulated by Toxoplasma gondii to Maintain Chronic Infection in the Brain

Young Sang Hwang et al. Front Immunol. .

Abstract

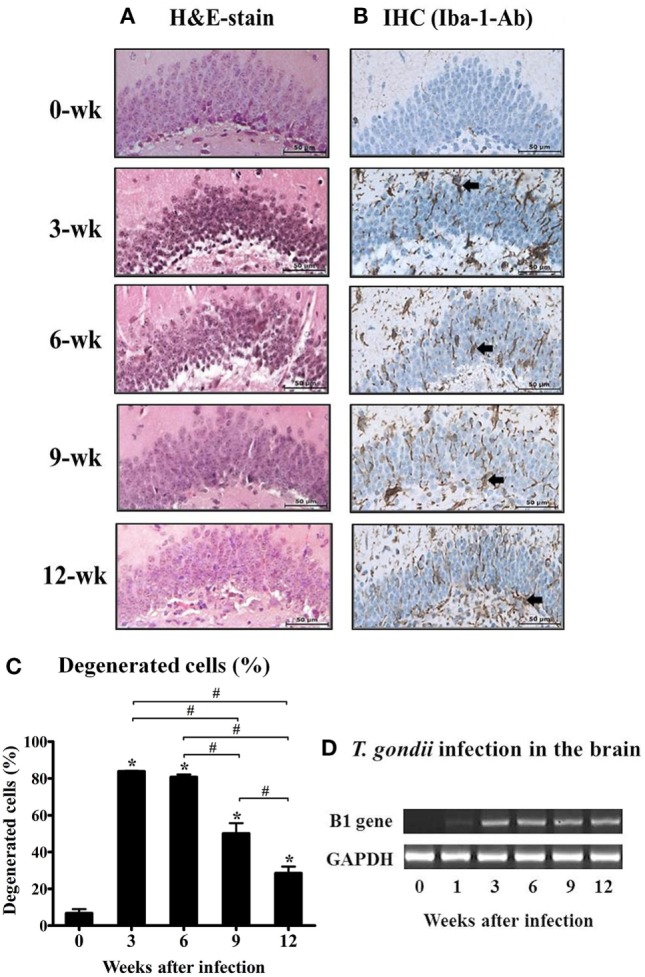
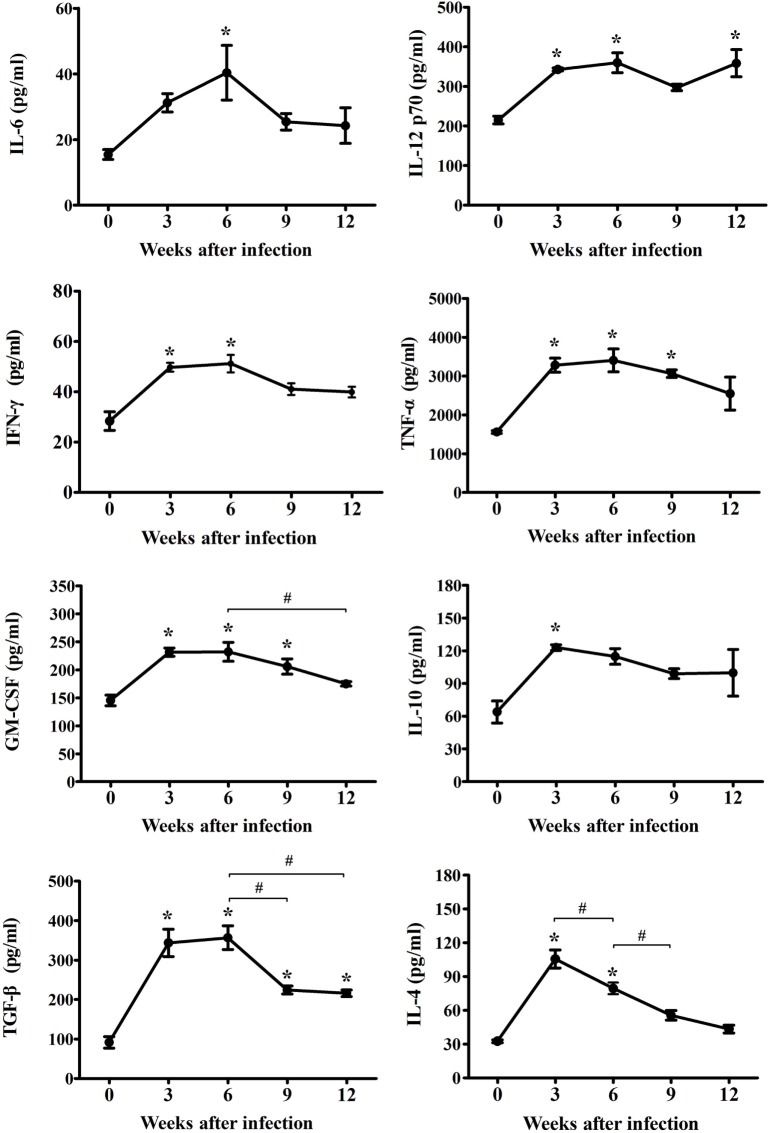
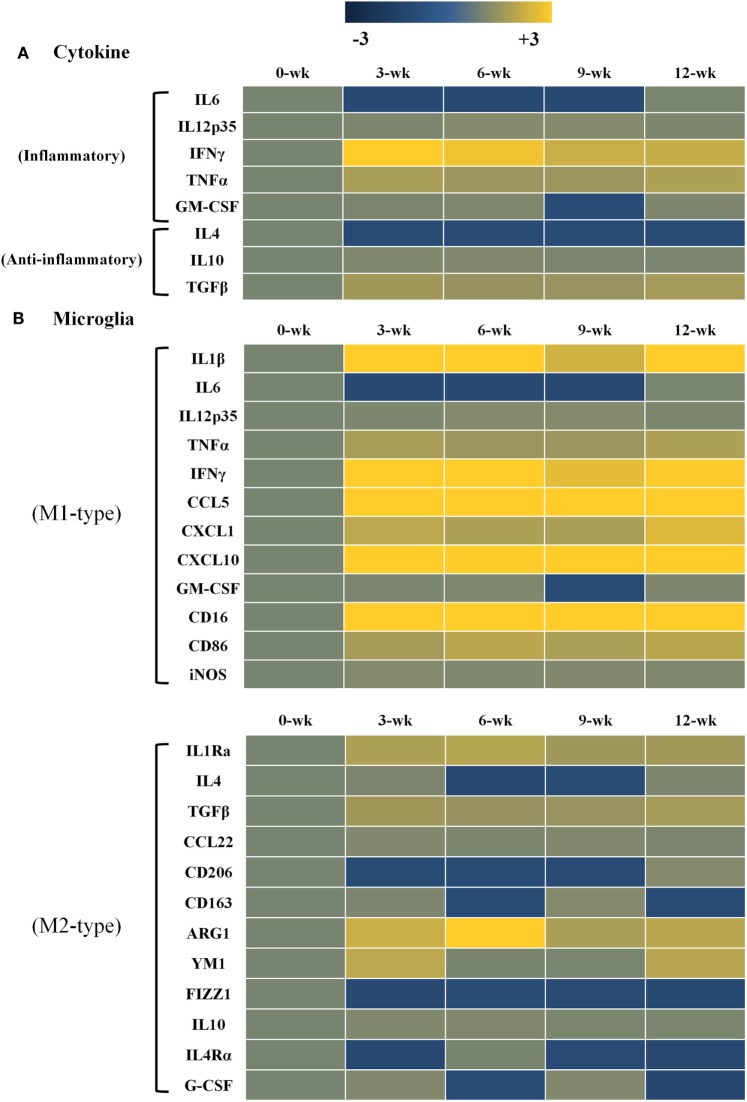
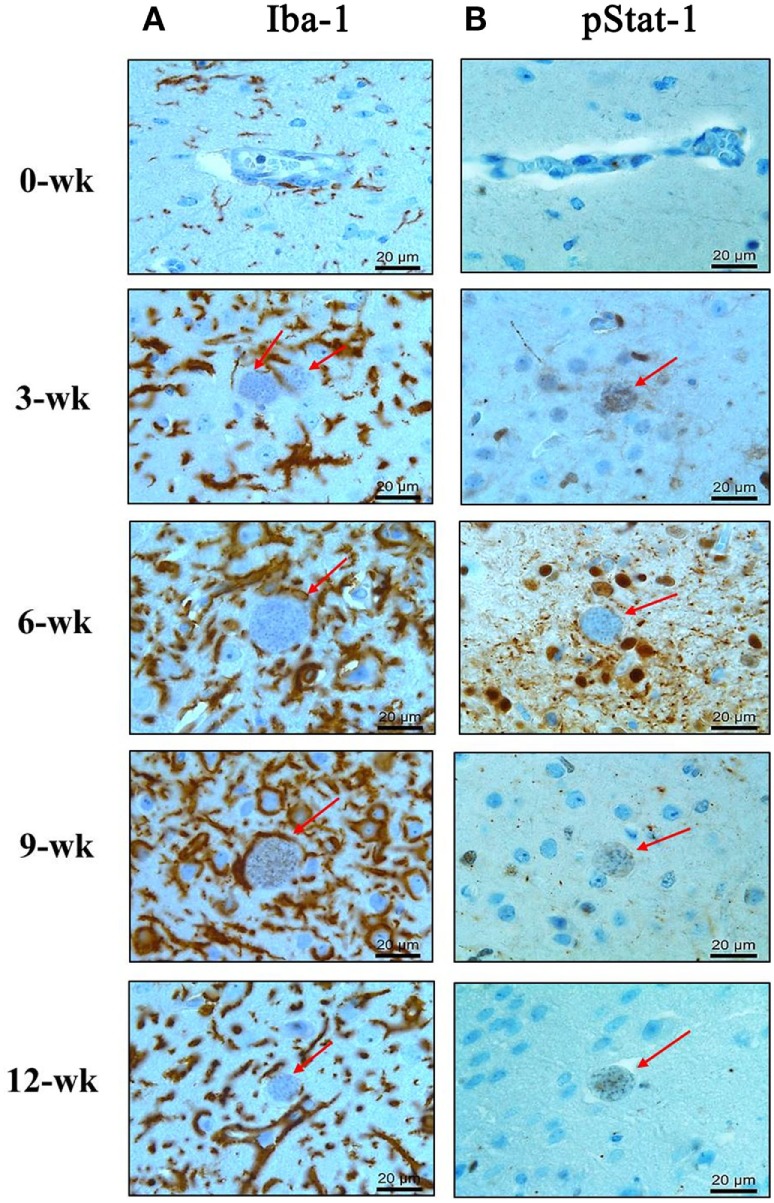
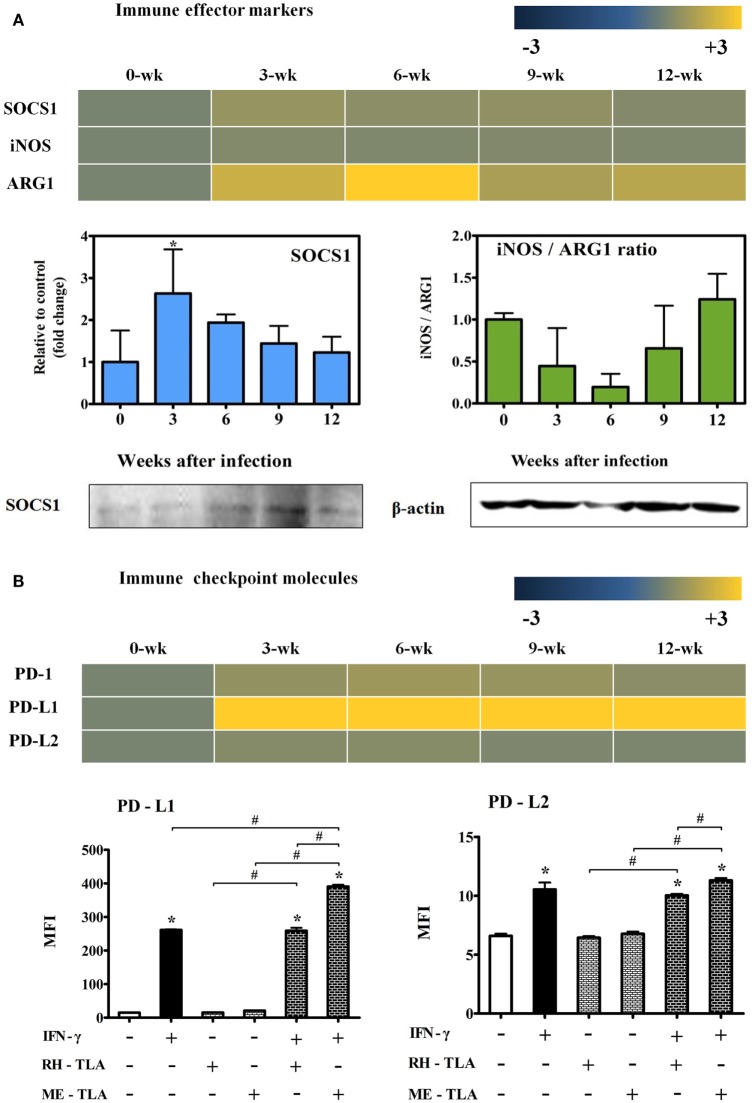
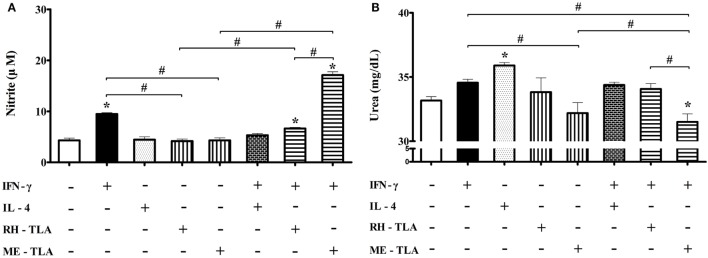
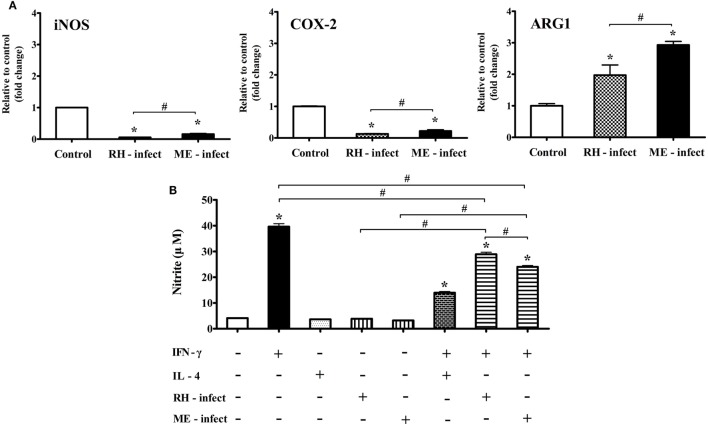
To examine the immune environment of chronic Toxoplasma gondii infection in the brain, the characteristics of infection-immunity (premunition) in infection with T. gondii strain ME49 were investigated for 12 weeks postinfection (PI). The results showed that neuronal cell death, microglia infiltration and activation, inflammatory and anti-inflammatory cytokine expression, Stat1 phosphorylation, and microglia activation and inflammatory gene transcripts related to M1 polarization in the brain were increased during the acute infection (AI) stage (within 6 weeks PI), suggesting that innate and cellular inflammatory response activation and neurodegeneration contributed to excessive inflammatory responses. However, these immune responses decreased during the chronic infection (CI) stage (over 6 weeks PI) with reductions in phosphorylated STAT1 (pSTAT1) and eosinophilic neurons. Notably, increases were observed in transcripts of T-cell exhaustion markers (TIM3, LAG3, KLRG1, etc.), suppressor of cytokines signaling 1 protein (SOCS1), inhibitory checkpoint molecules (PD-1 and PD-L1), and Arg1 from the AI stage (3 weeks PI), implying active immune intervention under the immune environment of M1 polarization of microglia and increases in inflammatory cytokine levels. However, when BV-2 microglia were stimulated with T. gondii lysate antigens (strain RH or ME49) in vitro, nitrite production increased and urea production decreased. Furthermore, when BV-2 cells were infected by T. gondii tachyzoites (strain RH or ME49) in vitro, nitric oxide synthase and COX-2 levels decreased, whereas Arg1 levels significantly increased. Moreover, Arg1 expression was higher in ME49 infection than in RH infection, whereas nitrite production was lower in ME49 infection than in RH infection. Accordingly, these results strongly suggest that immune triggering of T. gondii antigens induces M1 polarization and activation of microglia as well as increase NO production, whereas T. gondii infection induces the inhibition of harmful inflammatory responses, even with M1 polarization and activation of microglia and Th1 inflammatory responses, suggesting a host-parasite relationship through immune regulation during CI. This is a characteristic of infection immunity in infection with T. gondii in the central nervous system, and SOCS1, a negative regulator of toxoplasmic encephalitis, may play a role in the increase in Arg1 levels to suppress NO production.

Keywords: Toxoplasma gondii; brain; chronic infection; infection immunity; microglial polarization.


Figures

Figure 1
Figure 1
Changes in neuronal degeneration and proliferation of microglial cells in the hippocampal dentate gyrus during T. gondii infection. The brain tissues were harvested at 0, 3, 6, 9, and 12 weeks postinfection, and subjected to histological staining. (A) hematoxylin and eosin staining, 400×. (B) Immunohistochemistry (IHC) results of the brain tissue stained with Iba-1-antibody (brown color), 400×. Scale bar = 50 µm. (C) Degenerated cells in the brain tissues after T. gondii infection were counted and are expressed by percentage (%).* indicates significant difference compared with the control. # indicates significant difference between the experimental groups. (D) T. gondii-specific B1 gene expression and RT-PCR products were loaded into 1% agarose gels (98 bp).
Figure 2
Figure 2
Expression changes of cytokines in cerebral Toxoplasma gondii infection from the acute infection stage to the chronic infection stage. Brain tissues were harvested at 0, 3, 6, 9, and 12 weeks postinfection and analyzed for changes in cytokine levels due to infection. Levels of inflammatory cytokines [IL-6, IL-12p70, IFN-γ, tumor necrosis factor (TNF)-α, and granulocyte-macrophage colony-stimulating factor (GM-CSF)] and anti-inflammatory cytokines [IL-4, IL-10, and transforming growth factor-β (TGF-β)]. Cytokine levels are presented as the mean ± SD at each infection stage. *p < 0.05 (one-way analysis of variance). * indicates significant difference compared with the control. # indicates significant difference between the experimental groups.
Figure 3
Figure 3
Heat maps representing cytokine and chemokine concentrations in the inflammatory immune response and microglia phenotypes. Transcript levels of inflammatory and anti-inflammatory cytokines as well as microglia phenotype markers were measured in Toxoplasma gondii-infected mouse brains using microarray analysis. Each row of the heat map represents cytokines related with inflammatory and anti-inflammatory responses (A) as well as microglia phenotype markers related with the M1-type and M2-type (B). Each column represents infection times from week 0 to 12 postinfection. The color scale corresponds to the relative expression of the cytokine for the minimum (−3) and maximum (+3) of all values.
Figure 4
Figure 4
Phosphorylation of Stat1 (pStat1) and Iba-1-stained microglia infiltrated and activated around Toxoplasma gondii cysts. T. gondii-infected mouse brains were harvested at 0, 3, 6, 9, and 12 weeks postinfection, embedded in paraffin, and immunostained with Iba-1- (A) and phosphorylated Stat-1 antibodies (B). T. gondii cysts (arrow). Activated microglia [(A) brown color]. pStat1 immunoreactivity [(B) brown color]. Magnification, 400×. Scale bar = 20 µm.
Figure 5
Figure 5
Microglia activation in Toxoplasma gondii-infected brain and BV-2 cells stimulated with T. gondii lysate antigens (TLAs) (RH-TLA and ME-TLA). Expression levels of major histocompatibility complex II antigens (H2-Eb1, H2-Aa, and H2-Ab1), CD40, and CD86 by FACS analysis. (A) Heat map expression of cell surface markers related with microglia activation in T. gondii-infected brains, (B) results are expressed as the mean ± SD of the mean fluorescence intensity. *p < 0.05 (one-way analysis of variance). * indicates significant difference compared with the control. # indicates significant difference between the experimental groups.
Figure 6
Figure 6
Changes in T-cell differentiation (A) and exhaustion (B) markers in Toxoplasma gondii-infected brain tissues. Expression values represent the intensity of gene expression varying from −3 to +3 colored with blue or yellow.
Figure 7
Figure 7
Changes in immune effector and checkpoint molecules. Transcripts of immune effector markers [nitric oxide synthase (iNos) and Arg1] (A), immune control marker (Socs1) (A) and immune checkpoint markers (PD-1, PD-L1 and PD-L2) (B). RT-PCR results (SOCS1 and the iNos/Arg1 ratio) and western blot (SOCS1 and β-actin) (A). Transcript expressions(PD-1, PD-L1, and PD-L2) and FACS analysis (PD-L1 and PD-L2) (B). Results are expressed as the mean ± SD of the mean fluorescence intensity (MFI). *p < 0.05 (one-way analysis of variance). * indicates significant difference compared with the control. # indicates significant difference between the experimental groups.
Figure 8
Figure 8
Nitrite and urea production in BV-2 microglia stimulated with recombinant cytokines affecting microglia polarization (IFN-γ and IL-4) or Toxoplasma gondii antigens (RH-TLA or ME-TLA). Nitrite (μM) (A) and urea (mg/dL) concentrations (B). Data are presented as the mean ± SD. *p < 0.05 (one-way analysis of variance). * indicates significant difference compared with the control. # indicates significant difference between the experimental groups.
Figure 9
Figure 9
mRNA levels of nitric oxide synthase (iNos), Cox-2, and Arg1, and nitrite production in Toxoplasma gondii-infected BV-2 microglial cells. (A) RT-PCR analysis of iNos, Cox-2, and Arg1 in T. gondii tachyzoites (strains RH and ME49)-infected BV-2 cells. (B) Nitrite concentration (μM) in culture supernatant treated with recombinant IFN-γ and/or IL-4, and/or T. gondii tachyzoites. Data are presented as the mean ± SD. *p < 0.05 (one-way analysis of variance). * indicates significant difference compared with the control. # indicates significant difference between the experimental groups.

Similar articles

Cited by

References

    1. Wohlfert EA, Blader IJ, Wilson EH. Brains and Brawn: Toxoplasma infections of the central nervous system and skeletal muscle. Trends Parasitol (2017) 33:519–31.10.1016/j.pt.2017.04.001 - DOI - PMC - PubMed
    1. Mordue DG, Monroy F, La Regina M, Dinarello CA, Sibley LD. Acute toxoplasmosis leads to lethal overproduction of Th1 cytokines. J Immunol (2001) 167:4574–84.10.4049/jimmunol.167.8.4574 - DOI - PubMed
    1. Jensen KD, Wang Y, Wojno ED, Shastri AJ, Hu K, Cornel L, et al. Toxoplasma polymorphic effectors determine macrophage polarization and intestinal inflammation. Cell Host Microbe (2011) 9:472–83.10.1016/j.chom.2011.04.015 - DOI - PMC - PubMed
    1. Rozenfeld C, Martinez R, Seabra S, Sant’anna C, Goncalves JG, Bozza M, et al. Toxoplasma gondii prevents neuron degeneration by interferon-gamma-activated microglia in a mechanism involving inhibition of inducible nitric oxide synthase and transforming growth factor-beta1 production by infected microglia. Am J Pathol (2005) 167:1021–31.10.1016/S0002-9440(10)61191-1 - DOI - PMC - PubMed
    1. Suzuki Y. Host resistance in the brain against Toxoplasma gondii. J Infect Dis (2002) 185(Suppl 1):S58–65.10.1086/337999 - DOI - PubMed

Publication types

MeSH terms