. 2018 Feb 5:9:83.
doi: 10.3389/fpls.2018.00083. eCollection 2018.

Mapping Late Leaf Spot Resistance in Peanut (Arachis hypogaea) Using QTL-seq Reveals Markers for Marker-Assisted Selection

Affiliations

Mapping Late Leaf Spot Resistance in Peanut (Arachis hypogaea) Using QTL-seq Reveals Markers for Marker-Assisted Selection

Josh Clevenger et al. Front Plant Sci. .

Abstract

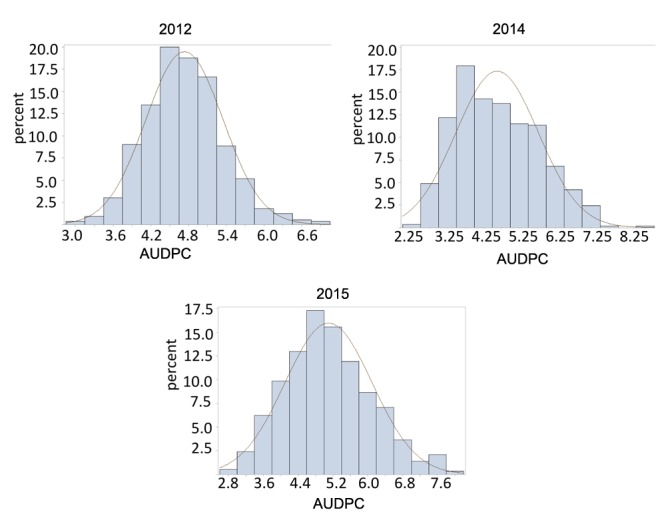
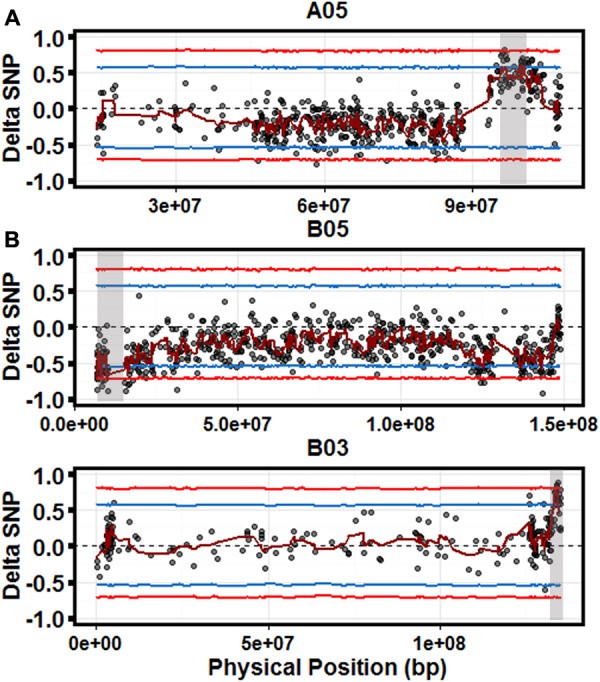
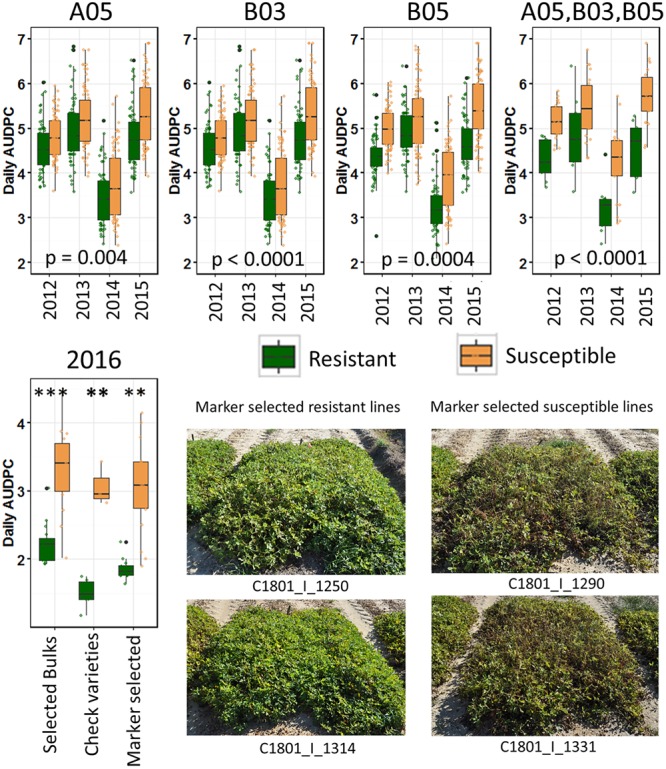
Late leaf spot (LLS; Cercosporidium personatum) is a major fungal disease of cultivated peanut (Arachis hypogaea). A recombinant inbred line population segregating for quantitative field resistance was used to identify quantitative trait loci (QTL) using QTL-seq. High rates of false positive SNP calls using established methods in this allotetraploid crop obscured significant QTLs. To resolve this problem, robust parental SNPs were first identified using polyploid-specific SNP identification pipelines, leading to discovery of significant QTLs for LLS resistance. These QTLs were confirmed over 4 years of field data. Selection with markers linked to these QTLs resulted in a significant increase in resistance, showing that these markers can be immediately applied in breeding programs. This study demonstrates that QTL-seq can be used to rapidly identify QTLs controlling highly quantitative traits in polyploid crops with complex genomes. Markers identified can then be deployed in breeding programs, increasing the efficiency of selection using molecular tools. Key Message: Field resistance to late leaf spot is a quantitative trait controlled by many QTLs. Using polyploid-specific methods, QTL-seq is faster and more cost effective than QTL mapping.

Keywords: Arachis; QTL-seq; late leaf spot; polyploidy; resistance.


Figures

FIGURE 1
FIGURE 1
Phenotype distribution of Area under disease progress curve (AUDPC) for late leaf spot (LLS) disease. The normal distribution curve in the graph represented the expected percentage of recombinant inbred line (RILs) with respect to disease score range.
FIGURE 2
FIGURE 2
Quantitative trait loci (QTL)-seq identifies significant QTL for controlling LLS resistance. Scatter plots for chromosomes A05 (top), B05 (middle), and B03 (bottom). Each graph is a scatter plot of each ΔSNP (R-Bulk SNP Index–S-Bulk SNP Index) plotted against the physical position based on the A. duranensis (A) and A. ipaensis (B) pseudomolecules. The dark red line represents a sliding window of 2 Mb moving 500 kb intervals. Statistical confidence intervals under the null hypothesis of no QTL are plotted for each marker (blue – p < 0.05 and red – p < 0.01). Gray shaded boxes indicate significant QTL.
FIGURE 3
FIGURE 3
Validation of identified resistance QTL. (Top) Lines with putative ‘resistant’ alleles and ‘susceptible’ alleles were selected in the RIL population and tested against each other across years with a Kruskal Wallis test. From left to right selected only with marker on A05, B03, or B05, and with all three markers (Top right). (Bottom) Validation test in 2016. Lines selected for bulks, resistant and susceptible check varieties, and lines blindly selected with the three identified markers were grown in an unsprayed test in a completely randomized design with three replicates each of two-row/1.524 m plots. Within each category, asterisks indicate significance by a Kruskal–Wallis test (∗∗∗p < 0.001; ∗∗p < 0.01). (Bottom right) Plots of two lines selected for resistance alleles and two lines selected for susceptibility alleles with three markers.
FIGURE 4
FIGURE 4
Read depth affects null distribution estimation. A null distribution was generated for each read depth by taking the average and standard deviation of 1,000 runs of the top and bottom 5% (p < 0.05) and 1% (p < 0.01) of 1,000 simulations for each run.

References

    1. Bertioli D., Cannon S. B., Froenicke L., Huang G., Farmer A. D., Cannon E. K., et al. (2016). The genome sequences of Arachis duranensis and Arachis ipaensis, the diploid ancestors of cultivated peanut. Nat. Genet. 48 438–446. 10.1038/ng.3517 - DOI - PubMed
    1. Chiteka Z., Gorbet D. W., Shokes F. M., Kucharek T. A., Knauft D. A. (1988). Components of resistance to late leaf spot in peanut. Peanut Sci. 15 25–30. 10.3146/i0095-3679-15-1-8 - DOI
    1. Clevenger J., Bertioli D. J., Leal-Bertioli S. C. M., Chu Y., Stalker H. T., Ozias-Akins P. (2017). IntroMap: a pipeline and set of diagnostic diploid Arachis SNPs as a tool for mapping alien introgressions in Arachis hypogaea. Peanut Sci. 44 66–73. 10.3146/PS17-5.1 - DOI
    1. Clevenger J., Chu Y., Chavarro C., Agarwal G., Bertioli D. J., Leal-Bertioli S. C., et al. (2016). Genome-wide SNP genotyping resolves signatures of selection and tetrasomic recombination in peanut. Mol. Plant 10 309–322. 10.1016/j.molp.2016.1011.1015 - DOI - PMC - PubMed
    1. Clevenger J., Ozias-Akins P. (2015). SWEEP: a tool for filtering high-quality SNPs in polyploid crops. G3 5 1797–1803. 10.1534/g3.115.019703 - DOI - PMC - PubMed

LinkOut - more resources