. 2018 Mar 1;10(9):4488-4499.
doi: 10.1039/c7nr07777g.

Quantifying atom-scale dopant movement and electrical activation in Si:P monolayers

Affiliations

Quantifying atom-scale dopant movement and electrical activation in Si:P monolayers

Xiqiao Wang et al. Nanoscale. .

Abstract

Advanced hydrogen lithography techniques and low-temperature epitaxial overgrowth enable the patterning of highly phosphorus-doped silicon (Si:P) monolayers (ML) with atomic precision. This approach to device fabrication has made Si:P monolayer systems a testbed for multiqubit quantum computing architectures and atomically precise 2-D superlattice designs whose behaviors are directly tied to the deterministic placement of single dopants. However, dopant segregation, diffusion, surface roughening, and defect formation during the encapsulation overgrowth introduce large uncertainties to the exact dopant placement and activation ratio. In this study, we develop a unique method by combining dopant segregation/diffusion models with sputter profiling simulation to monitor and control, at the atomic scale, dopant movement using room-temperature grown locking layers (LLs). We explore the impact of LL growth rate, thickness, rapid thermal annealing, surface accumulation, and growth front roughness on dopant confinement, local crystalline quality, and electrical activation within Si:P 2-D systems. We demonstrate that dopant movement can be more efficiently suppressed by increasing the LL growth rate than by increasing the LL thickness. We find that the dopant segregation length can be suppressed below a single Si lattice constant by increasing the LL growth rates at room temperature while maintaining epitaxy. Although dopant diffusivity within the LL is found to remain high (on the order of 10-17 cm2 s-1) even below the hydrogen desorption temperature, we demonstrate that exceptionally sharp dopant confinement with high electrical quality within Si:P monolayers can be achieved by combining a high LL growth rate with low-temperature LL rapid thermal annealing. The method developed in this study provides a key tool for 2-D fabrication techniques that require precise dopant placement to suppress, quantify, and predict a single dopant's movement at the atomic scale.


Conflict of interest statement

Conflicts of interest

There are no conflicts of interest to declare.

Figures

Fig. 1
Fig. 1
STM topography images (+2 V bias on substrate, 0.2 nA set-point current, 25 nm × 25 nm, acquired from different samples at different stages of preparation) with complementary atomic lattice top and side view schematics of the phosphine dosing, incorporation, and encapsulation processes on a blanket Si(100) 2 × 1 surface. In the schematic figures, the blue and cyan atoms represent Si on the surface and in bulk, respectively. Red atoms represent P, and orange atoms represent H. (a) A typical starting Si(100) surface with a 2 × 1-dimer row reconstruction and the characteristic alternating dimer rows across a step edge. (b) The Si(100) surface covered with ~0.37 monolayers of adsorbed PHx (x = 0, 1, 2) groups after saturation dosing (approximately 1.5 Langmuir exposure) at room temperature. (c) The surface after an incorporation flash anneal with the brighter regions being islands formed by ejected (substituted) Si atoms. Since the ejected Si should be in one to one correspondence with incorporated P atoms, the ejected Si island coverage represents the incorporated P concentration.,, (d) The growth front morphology of a nominal 274 °C overgrowth on top of the P-incorporated surface. The overgrowth is in the kinetically rough growth mode due to limited Si adatom migration on the growth front. Though it is difficult to distinguish P atoms on a rough growth front, as shown in the side view schematics (bottom panel), the incorporated P atoms segregate above the original doping plane during the 274 °C overgrowth, which broadens the delta layer.
Fig. 2
Fig. 2
The process flow diagram of the delta layer fabrication procedures illustrating the timing and temperature at each step of the process. The blue box highlights the steps that were systematically varied in this study: the locking layer (LL) overgrowth varies from 0ML to 16ML with or without a subsequent LL Rapid Thermal Anneal (RTA) at 384 °C for 14 s. The red line represents the thermal profile as a function of time.
Fig. 3
Fig. 3
Top panels: STM topography images (+2 V bias on sample, 0.2 nA set-point current) of various LL surfaces before low temperature encapsulation. Bottom panels: High-resolution cross section TEM/STEM micrographs near the LL interface regions after LL deposition and low temperature encapsulation overgrowth. The locking layer growth conditions (thickness, growth rate, and rapid thermal anneal (RTA)) and the subsequent encapsulation overgrowth are marked in the graphs. The red arrows in TEM/STEM images indicate the LL interfaces.
Fig. 4
Fig. 4
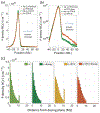
Reconstruction of the physical dopant concentration profiles from SIMS measurements. 1 keV and 0.3 keV primary ion beam energies are used for SIMS measurements on the individual LL sample (see Sample LL-T3 in Table 1). (a) The atomic mixing length (w) depends critically on the primary ion beam energy and is obtained by fitting the trailing edge of the measured SIMS profile M(x). (The fitted w lines are shifted to avoid masking the data points.) (b) The SIMS data and the fitted SIMS results M(x) are plotted as data points and solid curves. We intentionally shift the zero position of the measured SIMS profile peaks for comparison purposes. (c) The reconstructed concentration depth profiles N(x) are plotted in bars. Each bar represents 1 ML. (d) Comparison between the reconstructed P concentration profile N(x) and the atom probe tomography (APT) result.
Fig. 5
Fig. 5
The effect of locking layer (LL) thickness on delta layer confinement and electrical properties. All locking layers are grown at 0.6 ML min−1 at room temperature with no LL RTA. (a) The measured and fitted SIMS concentration profiles of LL samples with different LL thicknesses (see Samples LL-T0, LL-T1, LL-T2, LL-T3, and LL-T4 in Table 1). (b) The reconstructed P concentration profiles. (c) The delta layer free carrier mobility μ (cm2 (V s)−1) and 2D sheet carrier density ns (cm−2) are characterized at T = 2 K using the van der Pauw technique. (d) The total and activated P locking probability 1 nm and 2 nm from the initial dosing plane as a function of LL thickness.
Fig. 6
Fig. 6
The locking layer (LL) rapid thermal anneal (RTA) effect on dopant redistribution in Samples LL-R1 and LL-R1-RTA. (a, b) The measured and fitted SIMS profiles. Sample LL-R1 has an 11 ML LL grown at 1.1 ML min−1 at room temperature without RTA. Sample LL-R1-RTA has the same RT-grown LL followed by a 384 °C RTA for 14 seconds before low temperature encapsulation overgrowth. (c)The reconstructed P concentration profiles before and after low temperature encapsulation overgrowth in Sample LL-R1 (left two panels) and Sample LL-R1-RTA (right two panels).
Fig. 7
Fig. 7
The fitted P segregation length (lLL) of room-temperature grown locking layer at different growth rates.
Fig. 8
Fig. 8
The effect of locking layer (LL) growth rate on delta layer confinement and electrical properties. (a, b) Measured and fitted SIMS concentration profiles of samples with different LL growth rates. Samples LL-T3 and LL-R1 in (a) do not have a LL RTA. Samples LL-R1-RTA and LL-R2 RTA in (b) have a LL RTA. (c) The reconstructed P concentration profiles. (d) The total and activated P locking probability within 1 nm and 2 nm from the initial dosing plane as a function of LL thickness. (e) The delta layer free carrier mobility μ (cm2 (V s)−1) and 2D sheet carrier density ns (cm−2) are characterized at T = 2 K using the van der Pauw technique.

References

    1. Lee S, Ryu H, Campbell H, Hollenberg LCL, Simmons MY and Klimeck G, Phys. Rev. B: Condens. Matter Mater. Phys, 2011, 84, 205309.
    1. Fuechsle M, Miwa JA, Mahapatra S, Ryu H, Lee S, Warschkow O, Hollenberg LCL, Klimeck G and Simmons MY, Nat. Nanotechnol, 2012, 7, 242–246. - PubMed
    1. Hwang EH and Das Sarma S, Phys. Rev. B: Condens. Matter Mater. Phys, 2013, 87, 125411.
    1. Roy S and Asenov A, Science, 2005, 309, 388–390. - PubMed
    1. Zwanenburg FA, Dzurak AS, Morello A, Simmons MY, Hollenberg LCL, Klimeck G, Rogge S, Coppersmith SN and Eriksson MA, Rev. Mod. Phys, 2013, 85, 961–1019.

LinkOut - more resources