

Differential Protein Dynamics of Regulators of G-Protein Signaling: Role in Specificity of Small-Molecule Inhibitors
- PMID: 29460621
- PMCID: PMC6309336
- DOI: 10.1021/jacs.7b13778
Differential Protein Dynamics of Regulators of G-Protein Signaling: Role in Specificity of Small-Molecule Inhibitors
Abstract
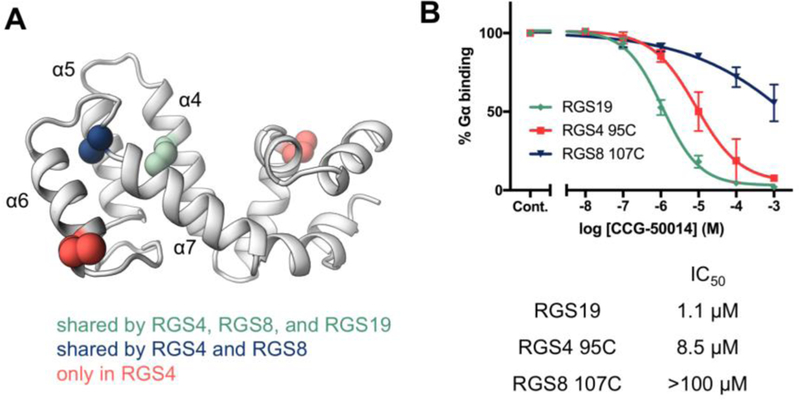
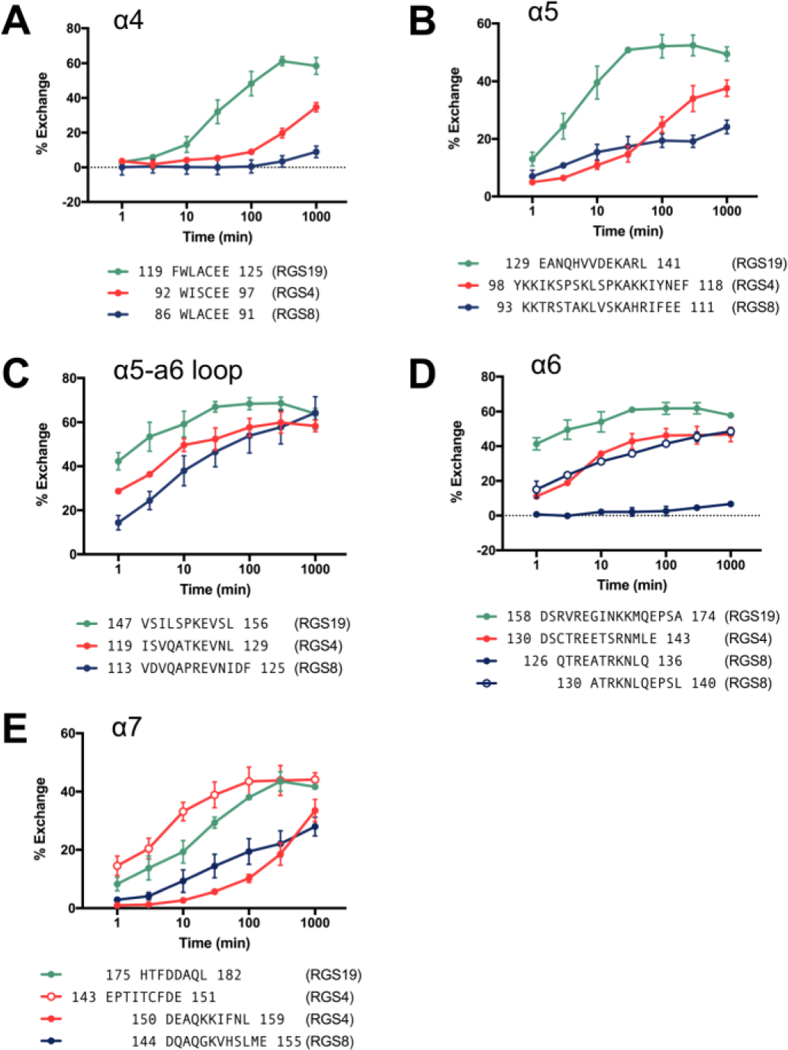
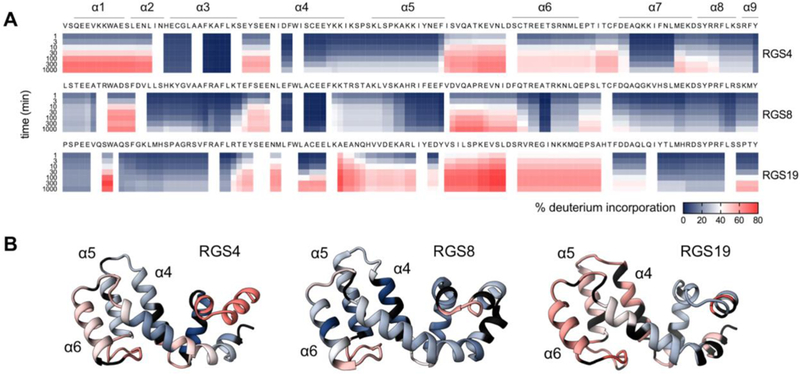
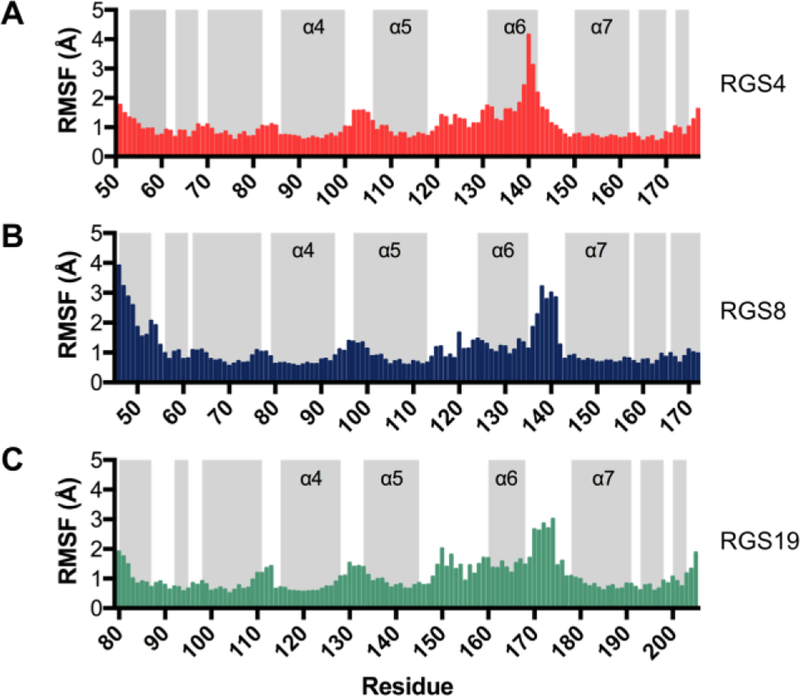
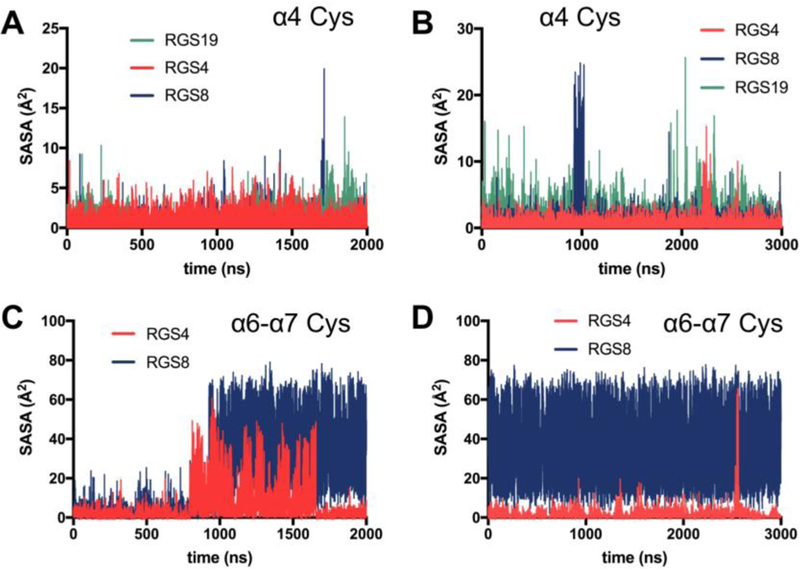
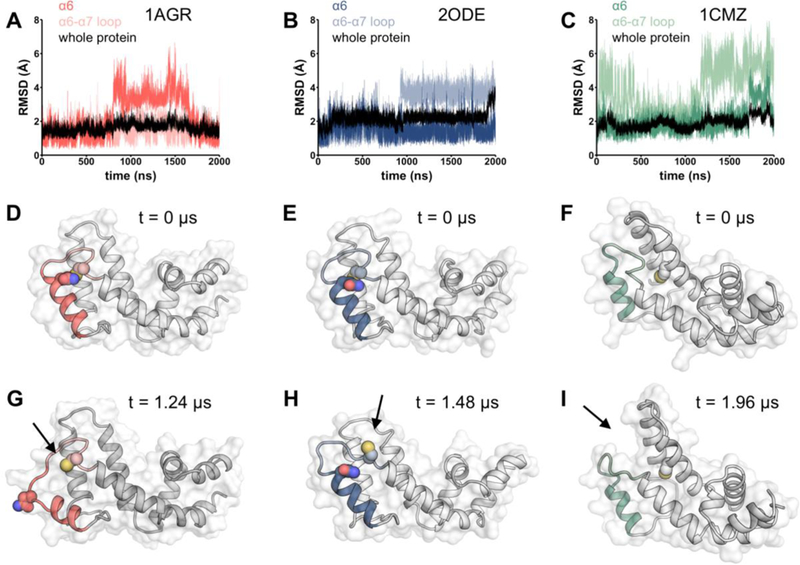
Small-molecule inhibitor selectivity may be influenced by variation in dynamics among members of a protein family. Regulator of G-protein Signaling (RGS) proteins are a family that plays a key role in G-Protein Coupled Receptor (GPCR) signaling by binding to active Gα subunits and accelerating GTP hydrolysis, thereby terminating activity. Thiadiazolidinones (TDZDs) inhibit the RGS-Gα interaction by covalent modification of cysteine residues in RGS proteins. Some differences in specificity may be explained by differences in the complement of cysteines among RGS proteins. However, key cysteines shared by RGS proteins inhibited by TDZDs are not exposed on the protein surface, and differences in potency exist among RGS proteins containing only buried cysteines. We hypothesize that differential exposure of buried cysteine residues among RGS proteins partially drives TDZD selectivity. Hydrogen-deuterium exchange (HDX) studies and molecular dynamics (MD) simulations were used to probe the dynamics of RGS4, RGS8, and RGS19, three RGS proteins inhibited at a range of potencies by TDZDs. When these proteins were mutated to contain a single, shared cysteine, RGS19 was found to be most potently inhibited. HDX studies revealed differences in α4 and α6 helix flexibility among RGS isoforms, with particularly high flexibility in RGS19. This could cause differences in cysteine exposure and lead to differences in potency of TDZD inhibition. MD simulations of RGS proteins revealed motions that correspond to solvent exposure observed in HDX, providing further evidence for a role of protein dynamics in TDZD selectivity.
Conflict of interest statement
No competing financial interests have been declared.
Figures
References
-
- Whitty A; Kumaravel G Nat. Chem. Biol 2006, 2 (3), 112–118. - PubMed
-
- Jin L; Wang W; Fang G Annu. Rev. Pharmacol. Toxicol 2014, 54 (1), 435–456. - PubMed
-
- Stank A; Kokh DB; Fuller JC; Wade RC Acc. Chem. Res 2016, 49 (5), 809–815. - PubMed
-
- Oleinikovas V; Saladino G; Cossins BP; Gervasio FL J. Am. Chem. Soc 2016, 138 (43), 14257–14263. - PubMed
Publication types
MeSH terms
Substances
Grants and funding
LinkOut - more resources
Full Text Sources
Other Literature Sources
Molecular Biology Databases
