. 2018 Feb 20:7:e33065.
doi: 10.7554/eLife.33065.

Impact of the scale-up of piped water on urogenital schistosomiasis infection in rural South Africa

Affiliations

Impact of the scale-up of piped water on urogenital schistosomiasis infection in rural South Africa

Frank Tanser et al. Elife. .

Abstract

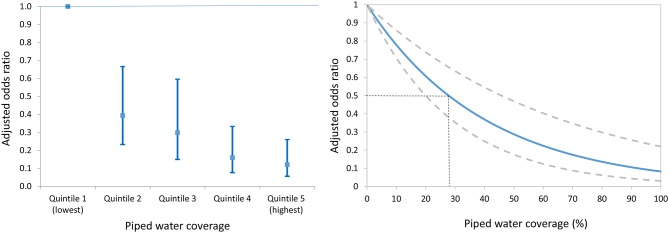
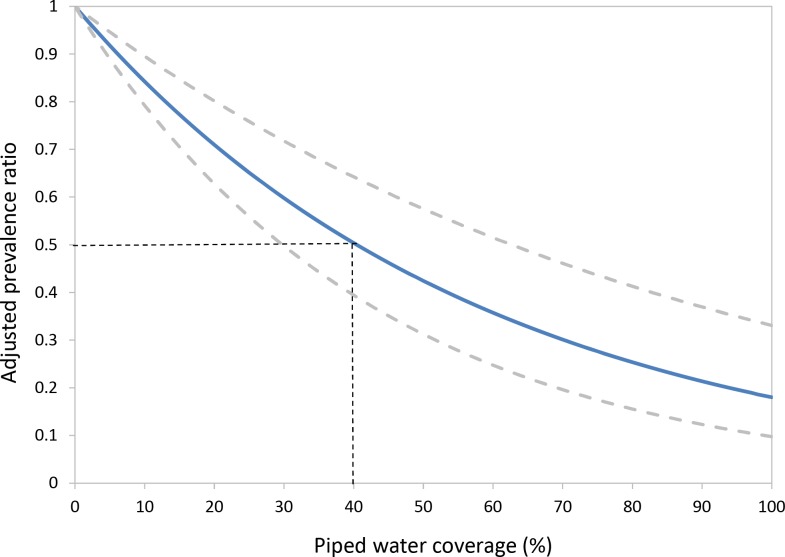
Recent work has estimated that sub-Saharan Africa could lose US$3.5 billion of economic productivity every year as a result of schistosomiasis and soil-transmitted helminthiasis. One of the main interventions to control schistosomiasis is the provision of safe water to limit the contact with infected water bodies and break the cycle of transmission. To date, a rigorous quantification of the impact of safe water supplies on schistosomiasis is lacking. Using data from one of Africa's largest population-based cohorts, we establish the impact of the scale-up of piped water in a typical rural South African population over a seven-year time horizon. High coverage of piped water in the community decreased a child's risk of urogenital schistosomiasis infection eight-fold (adjusted odds ratio = 0.12, 95% CI 0.06-0.26, p<0.001). The provision of safe water could drive levels of urogenital schistosomiasis infection to low levels of endemicity in rural African settings.

Keywords: Africa; epidemiology; global health; human; infectious disease; microbiology; sanitation; spatial analysis; urogenital schistosomiasis; water.


Conflict of interest statement

FT, DA, AV, TB, CA No competing interests declared

Figures

Figure 1.
Figure 1.. Prevalence (95% CI) of Schistosoma haematobium infection by age and sex among children taking part in the parasitological survey (N = 2,105).
Darker colours represent heavy infections (≥50 eggs per 10 ml urine).
Figure 2.
Figure 2.. Geographical variations in Schistosoma haematobium prevalence across the surveillance area obtained by a Gaussian kernel applied to participants’ precise household locations.
Approximate locations of participants’ households are shown (incorporating an intentional random error) with white dots representing an infected child. Superimposed on the map are the clusters of infection independently identified by the Kulldorff spatial scan statistic (cluster 5, low relative-risk; cluster 1–4, high relative-risk). The National Road can be seen running along the Eastern boundary of the surveillance area towards Mozambique.
Figure 3.
Figure 3.. Time series of maps showing the coverage of piped water (%) between 2001 and 2007 in the study area (as measured using a Gaussian kernel approach) as well as mean piped water coverage over the full study period (bottom right).
Main roads are superimposed.
Figure 4.
Figure 4.. Adjusted odds ratio of Schistosoma haematobium infection (95% CI) by piped water coverage in the surrounding local community - coverage quintile (Left) and continuous piped water coverage (Right).
The piped water coverage measure (2001–2007) is derived using a Gaussian kernel to calculate the proportion of all households in the unique local community surrounding each participant having access to piped water (Figure 3). Odds ratios are adjusted for age, sex, household assets, toilet in household, landcover class, distance to water body, altitude, slope, treatment in the last 12 months and school grade. Standard errors are adjusted for clustering by school and grade.
Figure 4—figure supplement 1.
Figure 4—figure supplement 1.. Results of a parallel analysis using a Poisson regression.
The graph shows the adjusted prevalence ratio (95% CI) by piped water coverage in the surrounding local community. The piped water coverage measure (2001–2007) is derived using a Gaussian kernel to calculate the proportion of all households in the unique local community surrounding each participant having access to piped water (Figure 3). The resulting risk estimates are adjusted for age, sex, household assets, toilet in household, landcover class, distance to water body, altitude, slope, treatment in the last 12 months and school grade. Standard errors are adjusted for clustering by school and grade.
Figure 5.
Figure 5.. Comparison of adjusted odds of Schistosoma haematobium infection (95% CI) in participants living in households with access to piped water (relative to participants without household-access to piped water) by sex.
The resulting risk estimates are adjusted for age, household assets, toilet in household, landcover class, distance to water body, altitude, slope, treatment in the last 12 months and school grade. Standard errors are adjusted for clustering by school and grade.
Figure 6.
Figure 6.. Forest plot of Schistosoma haematobium infection according to household/individual level access to a safe water.
The data are taken from Grimes et al. systematic review (Grimes et al., 2014), based on 17 data-points (Abou-Zeid et al., 2012; Al-Waleedi et al., 2013; Awoke et al., 2013; Dame et al., 2006; Dawet, 2012; Farooq et al., 1966; Howarth et al., 1988; Knopp et al., 2013; Nworie et al., 2012; Reuben et al., 2013; Sady et al., 2013) to which we have added our study results. The sizes of the squares represent the weight given to each study, the rhombus is the effect-size with the black lines representing the 95% confidence intervals. The overall rhombus represents the combined effect-size, with the results of this study shown in red.
Figure 7.
Figure 7.. Location of the study area in South Africa.
Figure 8.
Figure 8.. Environmental control variables used in the statistical analysis with locations of 33 schools superimposed (yellow diamonds).
(Top left) Altitude in metres above sea level (MASL) (Top right) Distance to nearest water body (km) (Bottom left) Slope (degrees) (Bottom right) Satellite-derived landcover classification.

References

    1. Abou-Zeid AH, Abkar TA, Mohamed RO. Schistosomiasis and soil-transmitted helminths among an adult population in a war affected area, Southern Kordofan state, Sudan. Parasites & Vectors. 2012;5:133. doi: 10.1186/1756-3305-5-133. - DOI - PMC - PubMed
    1. Al-Waleedi AA, El-Nimr NA, Hasab AA, Bassiouny HK, Al-Shibani LA. Urinary schistosomiasis among schoolchildren in Yemen: prevalence, risk factors, and the effect of a chemotherapeutic intervention. The Journal of the Egyptian Public Health Association. 2013;88:130–136. doi: 10.1097/01.EPX.0000441277.96615.96. - DOI - PubMed
    1. Anderson RM, Turner HC, Farrell SH, Yang J, Truscott JE. What is required in terms of mass drug administration to interrupt the transmission of schistosome parasites in regions of endemic infection? Parasites & Vectors. 2015;8:553. doi: 10.1186/s13071-015-1157-y. - DOI - PMC - PubMed
    1. Angrist JD, Imbens GW, Rubin DB. Identification of causal effects using instrumental variables. Journal of the American Statistical Association. 1996;91:444–455. doi: 10.1080/01621459.1996.10476902. - DOI
    1. Appleton CC, Kvalsvig JD. A school-based helminth control programme successfully implemented in KwaZulu-Natal. Southern African Journal of Epidemiology and Infection. 2006;21:55–67. doi: 10.1080/10158782.2006.11441265. - DOI

Publication types