

Repeatability of Monocular Acuity Testing in Adults with and without Down Syndrome
- PMID: 29461409
- PMCID: PMC5822740
- DOI: 10.1097/OPX.0000000000001185
Repeatability of Monocular Acuity Testing in Adults with and without Down Syndrome
Erratum in
-
Erratum.Optom Vis Sci. 2018 Jun;95(6):554. doi: 10.1097/OPX.0000000000001233. Optom Vis Sci. 2018. PMID: 29851862 Free PMC article. No abstract available.
Abstract
Purpose: Individuals with Down syndrome may experience greater difficulty reliably performing visual acuity (VA) tests because of intellectual disability and limitations in visual quality. This study evaluated the repeatability of acuity (Bailey-Lovie [BL] and HOTV) in subjects with and without Down syndrome.
Methods: High-contrast VA was measured in both eyes of 30 subjects with Down syndrome (mean, 30 years; range, 18 to 50 years) and 24 control subjects without Down syndrome (mean, 29 years; range, 18 to 50 years). In the Down syndrome group, 23 subjects performed BL, and 7 subjects performed HOTV. All control subjects performed both BL and HOTV, but for HOTV analysis, only seven age-matched control subjects were included. For each eye, subjects performed VA three times on different charts (computer controlled, single-line display) until five total letters were missed on each chart. A repeated-measure ANOVA was used to compare the acuity measures between groups.
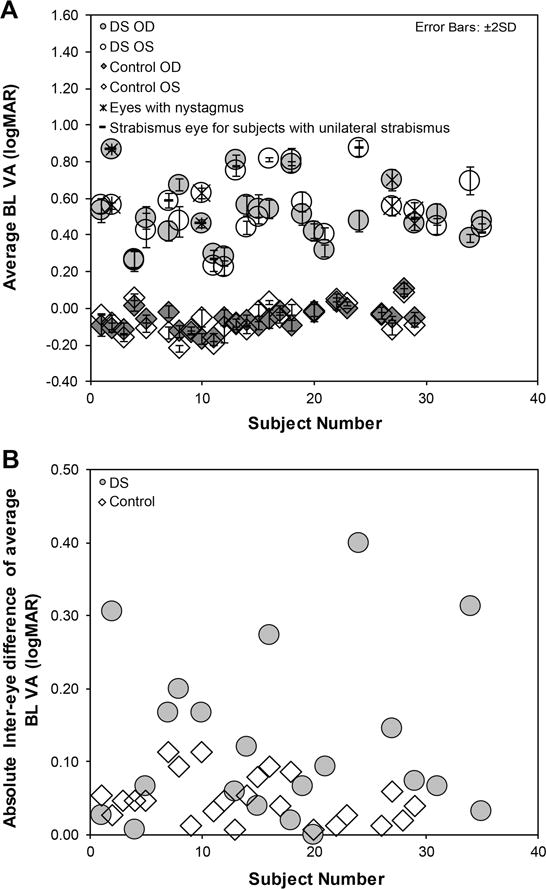
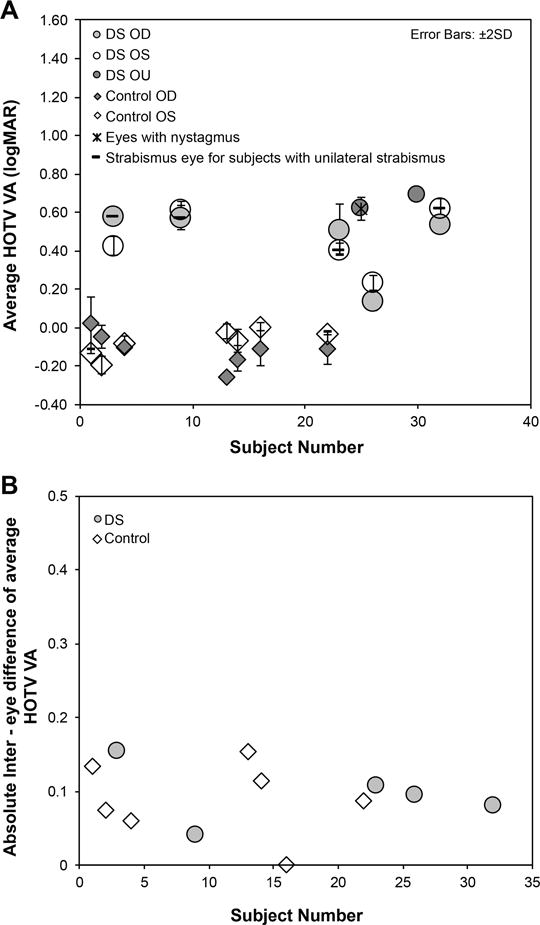
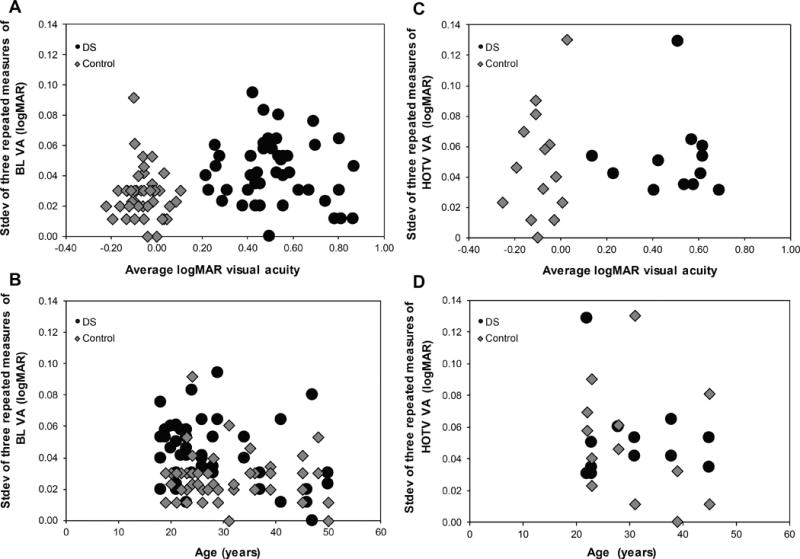
Results: The average logMAR VA for subjects with Down syndrome was approximately six lines worse than the control subjects (BL: Down syndrome = right eye: 0.51 ± 0.16, left eye: 0.53 ± 0.18; control = right eye: -0.06 ± 0.06, left eye: -0.06 ± 0.08, P < .0001; HOTV: Down syndrome = right eye: 0.47 ± 0.19, left eye: 0.46 ± 0.16; control: right eye = -0.11 ± 0.09, left eye: -0.07 ± 0.07, P < .001). Bailey-Lovie VA repeatability (1.96 * Sw * √2) was 0.13 logMAR (6.5 letters) for Down syndrome and 0.09 logMAR (4.5 letters) for control subjects. HOTV VA repeatability was 0.16 logMAR (eight letters) for both Down syndrome and control subjects.
Conclusions: Despite poorer acuity in individuals with Down syndrome, repeatability of VA measurements was comparable to control subjects for both BL and HOTV techniques.
Figures
References
-
- Parker SE, Mai CT, Canfield MA, et al. National Birth Defects Prevention N. Updated National Birth Prevalence Estimates for Selected Birth Defects in the United States, 2004–2006. Birth Defects Res A Clin Mol Teratol. 2010;88:1008–16. - PubMed
-
- Courage ML, Adams RJ, Reyno S, et al. Visual Acuity in Infants and Children with Down Syndrome. Dev Med Child Neurol. 1994;36:586–93. - PubMed
-
- Hestnes A, Sand T, Fostad K. Ocular Findings in Down’s Syndrome. J Ment Defic Res. 1991;35(Pt 3):194–203. - PubMed
Publication types
MeSH terms
Grants and funding
LinkOut - more resources
Full Text Sources
Other Literature Sources
Medical
