. 2018 Feb 20;14(2):e1007216.
doi: 10.1371/journal.pgen.1007216. eCollection 2018 Feb.

The INO80 chromatin remodeler sustains metabolic stability by promoting TOR signaling and regulating histone acetylation

Affiliations

The INO80 chromatin remodeler sustains metabolic stability by promoting TOR signaling and regulating histone acetylation

Sean L Beckwith et al. PLoS Genet. .

Abstract

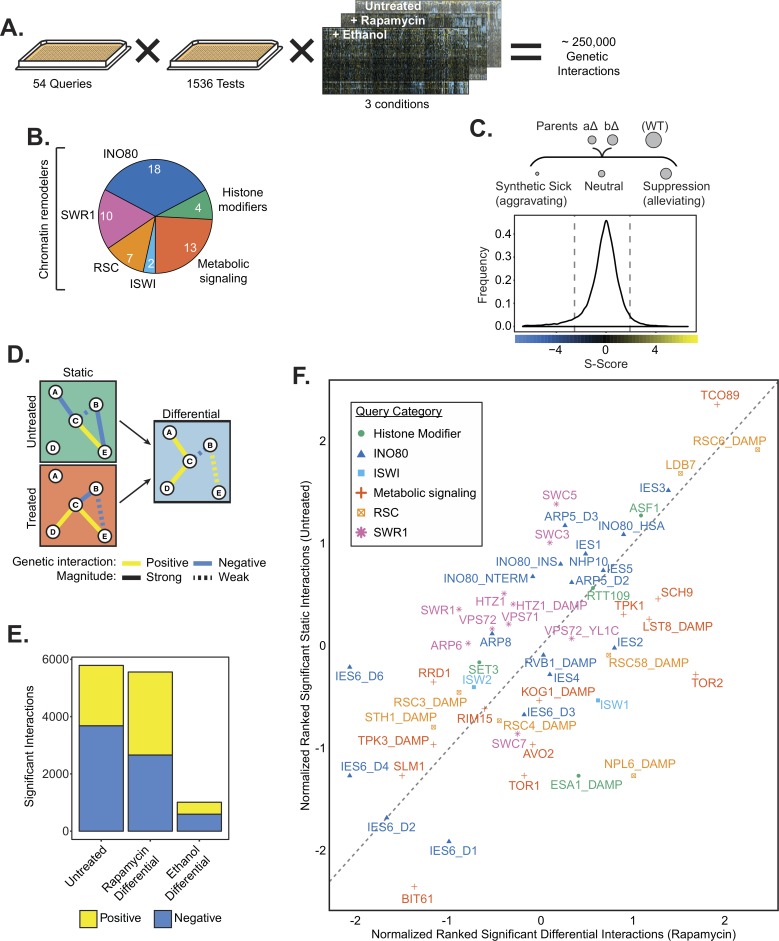
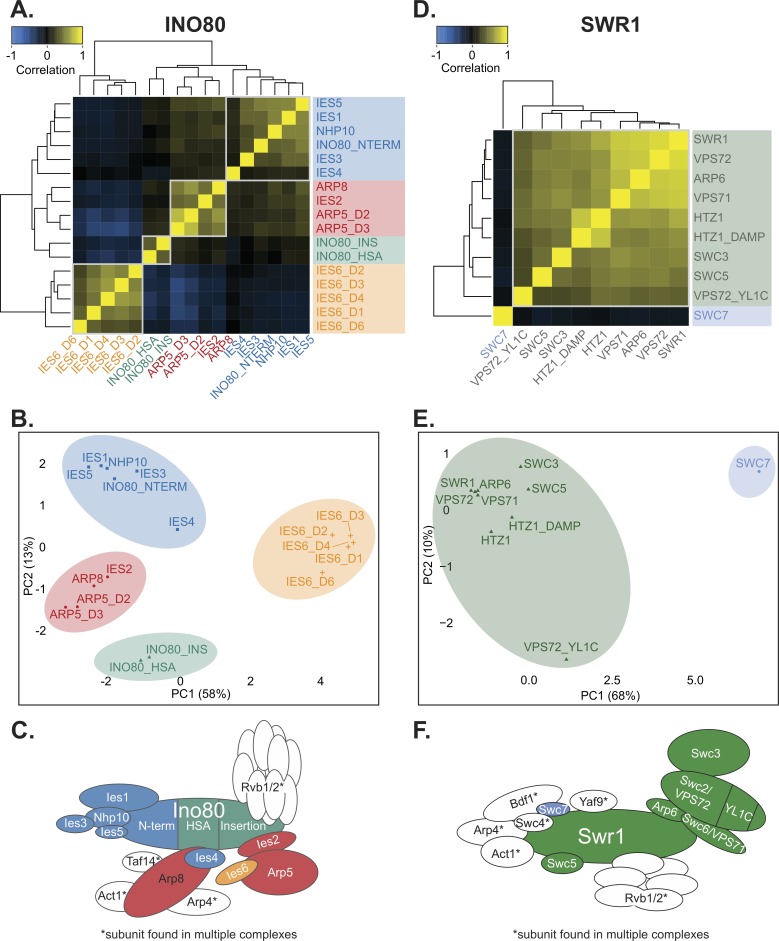
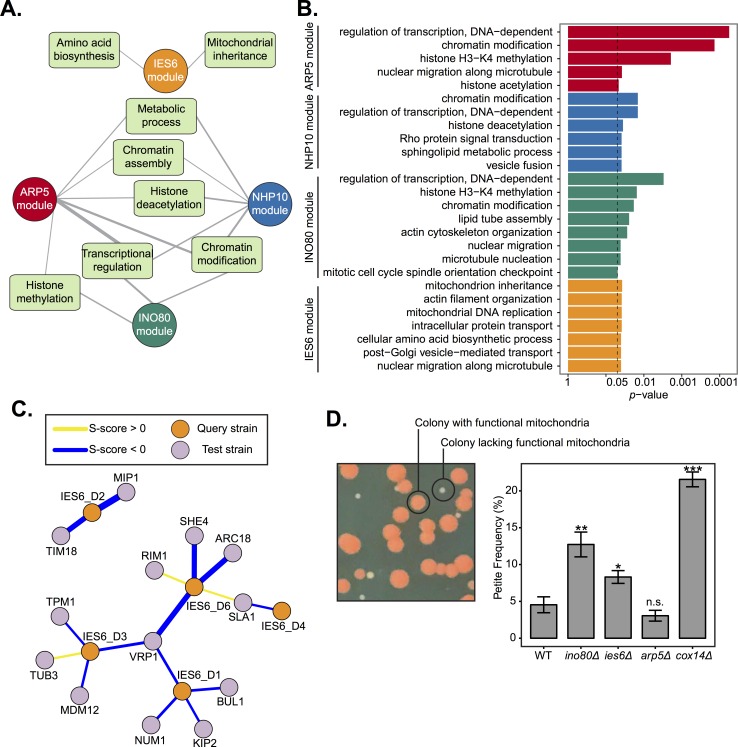
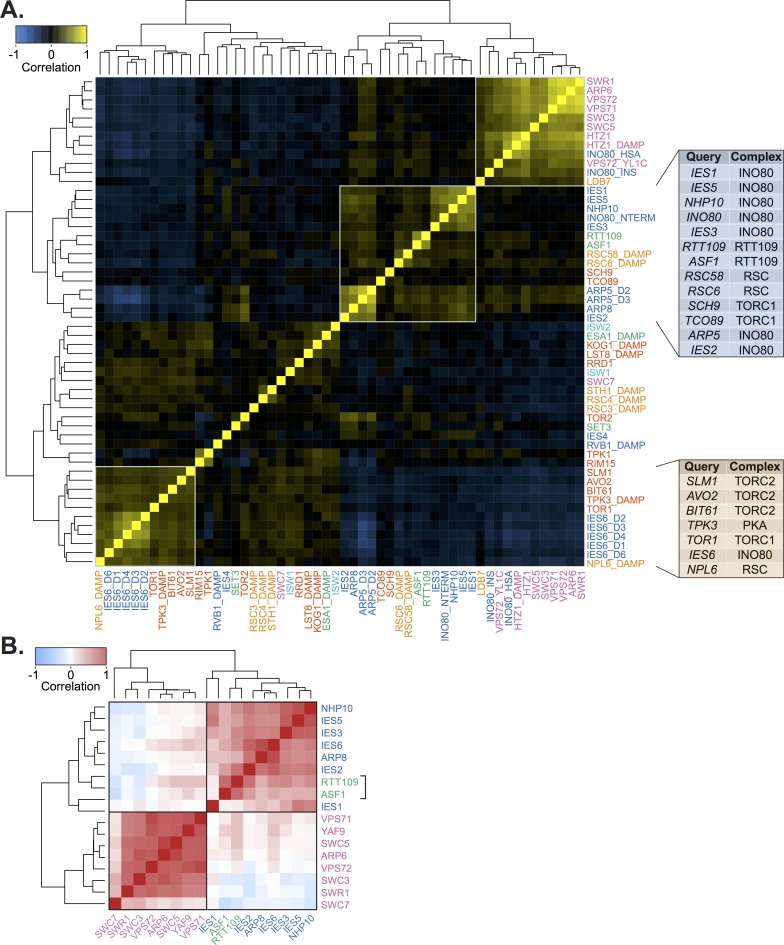
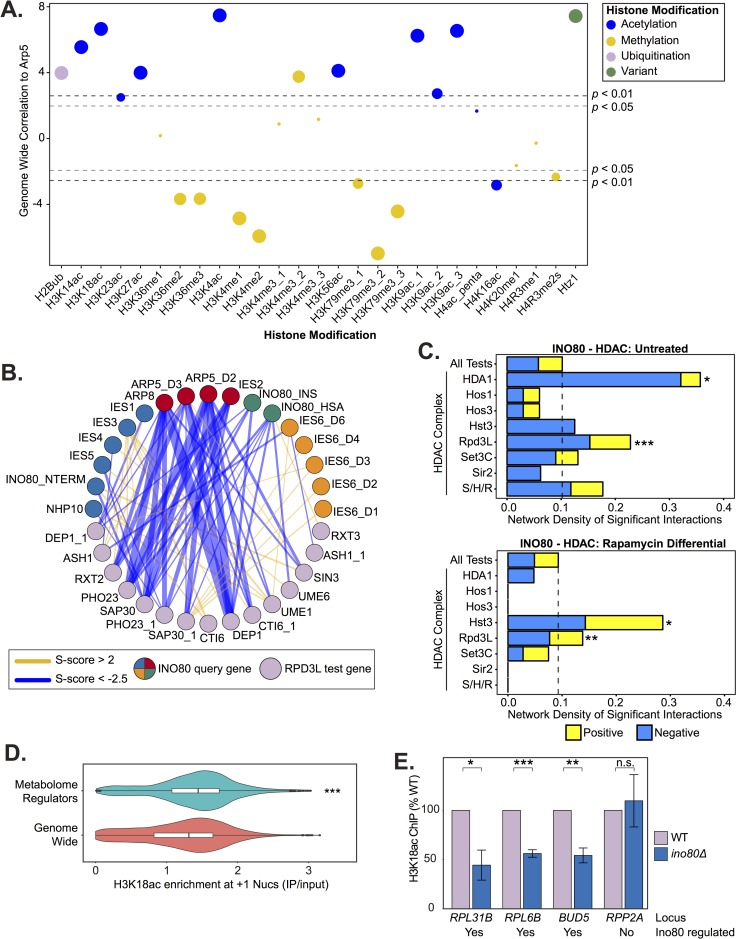
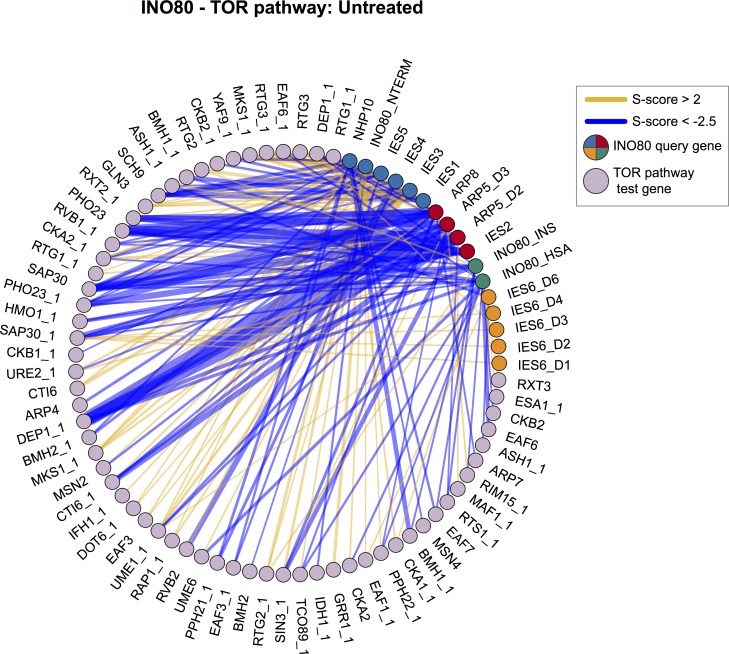
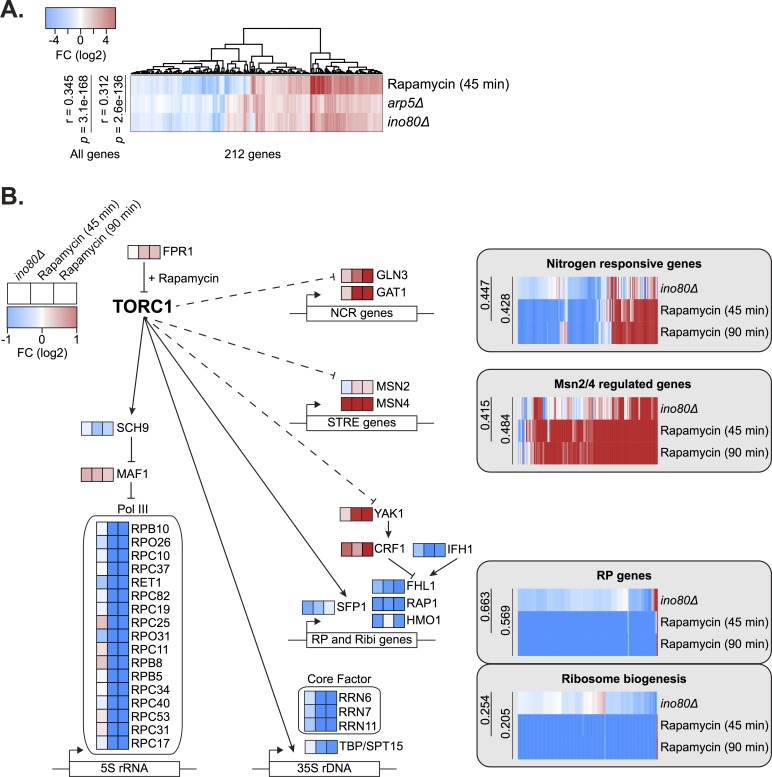
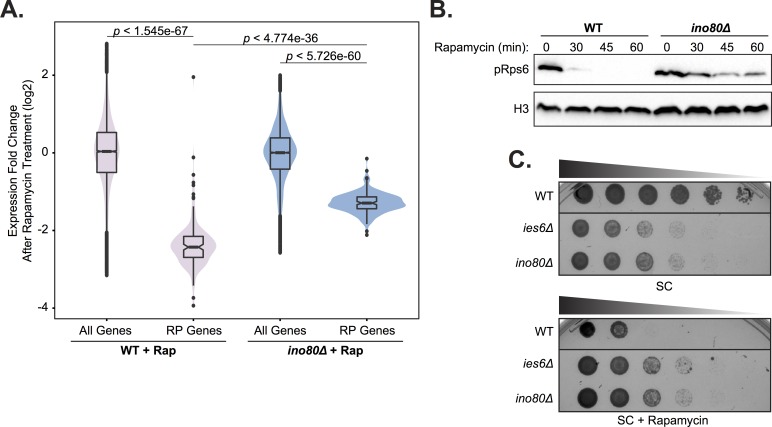
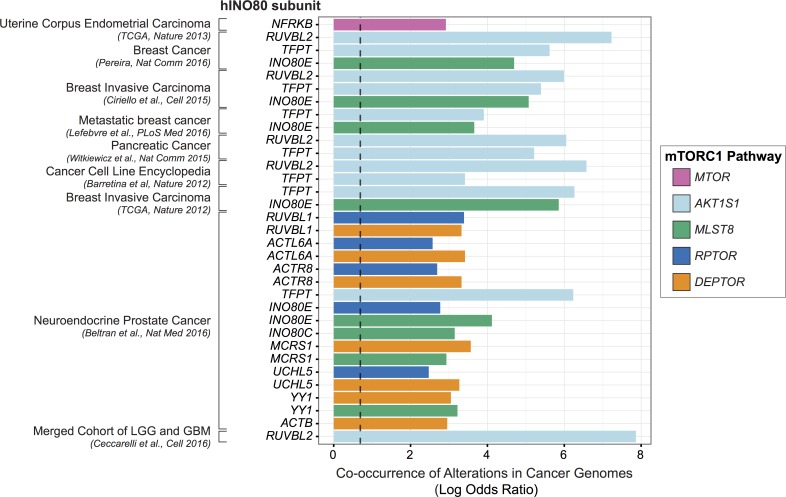
Chromatin remodeling complexes are essential for gene expression programs that coordinate cell function with metabolic status. However, how these remodelers are integrated in metabolic stability pathways is not well known. Here, we report an expansive genetic screen with chromatin remodelers and metabolic regulators in Saccharomyces cerevisiae. We found that, unlike the SWR1 remodeler, the INO80 chromatin remodeling complex is composed of multiple distinct functional subunit modules. We identified a strikingly divergent genetic signature for the Ies6 subunit module that links the INO80 complex to metabolic homeostasis. In particular, mitochondrial maintenance is disrupted in ies6 mutants. INO80 is also needed to communicate TORC1-mediated signaling to chromatin, as ino80 mutants exhibit defective transcriptional profiles and altered histone acetylation of TORC1-responsive genes. Furthermore, comparative analysis reveals subunits of INO80 and mTORC1 have high co-occurrence of alterations in human cancers. Collectively, these results demonstrate that the INO80 complex is a central component of metabolic homeostasis that influences histone acetylation and may contribute to disease when disrupted.


Conflict of interest statement

The authors have declared that no competing interests exist.

Figures

Fig 1
Fig 1. An epistasis map of chromatin and metabolic regulators.
(A) Overview of EMAP including 54 query strains and a library of 1536 test strains, assayed in three growth conditions. (B) Composition of the query library by number of query strains; INO80, SWR1, RSC and ISWI are chromatin remodeling complexes. Histone modifiers include histone acetyl-transferases and histone deacetylases. Metabolic signaling genes include components of the TOR and PKA signaling networks. Numbers indicate the number of query strains in each category. (C) Top, Genetic interaction scores (S-score) are computed by comparing the observed fitness, inferred from colony size, of double mutants with the expected fitness, which is based on fitness of parental strains. A wild-type (WT) strain is shown for comparison. Bottom, the distribution of S-scores is shown for the untreated condition. Dashed lines indicate significance cutoffs of -2.5 and 2 for aggravating and alleviating interactions, respectively. (D) Hypothetical genetic interaction network indicating how the differential network is constructed by “subtracting” the untreated condition from treated condition. (E) The number of significant positive and negative interactions for each growth condition. (F) Plot of rankit normalized significant interactions by query gene in the untreated condition and the rapamycin differential condition. Color and shape indicate query gene category. Dashed line indicates y = x reference line. Significant interaction tallies are included in S2 Table.
Fig 2
Fig 2. The INO80 complex is composed of distinct genetic modules.
(A) Heatmap illustrating pairwise Pearson correlations between INO80 complex subunit query strains across the test library in the untreated static condition. Boxes outline genetic modules identified by hierarchical clustering and k-means analysis. Subunits that are not unique to the INO80 complex were omitted from the analysis. Mutants are complete deletion or domain deletions where indicated: INO80 N-terminal (NTERM), insertion (INS), and HSA deletions; ARP5 domain 2 and 3 (D2 and D3) deletions; and IES6 domain 1, 2, 3, 4, and 6 (D1, D2, D3, D4, D6) deletions. (B) Principal component analysis (PCA) of Pearson correlations of INO80 complex subunit query strains as in (A). Colors indicate clustered genetic modules identified by k-means clustering (k = 4). (C) Schematic illustrating the INO80 complex organized by known physical interactions [22,23] with colors representing genetic modules of INO80 subunits identified in the untreated EMAP. (D) Heatmap of SWR1 complex subunit query strain Pearson correlations, as in (A). Mutants are complete deletion or domain deletions where indicated, decreased abundance by mRNA perturbation (DAmP) alleles are as described in [36]. A Vps72 (Swc2) YL1-C domain mutant that is conserved in Ies6 was also included. (E) PCA of SWR1 strains as in (B), with k = 2. (F) Schematic illustrating the SWR1 complex as in (C) based on structural studies [46].
Fig 3
Fig 3. The IES6 genetic module is involved in mitochondrial maintenance.
(A) Network diagram illustrating DAVID functional annotation clusters of significantly interacting test genes with each INO80 subunit query gene module identified in Fig 2. Line width indicates enrichment score, with a cutoff of ≥1.3 (-log10 p-value). Genes within each annotation are listed in S3 Table. (B) FDR adjusted p-values of gene ontology (GO) enrichments (hypergeometric test, p < .05) of significantly interacting test genes with each INO80 subunit query gene module. The complete list of significant GO terms is found in S4 Table. (C) Genetic interaction network between the IES6 genetic module and significantly interacting test genes found in the DAVID mitochondrial inheritance cluster. Line width indicates strength of S-score. (D) Left, representative image of yeast colonies overlaid with tetrazolium. Colonies founded by respiratory competent cells are large and red, “petite” colonies founded from respiratory deficient cells are smaller and white. Right, quantification of petite frequency in the indicated strains; deletion of COX14 is known to increase petite frequency [52]. Error bars represent standard error of the mean. Significance was determined using a Wilcoxon rank sum test from at least 8 independent measurements compared to wild-type.
Fig 4
Fig 4. Genetic profiles of Rtt109 and metabolic regulators correlate with INO80.
(A) Heatmap of Pearson correlation of all query strains in the untreated static condition. Label colors correspond to the query category annotated in Fig 1B. INO80 and SWR1 subunit mutants are described in Fig 2A and 2D. Boxes outline clusters identified by hierarchical clustering. Right, tables show the complex each query gene is found in for the INO80 and IES6 expanded genetic modules. (B) Heatmap of Pearson correlations of gene expression profiles from published microarray data [54] between deletion of subunits of the INO80 complex, SWR1 complex, RTT109 and ASF1. All correlations between RTT109, ASF1, and INO80 subunits are significant, p < 0.001. Boxes indicate hierarchical clusters.
Fig 5
Fig 5. INO80 is a regulator of histone acetylation.
(A) Genome-wide correlation of occupancy between Arp5 and histone modifications, listed on X-axis, using uniformly processed ChIP-seq data (see Materials and Methods). Colors illustrate modification type and size corresponds to binned p-value. (B) Genetic interaction network between INO80 subunit query strains and significantly interacting Rpd3L subunit test strains in the untreated static condition. Line width indicates strength of S-score, INO80 queries are colored according to modules identified in Fig 2. (C) Bar chart of network density by positive or negative significant interactions of test strains in the histone deacetylates complexes (HDACs) in yeast and INO80 subunit query strains in untreated or rapamycin differential conditions. Dashed line indicates the network density of all test strains (All Tests) and serves as a background benchmark. S/H/R is Sum1/Hst1/Rfm1. Significance was determined by Monte Carlo randomization test. (D) Violin and box plots of +1 nucleosome H3K18ac levels show significant regulators of the metabolome [58] (adjusted p-value < 0.01) have high H3K18ac levels compared to genome wide (p-value < 4.4e-16 by Wilcoxon rank sum test; p = 1.0e-5 by Monte Carlo randomization test). (E) ChIP-qPCR of H3K18ac in wild-type (WT) and ino80Δ deletion strains at loci chosen by H3K18ac levels from published data [69] and regulation of expression by Ino80 [18]. Significance was determined by Students t-test from at least 3 biological replicates, error bars represent standard error of the mean. Below each loci label is noted whether the gene’s expression is Ino80 regulated.
Fig 6
Fig 6. INO80 and the TOR pathway have a highly connected genetic interaction network.
Genetic interaction network between INO80 subunit query strains and significantly interacting TOR pathway test strains in the untreated static condition. Line width indicates strength of S-score, INO80 queries are colored according to modules identified in Fig 2. Network density is significantly high, p-value = 1.1e-3 by Monte Carlo randomization test.
Fig 7
Fig 7. INO80 regulates the expression of key TOR signaling effectors.
(A) Log-transformed Z-scores of expression fold-change (FC) between untreated and treated (30nM rapamycin for 45 minutes) wild-type cells or indicated deletion strains. Genes with at least a 1.5 fold-change are plotted. Pearson correlations and p-values are shown for all genes (>6000) regardless of fold-change difference. (B) Diagram of key genes involved in the TORC1 regulation of nitrogen source quality responsive genes [77], Msn2/4 regulated stress response genes [78], ribosomal protein (RP) genes, and ribosome biogenesis genes [79]. Log-transformed expression fold-change is shown comparing untreated wild-type cells and rapamycin treated (45 and 90 minutes) or deletion strains as indicated. Gene lists are found in S8 Table.
Fig 8
Fig 8. INO80 is an effector of the TORC1 pathway.
(A) Violin and box plots of log-transformed expression fold-change after 45 minutes of 30 nM rapamycin (Rap) treatment compared to untreated cells in the indicated strains. The top and bottom 3% of genome wide responses were excluded for plotting. Significance was determined using a Wilcoxon rank sum test with all genes. (B) Western analysis of phospho-Rps6 (pRps6) reduction following 30 nM rapamycin treatment for indicated minutes (min) in wild-type (WT) and ino80Δ strain. Histone H3 (H3) is a loading control. (C) Fitness assay of deletion strains compared to wild-type (WT). Serial dilution (1:5) of strains were grown at 30°C on synthetic complete (SC) media with 0 or 5nM rapamycin.
Fig 9
Fig 9. INO80 and mTORC1 alterations co-occur in cancers.
Co-occurrence of INO80 subunit and mTORC1 alteration in cancer using datasets [–99] from the cBioPortal [–102]. Datasets with high mutational load in the INO80/mTOR pathway gene sets (>20% altered samples) were used and small (< 50 samples) and provisional datasets were excluded. The natural log transformed odds ratio calculated by the mutual exclusivity tool in the portal is plotted for significant co-occurrences (Fisher’s Exact Test and false discovery rate of 0.001). Infinite calculated odds ratios are excluded. The dashed line marks tendency for co-occurrence (odds ratio of 2). Colors indicate mTORC1 subunits, human INO80 subunits are on the y-axis, co-occurrences are grouped by cancer study. The full table of significant co-occurrences is found in S9 Table.

References

    1. Clapier CR, Cairns BR. The biology of chromatin remodeling complexes. Annu Rev Biochem. 2009;78: 273–304. doi: 10.1146/annurev.biochem.77.062706.153223 - DOI - PubMed
    1. Davis P, Brachmann R. Chromatic Remodeling and Cancer. Cancer Biol Ther. 2003;2: 24–31. Available: http://www.landesbioscience.com/journals/cbt/davis2-1.pdf?origin=publica... - PubMed
    1. de la Serna IL, Ohkawa Y, Imbalzano AN. Chromatin remodelling in mammalian differentiation: lessons from ATP-dependent remodellers. Nat Rev Genet. 2006;7: 461–73. doi: 10.1038/nrg1882 - DOI - PubMed
    1. Wu JI. Diverse functions of ATP-dependent chromatin remodeling complexes in development and cancer. Acta Biochim Biophys Sin (Shanghai). 2012;44: 54–69. doi: 10.1093/abbs/gmr099.Review - DOI - PubMed
    1. Alcid E a., Tsukiyama T. ATP-dependent chromatin remodeling shapes the long noncoding RNA landscape. Genes Dev. 2014;28: 2348–2360. doi: 10.1101/gad.250902.114 - DOI - PMC - PubMed

Publication types

MeSH terms

Substances