. 2018 Apr 1;59(4):765-777.
doi: 10.1093/pcp/pcy013.

A Gene Regulatory Network for Cellular Reprogramming in Plant Regeneration

Affiliations

A Gene Regulatory Network for Cellular Reprogramming in Plant Regeneration

Momoko Ikeuchi et al. Plant Cell Physiol. .

Erratum in

  • Erratum.
    [No authors listed] [No authors listed] Plant Cell Physiol. 2018 Apr 1;59(4):876. doi: 10.1093/pcp/pcy075. Plant Cell Physiol. 2018. PMID: 29718476 Free PMC article. No abstract available.

Abstract

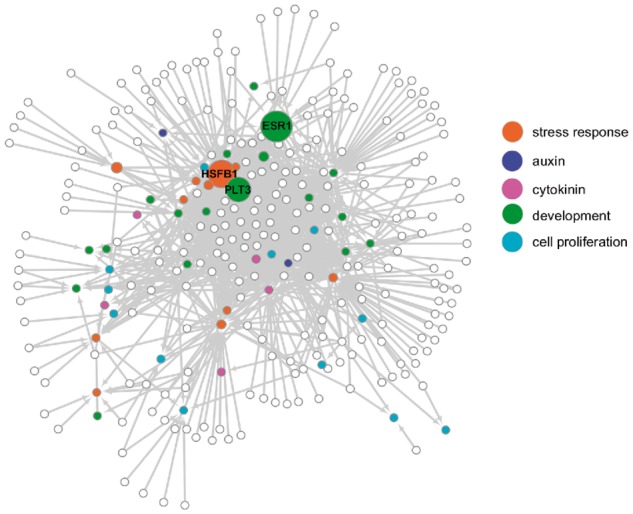
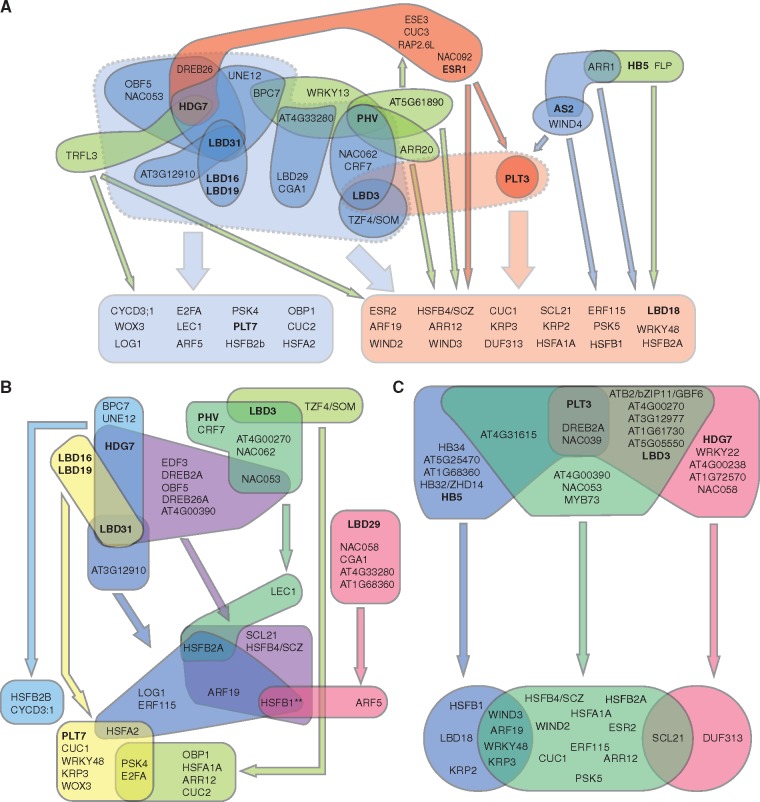
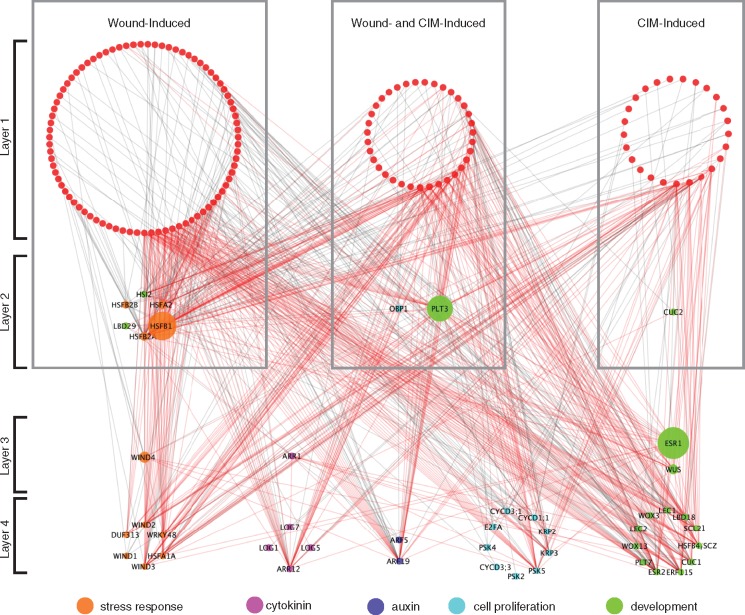
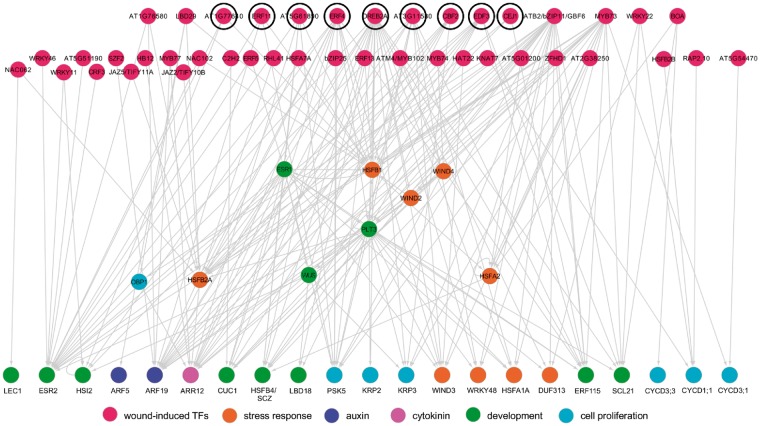
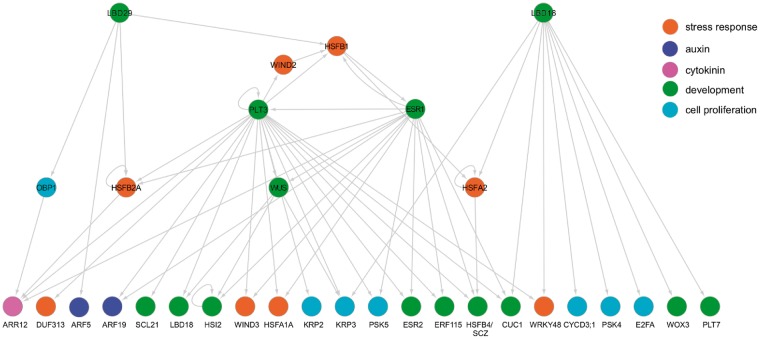
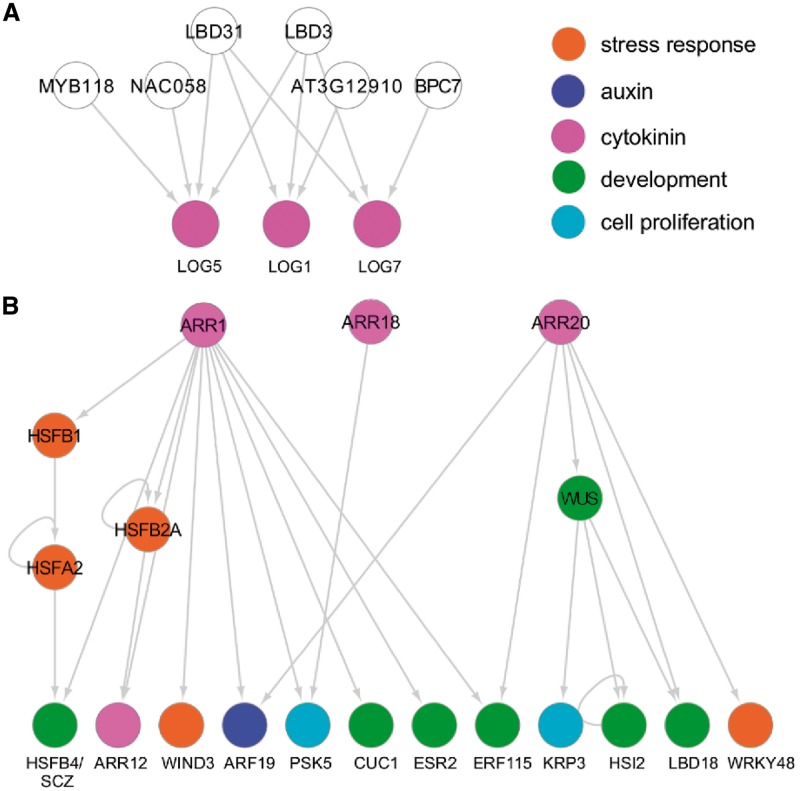
Wounding triggers organ regeneration in many plant species, and application of plant hormones, such as auxin and cytokinin, enhances their regenerative capacities in tissue culture. Recent studies have identified several key players mediating wound- and/or plant hormone-induced cellular reprogramming, but the global architecture of gene regulatory relationships underlying plant cellular reprogramming is still far from clear. In this study, we uncovered a gene regulatory network (GRN) associated with plant cellular reprogramming by using an enhanced yeast one-hybrid (eY1H) screen systematically to identify regulatory relationships between 252 transcription factors (TFs) and 48 promoters. Our network analyses suggest that wound- and/or hormone-invoked signals exhibit extensive cross-talk and regulate many common reprogramming-associated genes via multilayered regulatory cascades. Our data suggest that PLETHORA 3 (PLT3), ENHANCER OF SHOOT REGENERATION 1 (ESR1) and HEAT SHOCK FACTOR B 1 (HSFB1) act as critical nodes that have many overlapping targets and potentially connect upstream stimuli to downstream developmental decisions. Interestingly, a set of wound-inducible APETALA 2/ETHYLENE RESPONSE FACTORs (AP2/ERFs) appear to regulate these key genes, which, in turn, form feed-forward cascades that control downstream targets associated with callus formation and organ regeneration. In addition, we found another regulatory pathway, mediated by LATERAL ORGAN BOUNDARY/ASYMMETRIC LEAVES 2 (LOB/AS2) TFs, which probably plays a distinct but partially overlapping role alongside the AP2/ERFs in the putative gene regulatory cascades. Taken together, our findings provide the first global picture of the GRN governing plant cell reprogramming, which will serve as a valuable resource for future studies.


Figures

Fig. 1
Fig. 1
A graphic summary of the GRN for plant cellular reprogramming identified by eY1H assays. An eY1H screening identified 1,162 interactions (arrows) connecting 286 nodes (circles). Open circles represent prey TFs and filled circles represent bait promoters, with each color indicating a specific functional annotation. The size of circles indicates the betweenness centrality for each node, and three nodes, PLT3, ESR1 and HSFB1, that display the highest betweenness centrality are labeled. Prey TFs with a small number of targets are located on the periphery of the network, while those harboring a larger number of targets are located in the center. Bait promoters are often located between the periphery and the center of the network.
Fig. 2
Fig. 2
A power graph of the cellular reprogramming GRN. (A) A simplified representation of a subset of 34 power edges identified in the GRN for plant cell reprogramming using the power graph compression. All power nodes containing members of the LOB/AS2 TFs (colored in blue), HB TFs (colored in green), PLT3 and ESR1 (colored in red), representative of the AP2/ERF TFs, are shown, since they best explain the group structure of the power nodes based on the MCA. For simplicity, three PLT3 power nodes are represented as a single node, and all accompanying TFs, except for HB TFs, in the PLT3 power nodes that overlap with the LOB/AS2 power nodes are not shown. The target promoters are divided into two groups, depending on whether they interact with LOB/AS2 power nodes (colored in light blue) or primarily with PLT3 power nodes (colored in light red). Power edges between the nodes and these two promoter classes are represented by thin arrows, with colors corresponding to their regulatory nodes. Dotted, shaded collections of power nodes indicate the two main regulatory modules, the LOB/AS2-regulatory module (marked in light blue) and the PLT3-regulatory module (marked in light red), and thick arrows indicate their interaction with the promoters. See also Supplementary Table S7 for the full list of represented and non-represented genes. (B) (C) Detailed power edges within the LOB/AS2 (B) and PLT3 (C) regulatory modules, with the different power nodes and their power edges marked by the same colors. TFs belonging to the LOB/AS2 or HB TF classes and PLT3 and ESR1 are shown in bold.
Fig. 3
Fig. 3
A gene regulatory subnetwork highlights how wound-induced and/or CIM-induced TFs bind the promoters of downstream target genes. Wound-induced TFs were selected based on their up-regulation within 24 h after wounding as reported in Ikeuchi et al. (2017). CIM-induced TFs were defined as those significantly up-regulated in explants incubated on CIM for 7 d (FDR <0.01 and FC >0) (Che et al. 2006). These TFs were further layered based on their degrees of interactions within the subnetwork. TFs in layer 1 are induced by wounding and/or CIM and they have only outgoing interactions, i.e. binding to target promoters. TFs in layer 2 are also induced by wounding and/or CIM, and they engage in both incoming, i.e. promoter binding by upstream TFs, and outgoing interactions. TFs in layer 3 are not significantly induced by wounding and/or CIM, but they have both incoming and outgoing interactions. Genes in layer 4 represents bait promoters, thus they have only incoming interactions. Genes in layer 1 are colored in red, and those in layers 2, 3 and 4 are colored based on their functional annotations. Node size represents the betweenness centrality of the TFs in the network. Red edges represent TF–promoter interactions that are components of feed-forward loops.
Fig. 4
Fig. 4
A subnetwork highlighting how wound-induced TFs bind the promoters of downstream target genes. Wound-induced TFs, marked by red circles, directly or indirectly regulate downstream targets associated with cellular reprogramming. TFs interacting with more than two targets are positioned in the top tier and, among them, AP2/ERF family members are denoted by black circles. Downstream bait promoters are colored according to their functional annotations.
Fig. 5
Fig. 5
A subnetwork highlighting how auxin-mediated pathways may regulate plant cell reprogramming. PLT3, ESR1 and HSFB1 appear to form a feedback loop which regulates a partially overlapping set of genes involved in development (ESR2, CUC1 and WUS) and cell proliferation (KRP2, KRP3 and PSK5). LBD29 and LBD16 appear to regulate a largely distinct set of downstream targets involved in cell proliferation. Colored circles indicate functional annotations of prey TFs and bait promoters.
Fig. 6
Fig. 6
Subnetworks highlighting how cytokinin-mediated pathways may regulate plant cell reprogramming. (A) Six TFs in our GRN directly bind the promoters of three LOG genes involved in cytokinin biosynthesis, potentially regulating their expression directly. Among them, both LBD3 and LBD31 bind the promoters of LOG1, LOG5 and LOG7. (B) Key regulators of cytokinin signaling, ARR1, ARR18 and ARR20, potentially regulate genes associated with stress response (HSF genes), development (WUS, CUC1 and ESR2), cell proliferation (PSK5 and KRP3) and auxin (ARF19). Colored circles indicate functional annotations of prey TFs and bait promoters.

References

    1. Ahnert S.E. (2013) Power graph compression reveals dominant relationships in genetic transcription networks. Mol. Biosyst. 9: 2681–2685. - PubMed
    1. Ahnert S.E. (2014) Generalised power graph compression reveals dominant relationship patterns in complex networks. Sci. Rep. 4: 4385–4385. - PMC - PubMed
    1. Amano Y., Tsubouchi H., Shinohara H., Ogawa M., Matsubayashi Y. (2007) Tyrosine-sulfated glycopeptide involved in cellular proliferation and expansion in Arabidopsis. Proc. Natl. Acad. Sci. USA 104: 18333–18338. - PMC - PubMed
    1. Assenov Y., Ramírez F., Schelhorn S.E., Lengauer T., Albrecht M. (2008) Computing topological parameters of biological networks. Bioinformatics 24: 282–284. - PubMed
    1. Atta R., Laurens L., Boucheron-Dubuisson E., Guivarc’h A., Carnero E., Giraudat-Pautot V., et al. (2009) Pluripotency of Arabidopsis xylem pericycle underlies shoot regeneration from root and hypocotyl explants grown in vitro. Plant J. 57: 626–644. - PubMed

MeSH terms