Clinical Trial
. 2018 May 1;163(1):293-306.
doi: 10.1093/toxsci/kfy035.

Stochastic Pharmacokinetic-Pharmacodynamic Modeling for Assessing the Systemic Health Risk of Perfluorooctanoate (PFOA)

Affiliations
Clinical Trial

Stochastic Pharmacokinetic-Pharmacodynamic Modeling for Assessing the Systemic Health Risk of Perfluorooctanoate (PFOA)

Matteo Convertino et al. Toxicol Sci. .

Abstract

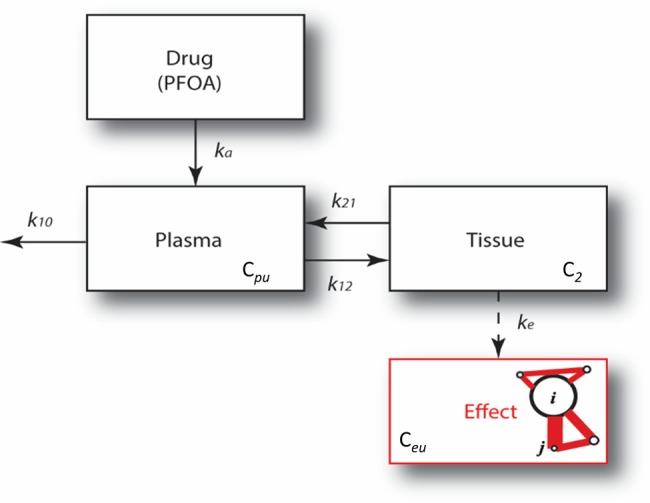
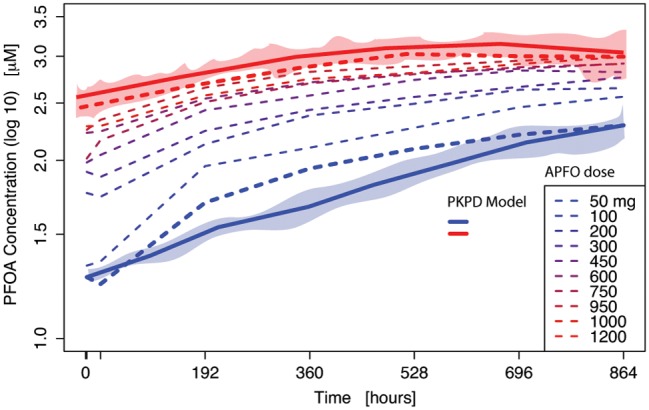
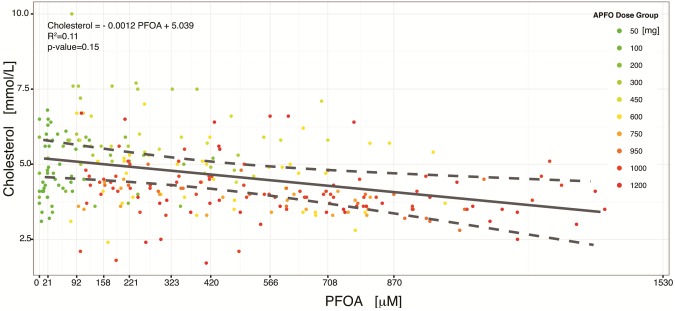
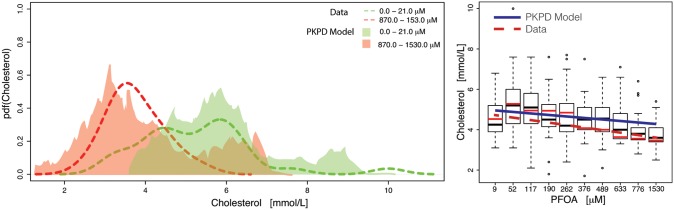
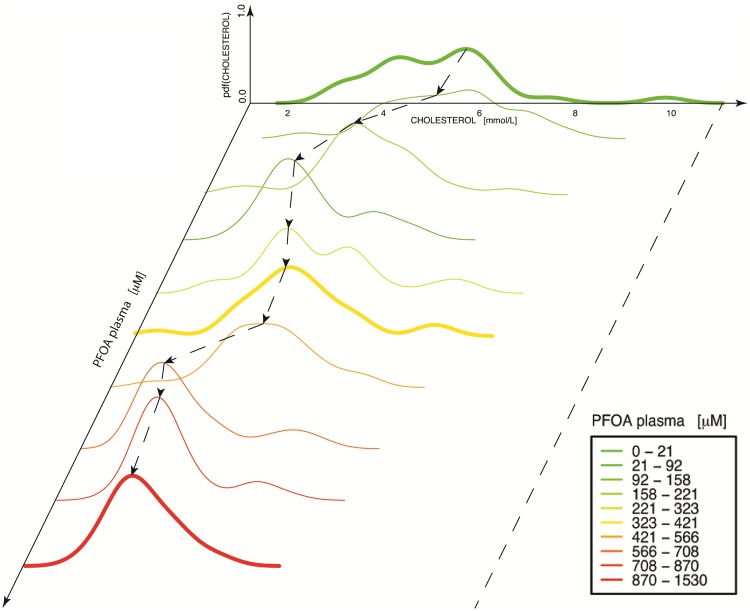
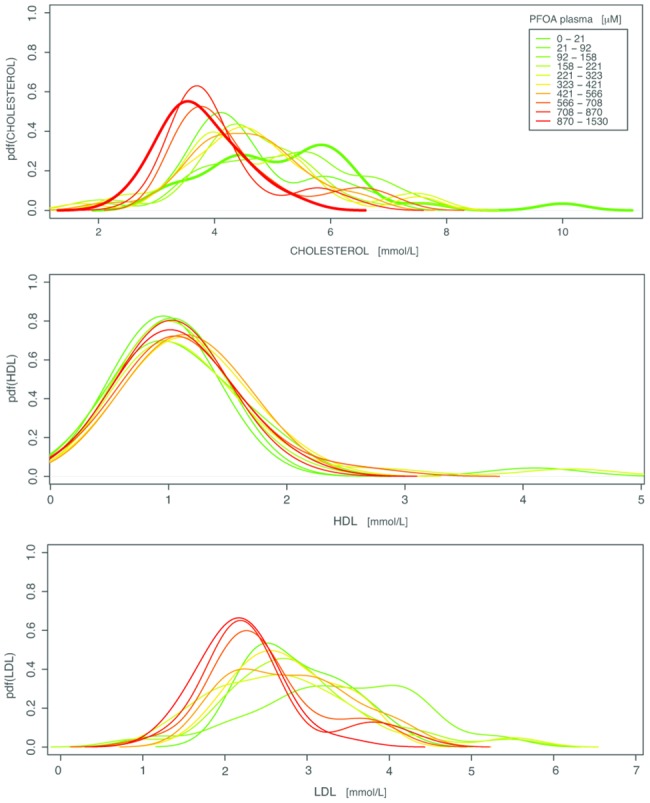
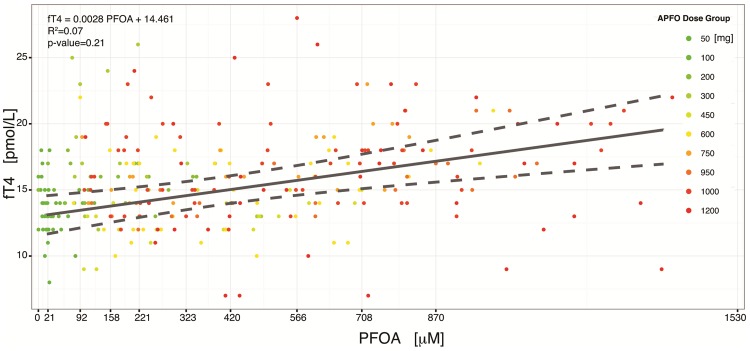
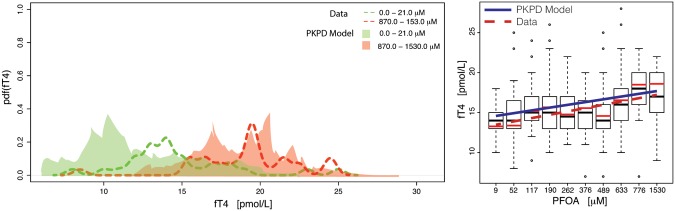
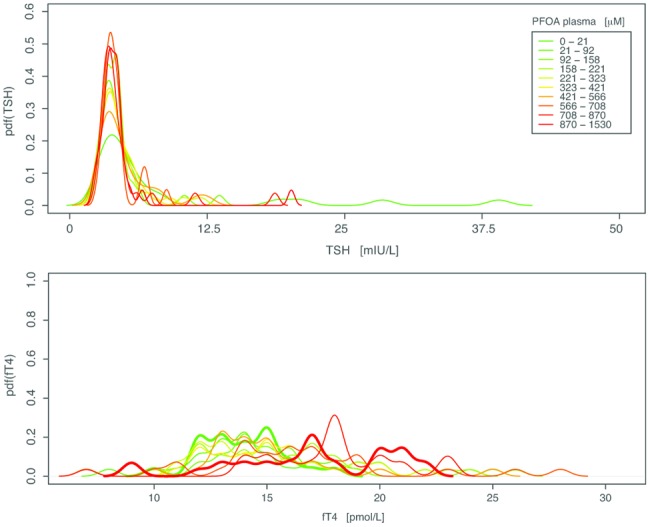
A phase 1 dose-escalation trial assessed the chemotherapeutic potential of ammonium perfluorooctanoate (APFO). Forty-nine primarily solid-tumor cancer patients who failed standard therapy received weekly APFO doses (50-1200 mg) for 6 weeks. Clinical chemistries and plasma PFOA (anionic APFO) were measured predose and weekly thereafter. Several clinical measures including total cholesterol, high-density lipoproteins (HDLs), thyroid stimulating hormone (TSH), and free thyroxine (fT4), relative to PFOA concentrations were examined by: Standard statistical analyses using generalized estimating equations (GEE) and a probabilistic analysis using probability distribution functions (pdf) at various PFOA concentrations; and a 2-compartment pharmacokinetic/pharmacodynamic (PK/PD) model to directly estimate mean changes. Based on the GEE, the average rates of change in total cholesterol and fT4 associated with increasing PFOA were approximately -1.2×10⁻³ mmol/l/μM and 2.8×10⁻³ pmol/l/μM, respectively. The PK/PD model predicted more closely the trends observed in the data as well as the pdfs of biomarkers. A decline in total cholesterol was observed, with a clear transition in shape and range of the pdfs, manifested by the maximum value of the Kullback-Leibler (KL) divergence, that occurred at plasma PFOA between 420 and 565 μM (175 000-230 000 ng/ml). High-density lipoprotein was unchanged. An increase in fT4 was observed at a higher PFOA transition point, albeit TSH was unchanged. Our findings are consistent with some animal models and may motivate re-examination of the epidemiologic studies to PFOA at levels several orders of magnitude lower than this study. These observational studies have reported contrary associations, but currently understood biology does not support the existence of such conflicting effects.


Figures

Figure 1.
Figure 1.
Conceptual diagram of the PK/PD compartmental model. The black and red boxes refer to the stochastic pharmacokinetic (PK) and pharmacodynamics (PDs) model, respectively. Dose of the drug, plasma concentration, unbound concentration in the tissue and effect in the biologic compartments are the quantities that are calculated by the model. Cpu and C2 represent unbound concentration in the plasma compartment and in a second tissue compartment. The parameters V, ka, k12, k21, and k10 are calibrated simultaneously in a fitting model that considers the data and aim to maximize prediction accuracy. The concentration in the effect compartment was linked to the plasma compartment by a first-order equilibrium rate constant ke. Ceu denotes the unbound effect compartment concentration. E denotes the effect variable, and a and b (see equation 4) are calibrated input factors whose specific value depends on the effect compartment (or clinical biomarker) but their probability distribution does not. i and j refer to any clinical biomarker that are mutually dependent.
Figure 2.
Figure 2.
Observed and predicted plasma concentration of PFOA over time conditional on the assigned dose. Predictions and data are solid and dashed lines as a function of dose category. The PK/PD model predictions are shown only for the lowest and highest dose category. Variability around PK curves is a function of the pdf assigned to the input factors and numerical Monte Carlo variability related to the Sobol sampling scheme.
Figure 3.
Figure 3.
Generalized estimating equations analysis of cholesterol and PFOA. Slope and 95% CI presented. Dots of different colors are for different dose groups.
Figure 4.
Figure 4.
Observed and predicted probability distribution function of cholesterol and dependent on PFOA concentration. (Left) The solid pdfs are cholesterol levels for the lowest and highest PFOA concentration categories predicted by repeated runs of the PK/PD model whereas the dashed pdf are from smoothed observations. (Right) Box plots and slope of the observed and slope of the model-predicted average value of cholesterol plotted as a function of each of the 10 PFOA serum concentration categories. The black and red bars in the boxes represent the median and the mean value respectively. Dots above boxes are outliers (upper dots are more than 3/2 times of upper quartile, whereas lower dots are less than 3/2 times of lower quartile). The extremes of the whiskers are the maximum and minimum values for each category excluding outliers. The extremes of the boxes are the third and first quartiles.
Figure 5.
Figure 5.
Probability distribution functions of total cholesterol over increasing PFOA concentrations for all subjects in the cohort. The colors of the pdf correspond to the PFOA concentrations groups as in the legend.
Figure 6.
Figure 6.
Observed probability distribution function of cholesterol. Total cholesterol, HDL, and LDL are considered. HDL is invariant for any PFOA class, and by LDL that is decreasing for increasing values of PFOA. The pdfs of cholesterol for the lowest and highest PFOA plasma classes are shown with a thick line to emphasize the change in their probabilistic structure. Pdfs of different colors correspond to the PFOA concentration groups as in the legend.
Figure 7.
Figure 7.
GEE analysis of fT4 and PFOA. Slope and 95% CI presented. Dots of different colors are for different dose groups.
Figure 8.
Figure 8.
Observed and predicted probability distribution function of fT4 and dependent on PFOA concentration. (Left) The solid pdfs are fT4 levels for the lowest and highest PFOA concentration categories predicted by repeated runs of the PK/PD model whereas the dashed pdf are from smoothed observations. (Right) Box plots and slope of the observed and slope of the model-predicted average value of fT4 plotted as a function of each of the 10 PFOA serum concentration categories. The black and red bars in the boxes represent the median and the mean value respectively. Dots above boxes are outliers (upper dots are more than 3/2 times of upper quartile, whereas lower dots are less than 3/2 times of lower quartile). The extremes of the whiskers are the maximum and minimum values for each category excluding outliers. The extremes of the boxes are the third and first quartiles.
Figure 9.
Figure 9.
Observed probability distribution function of thyroid function. TSH is invariant and fT4 is higher for higher values of PFOA. The pdfs of fT4 for the lowest and highest PFOA plasma classes are shown with a thick line to emphasize the change in their probabilistic structure. Pdfs of different colors correspond to the PFOA concentration groups as in the legend.
Figure 10.
Figure 10.
Observed probability distribution function of ALT. ALT is invariant for any PFOA categorization. Pdfs of different colors correspond to the PFOA concentration groups as in the legend.
Figure 11.
Figure 11.
Observed probability distribution function of serum creatinine. Serum creatinine appears to be slightly increasing for increasing values of PFOA but this was based on one individual. Pdfs of different colors correspond to the PFOA concentration groups as in the legend.

References

    1. Albrecht P. P., Torsell N. E., Krishnan P., Ehresman D. J., Frame S. R., Chang S. C., Butenhoff J. L., Kennedy G. L., Gonzalez F. J., Peters J. M. (2013). A species difference in the perixosome proliferator-activated receptor α-dependent response to the developmental effects of perfluorooctanoic acid. Toxicol. Sci. 131, 568–582. - PubMed
    1. Barnett A. D., Ding S., Murray C., Chamberlain M., Plummer S., Evans T. R. J., MacPherson I., Bissett D., Elcombe C. R., Wolf C. R. (2010). Anti-tumor activity of CXR 1002, a novel anti-cancer clinical phase compound that induces ER stress and inhibits PIM kinases: Human tumor xenograft efficacy and in vitro mode of action. (Abstract 123). EJC Suppl 8, 45–46.
    1. Barry V., Winquist A., Steenland K. (2013). Perfluorooctanoic acid (PFOA) exposures and incident cancers among adults living near a chemical plant. Environ. Health Perspect. 121, 1313–1318. - PMC - PubMed
    1. Bartell S. M., Calafat A. M., Lyu C., Kato K., Ryan B., Steenland K. (2009). Rate of decline in serum PFOA concentrations after granular activated carbon filtration at two public water systems in Ohio and West Virginia. Environ. Health Perspect. 118, 222–228. - PMC - PubMed
    1. Benbrahim-Tallaa L., Lauby-Secretan B., Loomis D., Guyton K. Z., Grosse Y., Ghissassi F. E., Bouvard V., Guha N., Mattock H., Straif K. (2014). Carcinogenicity of perfluorooctanoic acid, tetrafluoroethylene, dichloromethane, 1, 2-dichloropropane, and 1, 3-propane sultone. Lancet Oncol. 15, 924–925. - PubMed

Publication types

MeSH terms