. 2018 May:518:103-115.
doi: 10.1016/j.virol.2018.02.010. Epub 2018 Feb 20.

The human T-cell leukemia virus type-1 p30II protein activates p53 and induces the TIGAR and suppresses oncogene-induced oxidative stress during viral carcinogenesis

Affiliations

The human T-cell leukemia virus type-1 p30II protein activates p53 and induces the TIGAR and suppresses oncogene-induced oxidative stress during viral carcinogenesis

Megan Romeo et al. Virology. 2018 May.

Abstract

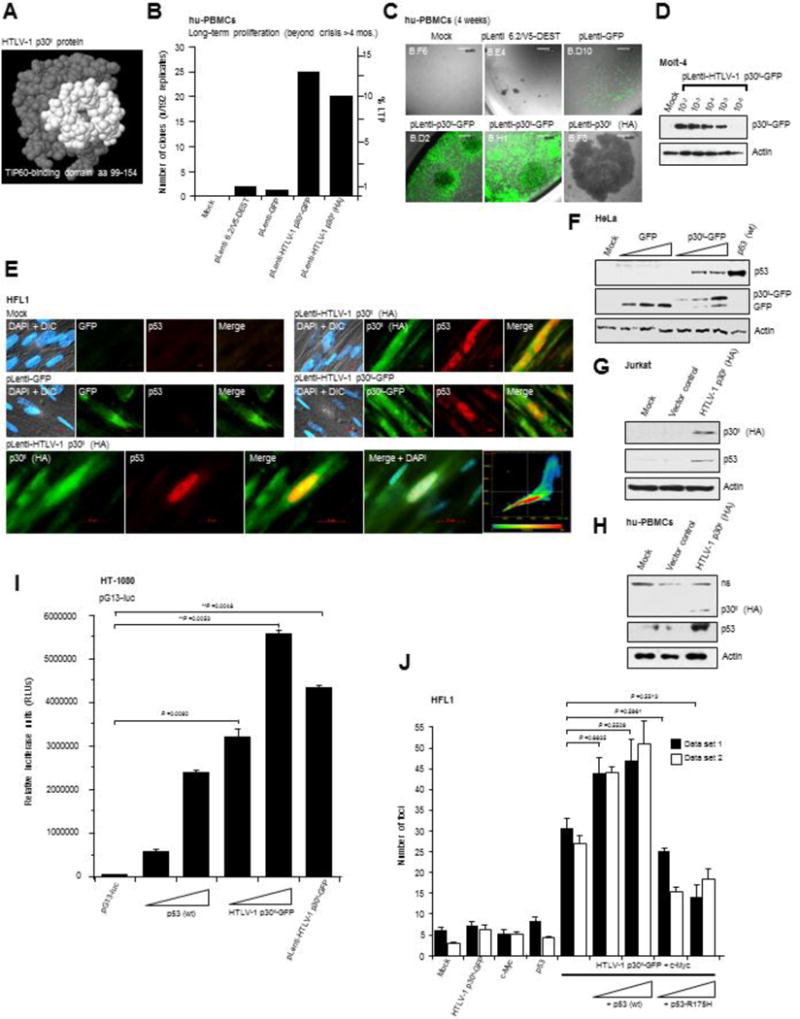
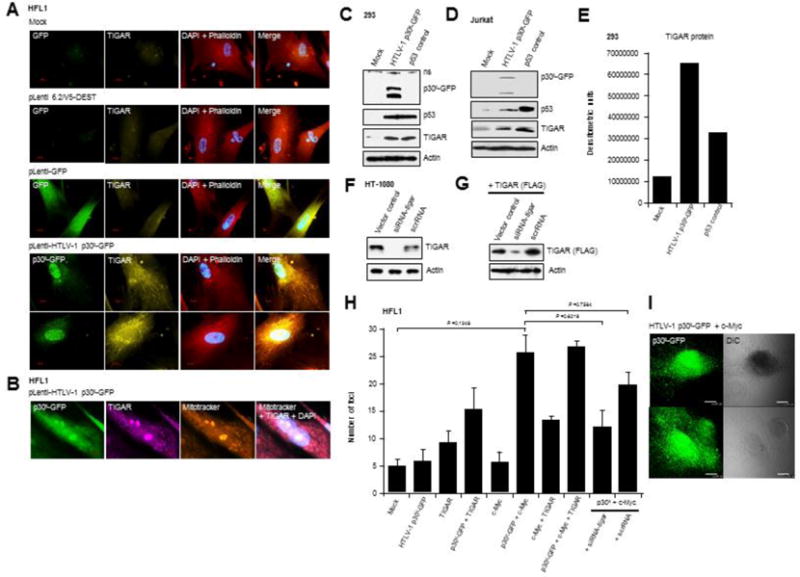
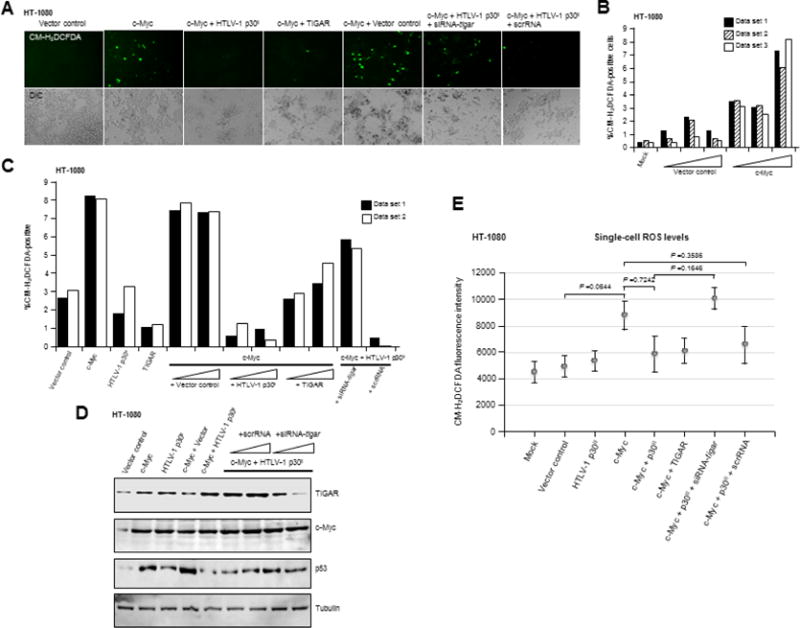
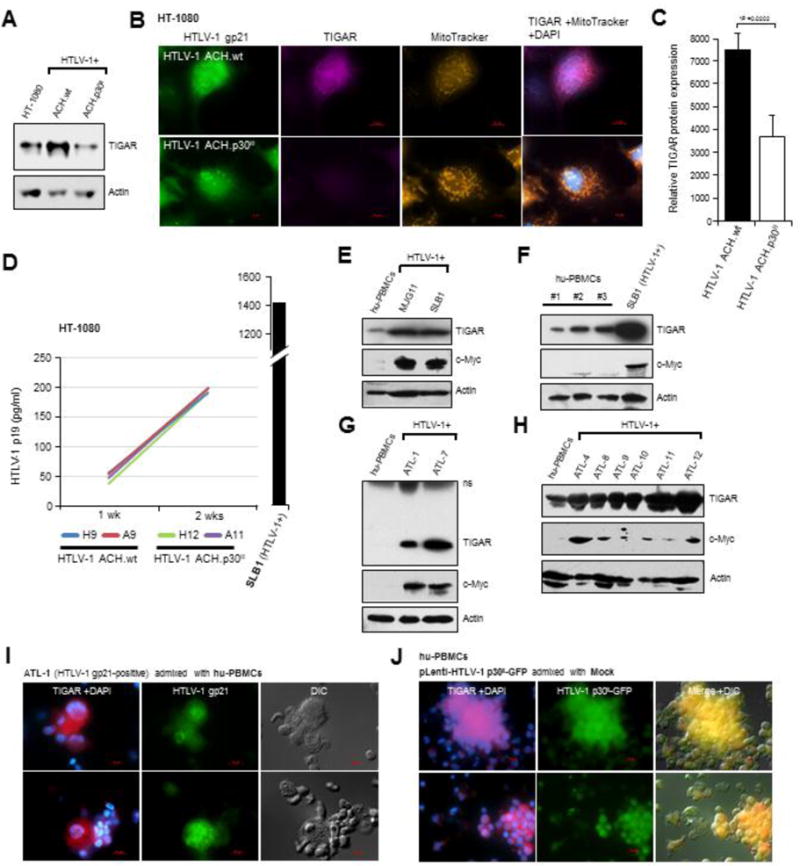
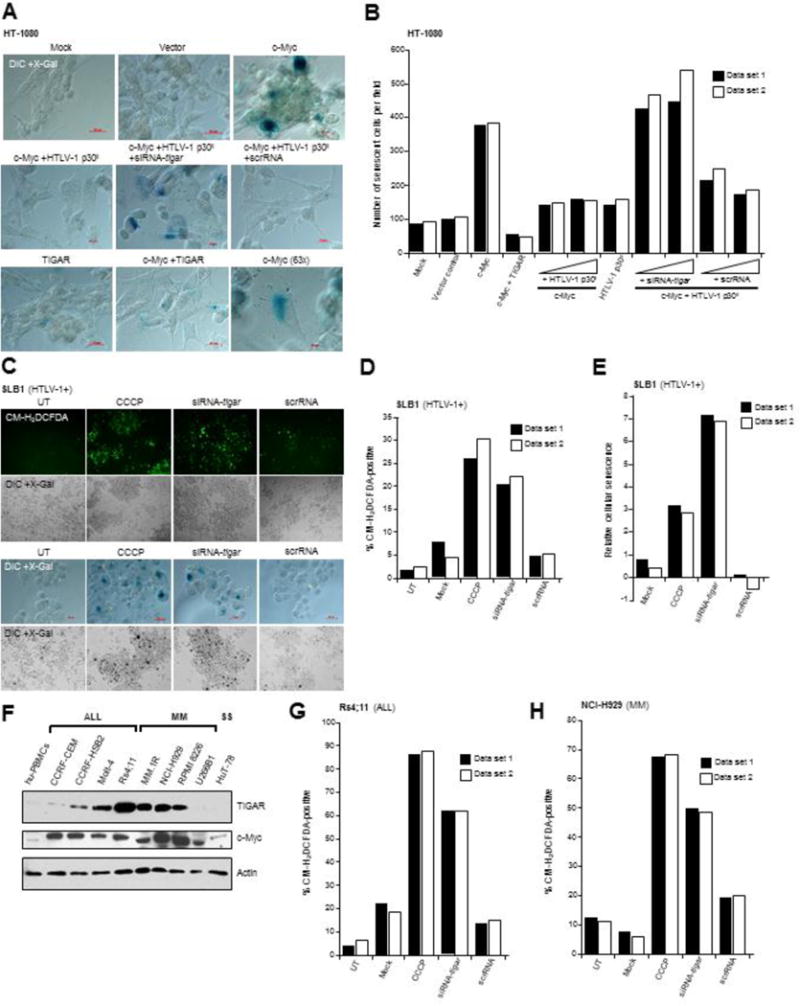
In normal cells, aberrant oncogene expression leads to the accumulation of cytotoxic metabolites, including reactive oxygen species (ROS), which can cause oxidative DNA-damage and apoptosis as an intrinsic barrier against neoplastic disease. The c-Myc oncoprotein is overexpressed in many lymphoid cancers due to c-myc gene amplification and/or 8q24 chromosomal translocations. Intriguingly, p53 is a downstream target of c-Myc and hematological malignancies, such as adult T-cell leukemia/lymphoma (ATL), frequently contain wildtype p53 and c-Myc overexpression. We therefore hypothesized that p53-regulated pro-survival signals may thwart the cell's metabolic anticancer defenses to support oncogene-activation in lymphoid cancers. Here we show that the Tp53-induced glycolysis and apoptosis regulator (TIGAR) promotes c-myc oncogene-activation by the human T-cell leukemia virus type-1 (HTLV-1) latency-maintenance factor p30II, associated with c-Myc deregulation in ATL clinical isolates. TIGAR prevents the intracellular accumulation of c-Myc-induced ROS and inhibits oncogene-induced cellular senescence in ATL, acute lymphoblastic leukemia, and multiple myeloma cells with elevated c-Myc expression. Our results allude to a pivotal role for p53-regulated antioxidant signals as mediators of c-Myc oncogenic functions in viral and non-viral lymphoid tumors.

Keywords: ATL; HTLV-1; Oncogene; ROS; TIGAR; p53.


Figures

Fig. 1
Fig. 1
The HTLV-1 p30II protein activates p53 and induces oncogenic cellular transformation with c-Myc which is dependent upon p53 transcriptional activity. (A) The predicted structure of the HTLV-1 p30II protein with amino acid residues comprising the TIP60-binding domain (aa residues 99–154) highlighted in white (Awasthi et al., 2005; Romeo et al., 2015). (B and C) Primary hu-PBMCs were transduced with pLenti-HTLV-1 p30II-GFP, pLenti-HTLV-1 p30II (HA-tagged), pLenti-GFP control, or empty pLenti 6.2/V5-DEST vector and cultured in the presence of recombinant hu-IL-2 (50U/ml) and selected on Blasticidin (5 μg/ml). Untransduced mock cells are shown for comparison. The transduced cultures were repeatedly passaged and monitored for long-term proliferation, as defined by continuous growth beyond crisis (> 4 months). Data presented in the graph are from 192 experimental replicates. The scale bars represent 0.2 mm. (D) Immunoblot analysis of p30II-GFP expression in Molt-4 lymphoblasts transduced with various dilutions of a concentrated lentiviral HTLV-1 p30II-GFP virus stock. (E) The induction of p53 protein expression in human HFL1 fibroblasts that were transduced with pLenti-HTLV-1 p30II-GFP or pLenti-HTLV-1 p30II (HA) expression vectors, as compared to a pLenti-GFP negative control, was visualized by immunofluorescence-microscopy. Untransduced mock cells are also shown. DAPI-nuclear staining is provided in the DIC overlay images. The scale bars represent 20 μm. The nuclear colocalization between the HTLV-1 p30II (HA-tagged, green) and p53 (red)-specific fluorescent signals in the bottom panels was quantified using Carl Zeiss Axiovision 4.8 software and is represented in the heat-map graph. (F-H) The induction of p53 protein expression by HTLV-1 p30II-GFP or HTLV-1 p30II (HA) in transfected HeLa cells, Jurkat lymphocytes, and cultured hu-PBMCs was detected by SDS-PAGE and immunoblotting. A pCEP4-wildtype p53 expression construct was included (F, right lane) as a positive control. Relative Actin levels are shown for reference. (I) HT-1080 fibrosarcoma cells were cotransfected with a pG13-luc reporter plasmid, which contains two copies of the consensus p53-binding sequence (El-Deiry et al., 1993), and increasing amounts of pCEP4-wildtype p53 (as a positive control) or pEGFP-N3-HTLV-1 p30II-GFP, or the pLenti-HTLV-1 p30II-GFP expression construct. Relative luciferase activities were measured and normalized for equivalent total cellular protein levels. The averaged data from three experiments are shown. (J) Oncogenic foci-formation was assessed by cotransfecting HFL1 fibroblasts with expression constructs for c-Myc and HTLV-1 p30II-GFP, in the presence of increasing amounts of pCEP4-wildtype p53 or pCEP4-p53-R175H (a dominant-negative DNA-binding mutant of p53; Hermeking et al., 1997). The transfected cultures were monitored for foci-formation (i.e., loss of cellular contact-inhibition) over a three-week period (see s). Error bars represent the standard deviation between replicate data sets (n=3) for the duplicate experiments shown.
Fig. 2
Fig. 2
HTLV-1 p30II induces the expression and mitochondrial localization of TIGAR which is required for its oncogenic cooperation with c-Myc. (A) Human HFL1 fibroblasts were transduced with pLenti-HTLV-1 p30II-GFP, pLenti-GFP, or the empty pLenti 6.2/V5-DEST vector and the expression of TIGAR was visualized by immunofluorescence-microscopy. The HTLV-1 p30II-GFP and GFP were detected by direct-fluorescence. DAPI nuclear-staining and Texas Red-Phalloidin staining of the Actin cytoskeleton are provided for reference. The scale bars represent 20 μm. (B) The mitochondrial localization of TIGAR in HFL1 fibroblasts transduced with pLenti-HTLV-1 p30II-GFP was confirmed by immunofluorescence-microscopy in cells that were co-labeled with MitoTracker Orange. DAPI nuclear-staining is provided in the merged image. (C and D) The induction of p53 and TIGAR protein expression in 293 HEK cells and Jurkat lymphocytes expressing HTLV-1 p30II-GFP was detected by immunoblotting. The cells were also transfected with pCEP4-wildtype p53 as a positive control (Hermeking et al., 1997). (E) Densitometry quantification of the TIGAR protein expression in 293 HEK cells shown in C. (F) HT-1080 fibrosarcoma cells were repeatedly transfected with an siRNA targeted against tigar transcripts (siRNA-tigar) or a scrambled RNA (scrRNA) control and the knockdown of endogenous TIGAR expression was detected by immunoblotting. (G) HT-1080 cells were transfected with a CMV-TIGAR (FLAG-tagged) expression construct (Bensaad et al., 2006) and siRNA-tigar or a scrRNA control, and the knockdown of FLAG-tagged TIGAR was detected by immunoblotting. (H) The effects of TIGAR overexpression or siRNA-tigar knockdown of TIGAR expression upon oncogenic foci-formation by HTLV-1 p30II-GFP and c-Myc were determined by cotransfecting HFL1 fibroblasts and then monitoring the formation of transformed colonies over a three-week period. The scrRNA was included as a negative control. The averaged data from three experiments are shown. (I) The expression of the HTLV-1 p30II-GFP fusion was visualized in the transformed colonies by direct-fluorescence microscopy. DIC phase-contrast images (right panels) are provided for reference.
Fig. 3
Fig. 3
The induction of TIGAR by HTLV-1 p30II prevents the accumulation of oncogene-induced cytotoxic ROS. (A-C) The inhibition of c-Myc-induced ROS by HTLV-1 p30II (HA) or TIGAR (FLAG) was determined by transfecting HT-1080 cells with CβF-c-Myc and then transducing the cultures with pLenti-HTLV-1 p30II (HA) or the empty pLenti 6.2/V5-DEST vector. In certain samples, CMV-TIGAR (FLAG), siRNA-tigar, or the scrRNA control was also included. The cells were stained with the fluorescent ROS-specific chemical probe, CM-H2DCFDA, and the number of ROS-positive cells per field was counted in duplicate or triplicate using fluorescence-microscopy. DIC images are provided for comparison. Replicate data sets are shown for single representative experiments in panels B and C. (D) The expression of TIGAR, c-Myc, and p53 proteins in HT-1080 cells containing HTLV-1 p30II and/or oncogenic c-Myc, and cotransfected with siRNA-tigar or the scrRNA negative control, was detected by SDS-PAGE and immunoblotting. Relative tubulin levels are shown as a protein-loading control. (E) The levels of intracellular ROS in HT-1080 cells expressing various combinations of c-Myc, HTLV-1 p30II (HA), TIGAR (FLAG), or the empty pLenti-6.2/V5-DEST vector and either siRNA-tigar or a scrRNA control were determined by measuring the relative fluorescence-intensities of the CM-H2DCFDA fluorescent probe within individual cells using Carl Zeiss Axiovision 4.8 software. Each data point in the graph represents an average of 19 cells.
Fig. 4
Fig. 4
The infectious HTLV-1 ACH.p30II mutant provirus, defective for p30II production, is impaired for the induction of TIGAR. (A) The expression of TIGAR in HT-1080 cells stably expressing the HTLV-1 ACH.wildtype and ACH.p30II mutant proviral clones was detected by immunoblotting. Actin protein levels are shown for comparison. (B) The induction of TIGAR expression in HT-1080 cells containing the HTLV-1 ACH.wildtype or ACH.p30II mutant provirus was visualized by immunofluorescence-microscopy. Mitochondrial localization of the TIGAR protein was detected by co-labeling the cells with MitoTracker Orange. The expression of HTLV-1 gp21 was detected by immunofluorescence-microscopy. DAPI nuclear-staining is provided in the merged images. The scale bars represent 10 μm. (C) The relative levels of TIGAR protein in cells containing the HTLV-1 ACH.wildtype or ACH.p30II mutant provirus (gp21-positive cells) was measured using Carl Zeiss Axiovision 4.8 software. The graphed data represent 10 individual cells per sample; and the relative fluorescence-intensities of the TIGAR signal were quantified over a constant 5 μm2 surface area in each cell. (D) Equivalent virus production by HT-1080 clones stably expressing the HTLV-1 ACH.wildtype or ACH.p30II mutant provirus was confirmed by quantifying the amounts of extracellular p19Gag core antigen by ELISAs (Zeptometrix). Virus-containing supernatants were collected at 1-week and 2-week intervals; and data from two representative clones are shown relative to an HTLV-1 p19Gag protein standard curve. The SLB1 (HTLV-1-producing) lymphoma cell-line was included as a positive control. (E) The relative levels of TIGAR and c-Myc were compared in HTLV-1-transformed lymphoma T-cell-lines (MJG11 and SLB1) and activated cultured hu-PBMCs. Actin is shown for reference. (F) TIGAR protein expression in HTLV-1-transformed SLB1 lymphoblasts was compared to activated cultured hu-PBMCs obtained from three different donors. (G and H) The TIGAR is overexpressed in cultured (ATL-1, ATL-4, and ATL-7) and primary (ATL-8, ATL-9, ATL-10, ATL-11, and ATL-12) HTLV-1-infected ATL clinical isolates and correlates with increased c-Myc expression, as compared to activated cultured hu-PBMCs. (I) The relative expression of TIGAR in HTLV-1-infected ATL-1 lymphoblasts was compared to uninfected, activated cultured hu-PBMCs by admixing the samples and then immediately performing immunofluorescence-microscopy. The HTLV-1-infected ATL-1 samples were differentially identified by immunostaining to detect gp21. DAPI nuclear-staining is provided in the TIGAR signal (red) micrographs. DIC images are also shown for reference. (J) The relative levels of TIGAR were compared in admixed hu-PBMCs that were either transduced with pLenti-HTLV-1 p30II-GFP or mock treated. DAPI nuclear-staining is provided in the TIGAR signal (red) micrographs; and the HTLV-1 p30II-GFP and TIGAR signals are merged in the DIC overlay images. The scale bars represent 10 μm.
Fig. 5
Fig. 5
siRNA-knockdown of TIGAR expression sensitizes viral and non-viral hematological tumor cells to oncogene-induced ROS. (A and B) The HTLV-1 p30II and TIGAR proteins prevent c-Myc-induced cellular senescence in HT-1080 cells. The cells were first transfected with CβF-c-Myc and/or CMV-TIGAR (FLAG) and then transduced with pLenti-HTLV-1 p30II (HA) or the empty pLenti-6.2/V5-DEST vector. After five days, the cultures were fixed and stained using X-Gal to detect senescence-associated Beta-galactosidase expression (blue signal). Certain samples were also cotransfected with siRNA-tigar or a scrRNA control. The scale bars represent 20 μm. Replicate data sets are shown for a single representative experiment. (C-E) HTLV-1-transformed SLB1 lymphoma cells were repeatedly transfected with siRNA-tigar or a scrRNA control and the cultures were stained using the fluorescent ROS-specific chemical probe, CM-H2DCFDA, and fluorescence-microscopy was performed to visualize and quantify intracellular ROS accumulation (C, top panels). The transfected SLB1 cells were then stained with X-Gal to detect senescence-associated Beta-galactosidase expression (C, lower panels). Wide-field images of cellular senescence (dark stained cells in DIC + X-Gal) are provided below the color micrographs. The chemical uncoupler, CCCP, was included as a positive control. (F) The expression of TIGAR and c-Myc in acute lymphoblastic leukemia (ALL: CCRF-CEM, CCRF-HSB2, Molt-4, and Rs4;11), multiple myeloma (MM: MM.1R, NCI-H929, RPMI 8226, and U266B1), and Sezary syndrome (SS: HuT-78) tumor cell-lines, compared to activated cultured hu-PBMCs, was detected by immunoblotting. Actin protein levels are shown for reference. (G and H) ALL (RS4;11) and MM (NCI-H929) tumor cell-lines were repeatedly transfected with siRNA-tigar or a scrRNA control, and then stained with CM-H2DCFDA to detect intracellular ROS by fluorescence-microscopy. CCCP was included as a positive control. Replicate data sets for representative individual experiments are shown in the graphs.

References

    1. Arnold J, Zimmerman B, Li M, Lairmore MD, Green PL. Human T-cell leukemia virus type-1 antisense-encoded gene, Hbz, promotes T-lymphocyte proliferation. Blood. 2008;112:3788–3797. - PMC - PubMed
    1. Awasthi S, Sharma A, Wong K, Zhang J, Matlock EF, Rogers L, Motloch P, Takemoto S, Taguchi H, Cole MD, Luscher B, Dittrich O, Tagami H, Nakatani Y, McGee M, Girard AM, Gaughan L, Robson CN, Monnat RJ, Jr, Harrod R. A human T-cell lymphotropic virus type 1 enhancer of Myc transforming potential stabilizes Myc-TIP60 transcriptional interactions. Mol Cell Biol. 2005;25:6178–6198. - PMC - PubMed
    1. Bangham CR, Ratner L. How does HTLV-1 cause adult T-cell leukaemia/lymphoma (ATL)? Curr Opin Virol. 2015;14:93–100. - PMC - PubMed
    1. Bartoe JT, Albrecht B, Collins ND, Robek MD, Ratner L, Green PL, Lairmore MD. Functional role of pX open reading frame II of human T-lymphotropic virus type 1 in maintenance of viral loads in vivo. J Virol. 2000;74:1094–1100. - PMC - PubMed
    1. Bellon M, Baydoun HH, Yao Y, Nicot C. HTLV-I Tax-dependent and –independent events associated with immortalization of human primary T lymphocytes. Blood. 2010;115:2441–2448. - PMC - PubMed

Publication types

MeSH terms

Substances