Review
. 2018 Feb 16;18(2):609.
doi: 10.3390/s18020609.

Recent Advances in Active Infrared Thermography for Non-Destructive Testing of Aerospace Components

Affiliations
Review

Recent Advances in Active Infrared Thermography for Non-Destructive Testing of Aerospace Components

Francesco Ciampa et al. Sensors (Basel). .

Abstract

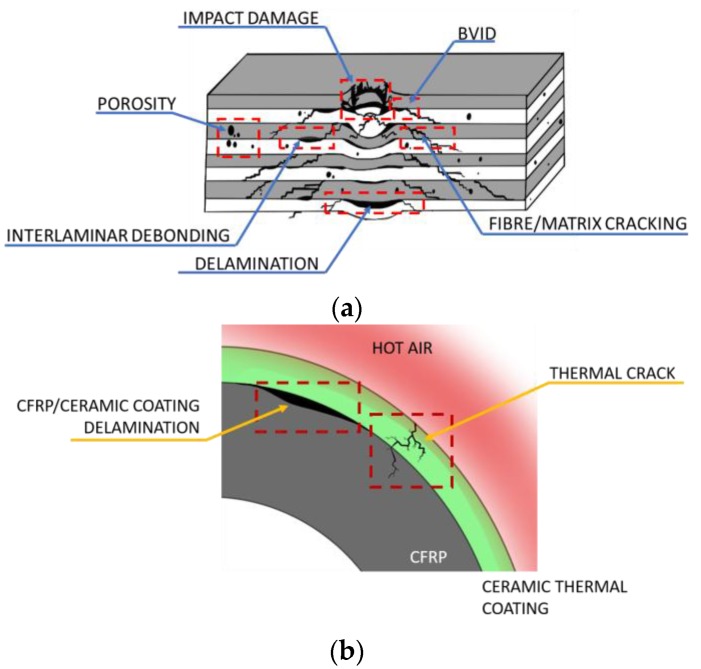
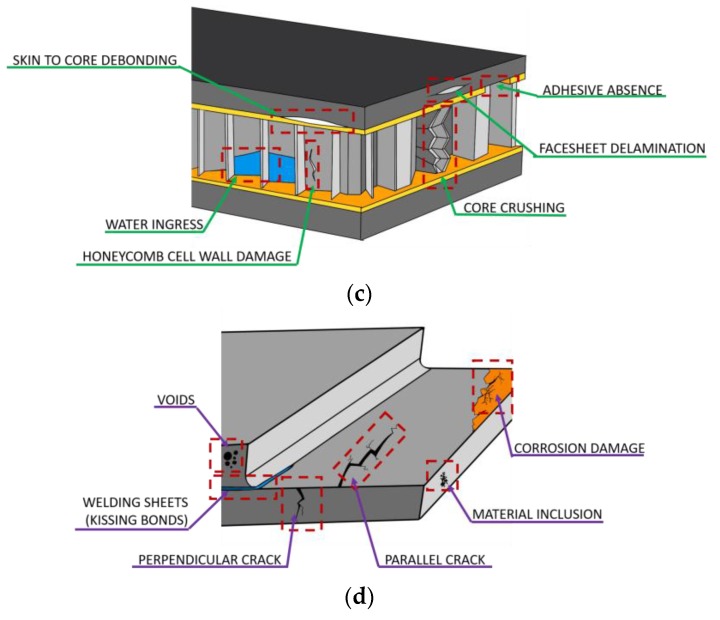
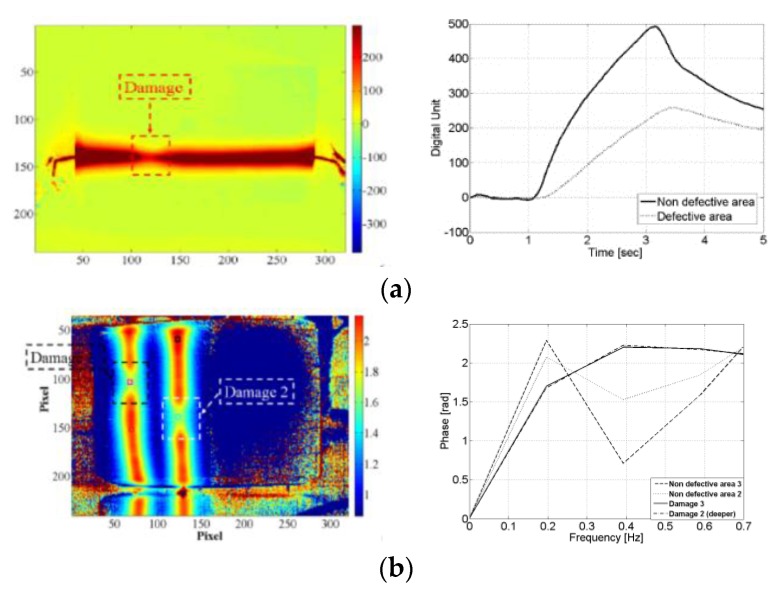
Active infrared thermography is a fast and accurate non-destructive evaluation technique that is of particular relevance to the aerospace industry for the inspection of aircraft and helicopters' primary and secondary structures, aero-engine parts, spacecraft components and its subsystems. This review provides an exhaustive summary of most recent active thermographic methods used for aerospace applications according to their physical principle and thermal excitation sources. Besides traditional optically stimulated thermography, which uses external optical radiation such as flashes, heaters and laser systems, novel hybrid thermographic techniques are also investigated. These include ultrasonic stimulated thermography, which uses ultrasonic waves and the local damage resonance effect to enhance the reliability and sensitivity to micro-cracks, eddy current stimulated thermography, which uses cost-effective eddy current excitation to generate induction heating, and microwave thermography, which uses electromagnetic radiation at the microwave frequency bands to provide rapid detection of cracks and delamination. All these techniques are here analysed and numerous examples are provided for different damage scenarios and aerospace components in order to identify the strength and limitations of each thermographic technique. Moreover, alternative strategies to current external thermal excitation sources, here named as material-based thermography methods, are examined in this paper. These novel thermographic techniques rely on thermoresistive internal heating and offer a fast, low power, accurate and reliable assessment of damage in aerospace composites.

Keywords: aerospace structures; composite materials; infrared thermography; material damage; non-destructive evaluation; smart materials.


Conflict of interest statement

The authors declare no conflict of interest.

Figures

Figure 1
Figure 1
Illustration of typical material defects monitored by IRT for composite aircraft and spacecraft structures (a); jet engine turbine blades (b); honeycomb panels (c) and metallic aircraft and spacecraft components (d).
Figure 1
Figure 1
Illustration of typical material defects monitored by IRT for composite aircraft and spacecraft structures (a); jet engine turbine blades (b); honeycomb panels (c) and metallic aircraft and spacecraft components (d).
Figure 2
Figure 2
Schematic diagram of optically stimulated thermography (OST).
Figure 3
Figure 3
PT results obtained during EVA inspections of a CFRP component of the Space Shuttle (a) and a damaged ISS radiator (b), from [63].
Figure 4
Figure 4
Comparison between PT thermal results from raw data (a); Differential Absolute Contrast (DAC) method (b) and Gapped Smoothing Algorithm (GSA) (c), with permission from [50].
Figure 5
Figure 5
PPT phase results on a single lap joints with CFRP adherends undergone to different fatigue loading cycles, with permission from [57]. Each subfigure corresponds to the thermal phase image of the composite sample after 200 cycles (a); 400 cycles (b); 400 cycles and pretension (c) and 600 cycles (d).
Figure 6
Figure 6
Illustration of the wing and its schematic representation analysed with LIT, from [73]. Unit measures in Figure 6d are in mm.
Figure 7
Figure 7
Ampligram (a) and phasegram (b) obtained with LIT testing of a titanium alloy honeycomb sandwich structure with disbond, with permission from [74].
Figure 8
Figure 8
Lock-in thermography amplitude and phase images on a GFRP composite plate with artificial defects, with permission from [84].
Figure 9
Figure 9
Experimental set-up for laser scanning thermography, with permission from [90].
Figure 10
Figure 10
Laser-spot thermography result on fatigue damaged aluminium sample, from [93].
Figure 11
Figure 11
Experimental set-up of ultrasonic stimulated thermography, from [98].
Figure 12
Figure 12
Experimental set-up of ultrasonic stimulated thermography, with permission from [98].
Figure 13
Figure 13
Ultrasonic lock-in thermography results on a composite panel with BVID, with permission from. Figure (a,c) shows the lock-in results with delamination at −45° and +/−45°, and −45° and 90° respectively, whilst figure (b,d) illustrates the apparent temperature results at 0.04 Hz and 0.1 Hz, respectively. [110].
Figure 14
Figure 14
Modelling of impact damage as a pyramid-like defect shape (a) and the comparison between experimental and numerical temperature results (b), from [114].
Figure 15
Figure 15
Vibration patterns at the GFRP specimen at 3.4 kHz (a) and at the LDR frequency, 20.9 kHz, on a GFRP sample (b), with permission from [119].
Figure 16
Figure 16
Nonlinear ultrasonic stimulated results thermography on a composite stiffened panel while conducting a sweep between 20 kHz and 30 kHz, with permission from [28].
Figure 17
Figure 17
System set-up diagram (a) and experimental set-up (b) of pulsed ECST, with permission from [125].
Figure 18
Figure 18
ECST results combined with PCT on a CFRP composite sample impacted at 6 J (a); 8 J (b); 10 J (c) and 12 J (d), with permission from [135].
Figure 19
Figure 19
Comparison between eddy current stimulated thermography (a) and ultrasonic C-Scan (b) on impact damaged CFRP sample, with permission from [139].
Figure 20
Figure 20
Illustration of the “singular method” (a) and the “insulation method” (b), with permission from [31].
Figure 21
Figure 21
Schematic of the technique developed by Suzuki et al.: difference in the path of the electrical current in the case of undamaged and indented areas, with permission from [148].
Figure 22
Figure 22
HEL laminates: Schematic lay-up of the HEL laminates and specifications of the different laminates prepared during the experimental campaign, with permission from [32].
Figure 23
Figure 23
CNT/Alumina hybrid composite: internal nanoscale interaction between alumina fibres and carbon nanotubes, with permission from [154].
Figure 24
Figure 24
SMArt multifunctional laminate: time history of the temperature difference variation between damaged and undamaged part (4 plies CFRP in cross-ply stacking sequence, single damage) (a); phase profile of two different damage sites (16 plies, cross-ply stacking sequence, multi-damage) (b), with permission from [34].

References

    1. Boccardi S., Boffa N.D., Carlomagno G.M., Maio L., Meola C., Ricci F. Infrared thermography and ultrasonics to evaluate composite materials for aeronautical applications. J. Phys. 2015;658:012007. doi: 10.1088/1742-6596/658/1/012007. - DOI
    1. Montesano J., Bougherara H., Fawaz Z. Application of infrared thermography for the characterization of damage in braided carbon fiber reinforced polymer matrix composites. Compos. Part B Eng. 2014;60:137–143. doi: 10.1016/j.compositesb.2013.12.053. - DOI
    1. De Angelis G., Dati E., Bernabei M., Betti L., Menner P. Non Destructive Investigation of disbonding damage in air cooling inlet composite panel using active thermography and shearography. MAYFEB J. Mater. Sci. 2016;1:10–20.
    1. Ranjit S., Choi M., Kim W. Quantification of defects depth in glass fiber reinforced plastic plate by infrared lock-in thermography. J. Mech. Sci. Technol. 2016;30:1111–1118. doi: 10.1007/s12206-016-0215-5. - DOI
    1. Rana S., Fangueiro R., editors. Advanced Composite Materials for Aerospace Engineering: Processing, Properties and Applications. Woodhead Publishing; Cambridge, UK: 2016.