. 2019 Jul;10(3):346-363.
doi: 10.1177/1947603518756985. Epub 2018 Feb 20.

In Vitro Analysis of Cartilage Regeneration Using a Collagen Type I Hydrogel (CaReS) in the Bovine Cartilage Punch Model

Affiliations

In Vitro Analysis of Cartilage Regeneration Using a Collagen Type I Hydrogel (CaReS) in the Bovine Cartilage Punch Model

Victoria Horbert et al. Cartilage. 2019 Jul.

Abstract

Objective: Limitations of matrix-assisted autologous chondrocyte implantation to regenerate functional hyaline cartilage demand a better understanding of the underlying cellular/molecular processes. Thus, the regenerative capacity of a clinically approved hydrogel collagen type I implant was tested in a standardized bovine cartilage punch model.

Methods: Cartilage rings (outer diameter 6 mm; inner defect diameter 2 mm) were prepared from the bovine trochlear groove. Collagen implants (± bovine chondrocytes) were placed inside the cartilage rings and cultured up to 12 weeks. Cartilage-implant constructs were analyzed by histology (hematoxylin/eosin; safranin O), immunohistology (aggrecan, collagens 1 and 2), and for protein content, RNA expression, and implant push-out force.

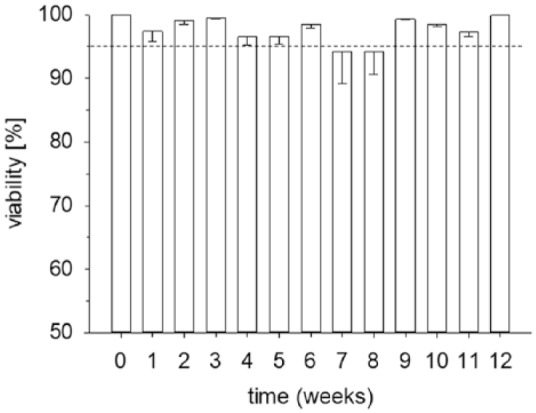
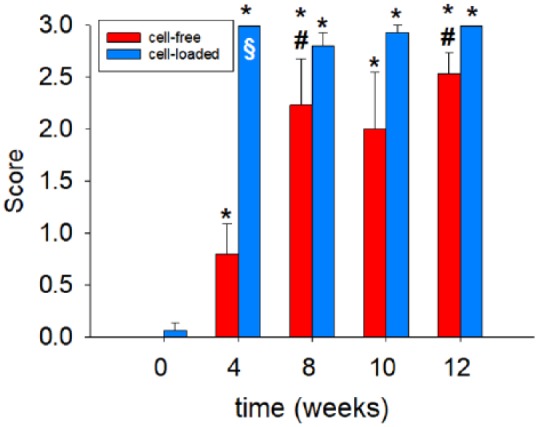
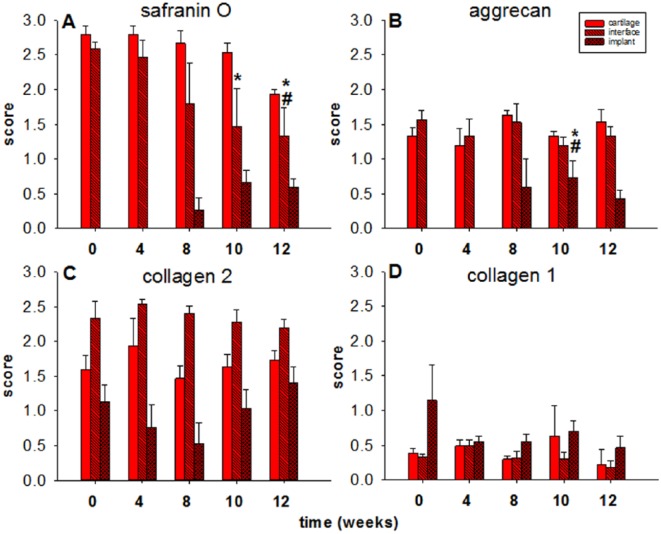
Results: Cartilage-implant constructs revealed vital morphology, preserved matrix integrity throughout culture, progressive, but slight proteoglycan loss from the "host" cartilage or its surface and decreasing proteoglycan release into the culture supernatant. In contrast, collagen 2 and 1 content of cartilage and cartilage-implant interface was approximately constant over time. Cell-free and cell-loaded implants showed (1) cell migration onto/into the implant, (2) progressive deposition of aggrecan and constant levels of collagens 1 and 2, (3) progressively increased mRNA levels for aggrecan and collagen 2, and (4) significantly augmented push-out forces over time. Cell-loaded implants displayed a significantly earlier and more long-lasting deposition of aggrecan, as well as tendentially higher push-out forces.

Conclusion: Preserved tissue integrity and progressively increasing cartilage differentiation and push-out forces for up to 12 weeks of cultivation suggest initial cartilage regeneration and lateral bonding of the implant in this in vitro model for cartilage replacement materials.

Keywords: (immuno)histology; bovine cartilage punch model; collagen type I hydrogel; implant push-out force; matrix-associated cartilage transplantation (MACT).


Conflict of interest statement

Declaration of Conflicting Interests: The author(s) declared the following potential conflicts of interest with respect to the research, authorship, and/or publication of this article: T.Graeve is a member of the Amedrix GmbH.

Figures

Figure 1.
Figure 1.
Scheme of the in vitro model. For embedding of the cartilage-implant constructs, hot liquid agarose (2%) was added into the wells of a 48-well plate (A). Cylindrical pockets of a defined size (6 mm) were created by inserting a metal-pin plate into the hot agarose until it gelated (B, C). The central defects of the cartilage rings (diameter 2 mm) were filled with the collagen implant (cell-free/cell-loaded; diameter 6 mm) using forceps (C1) and, after embedding the resulting constructs into the agarose (D), culture medium was added (E). After in vitro culture, cartilage-implant constructs were subjected to histological characterization. Also, gene expression of chondrocytes isolated from the “host” cartilage, cells on the cartilage surface, and the collagen implant was analyzed (F). At the protein level, the amount of cartilage components released into the supernatant, as well as the remaining content in “host” cartilage rings and the cells located on the cartilage surface was quantified.
Figure 2.
Figure 2.
Hematoxylin and eosin staining of the cartilage-implant constructs (cell-free or cell-loaded implants) after placement into the inner defect of the cartilage rings and subsequent culture for 0, 4, 8, 10, or 12 weeks. Morphological characteristics of the cells in cartilage, implant and at the cartilage-implant interface; # proliferation-induced cell clusters; → empty chondrocyte lacunae; * cellular multilayer.
Figure 3.
Figure 3.
Viability of the chondrocytes in the cartilage ring throughout culture. Chondrocytes were enzymatically isolated from the cartilage at weekly intervals and cultivated for 1 day. Viability was assessed using fluorescein diacetate/propidium iodide staining. Data are expressed as means ± standard error of the mean (SEM); the dashed line indicates a viability of 95%.
Figure 4.
Figure 4.
Semiquantitative scoring of cell migration onto/into the collagen implants after culture for 0, 4, 8, 10, or 12 weeks (cell-free; cell-loaded). Degree of migration: 0 = implant without cells, 1 = single adherent cells, 2 = several adherent cells, 3 = cell layer on implant; values are shown as means ± standard error of the mean (SEM); symbols indicate P ≤ 0.05 versus *0 weeks and #4 weeks; §versus cell-free.
Figure 5.
Figure 5.
(Immuno)staining of the collagen implants (cell-free) after placement into the inner defect of the cartilage rings and subsequent culture for 0, 4, 8, 10, or 12 weeks. Safranin O staining and immunostaining for aggrecan, collagen 2, and collagen 1 (for quantification see Fig. 6 ); staining with (isotype-matched) control immunoglobulins consistently yielded negative results.
Figure 6.
Figure 6.
Semiquantitative analysis of “host” cartilage, interface, and collagen implants (cell-free). Score: 0 = no staining, 1 = weak staining, 2 = moderate staining, 3 = strong staining; values are shown as means ± standard error of the mean (SEM); symbols indicate P ≤ 0.05 versus *0 weeks, #4 weeks.
Figure 7.
Figure 7.
Real-time polymerase chain reaction analysis for aggrecan, collagen 1, and collagen 2 (cell-free implants). mRNA expression for aggrecan (A), collagen 2 (B), collagen 1 (C), aggrecan/collagen 1 ratio (D), and collagen 2/collagen 1 ratio (E) was determined prior to and after 4, 8, 10, and 12 weeks of in vitro culture; relative gene expression of the cells located in the “host” cartilage matrix (cartilage), on the cartilage surface (cartilage surface), and on/in the collagen implant (implant); values are expressed as means ± standard error of the mean (SEM); symbols indicate P ≤ 0.05 *versus 0 weeks; #versus 4 weeks; xversus 8 weeks; +versus 10 weeks.
Figure 8.
Figure 8.
(Immuno)staining of the collagen implants (cell-loaded) after placement into the inner defect of the cartilage rings and subsequent culture for 0, 4, 8, 10, or 12 weeks. Safranin O staining and immunostaining for aggrecan, collagen 2, and collagen 1 (for quantification see Fig. 9 ); staining with (isotype-matched) control immunoglobulins consistently yielded negative results.
Figure 9.
Figure 9.
Semiquantitative analysis of “host” cartilage, interface, and collagen implants (cell-loaded). Score: 0 = no staining, 1 = weak staining, 2 = moderate staining, 3 = strong staining; values are shown as means ± standard error of the mean (SEM); symbols indicate P ≤ 0.05 versus *0 weeks, #4 weeks, +10 weeks; §versus cell-free.
Figure 10.
Figure 10.
Real time polymerase chain reaction analysis for aggrecan, collagen 1, and collagen 2 (cell-loaded implants). mRNA expression for aggrecan (A), collagen 2 (B), collagen 1 (C), aggrecan/collagen 1 ratio (D) and collagen 2/collagen 1 ratio (E) was determined prior to and after 4, 8, 10, and 12 weeks of in vitro culture; relative gene expression of the cells located in the “host” cartilage matrix (cartilage), on the cartilage surface (cartilage surface), and on/in the collagen implant (implant); values are expressed as means ± standard error of the mean (SEM); symbols indicate P ≤ 0.05 versus #4 weeks; §versus cell-free.
Figure 11.
Figure 11.
Biomechanical push-out testing of the cartilage-implant constructs (cell-free or cell-loaded implants). Values are expressed as means ± standard error of the mean (SEM); the symbols indicate P ≤ 0.05 *versus 0 weeks; #versus 4 weeks.

References

    1. Hunziker EB. Articular cartilage repair: basic science and clinical progress. A review of the current status and prospects. Osteoarthritis Cartilage. 2002;10(6):432-63. - PubMed
    1. Musumeci G, Castrogiovanni P, Leonardi R, Trovato FM, Szychlinska MA, Di Giunta A, et al. New perspectives for articular cartilage repair treatment through tissue engineering: a contemporary review. World J Orthop. 2014;5(2):80-8. - PMC - PubMed
    1. Dell’Accio F, De Bari C, El Tawil NM, Barone F, Mitsiadis TA, O’Dowd J, et al. Activation of WNT and BMP signaling in adult human articular cartilage following mechanical injury. Arthritis Res Ther. 2006;8(5):R139. - PMC - PubMed
    1. Ye K, Di Bella C, Myers DE, Choong PF. The osteochondral dilemma: review of current management and future trends. ANZ J Surg. 2014;84(4):211-7. - PubMed
    1. Kon E, Verdonk P, Condello V, Delcogliano M, Dhollander A, Filardo G, et al. Matrix-assisted autologous chondrocyte transplantation for the repair of cartilage defects of the knee: systematic clinical data review and study quality analysis. Am J Sports Md. 2009;37(Suppl 1):156S-66S. - PubMed

Publication types

LinkOut - more resources