. 2018 May 15;78(10):2589-2600.
doi: 10.1158/0008-5472.CAN-17-2933. Epub 2018 Feb 20.

Truncated Glioma-Associated Oncogene Homolog 1 (tGLI1) Mediates Mesenchymal Glioblastoma via Transcriptional Activation of CD44

Affiliations

Truncated Glioma-Associated Oncogene Homolog 1 (tGLI1) Mediates Mesenchymal Glioblastoma via Transcriptional Activation of CD44

Tadas K Rimkus et al. Cancer Res. .

Erratum in

Abstract

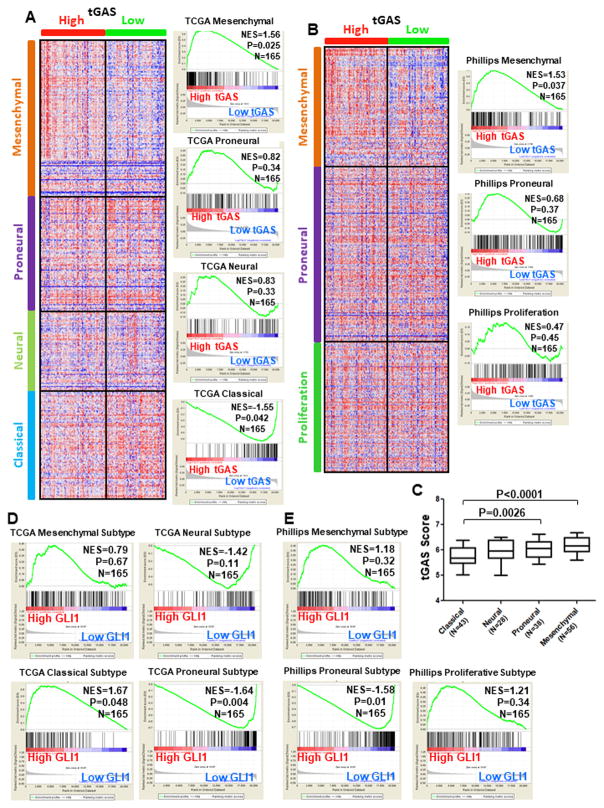
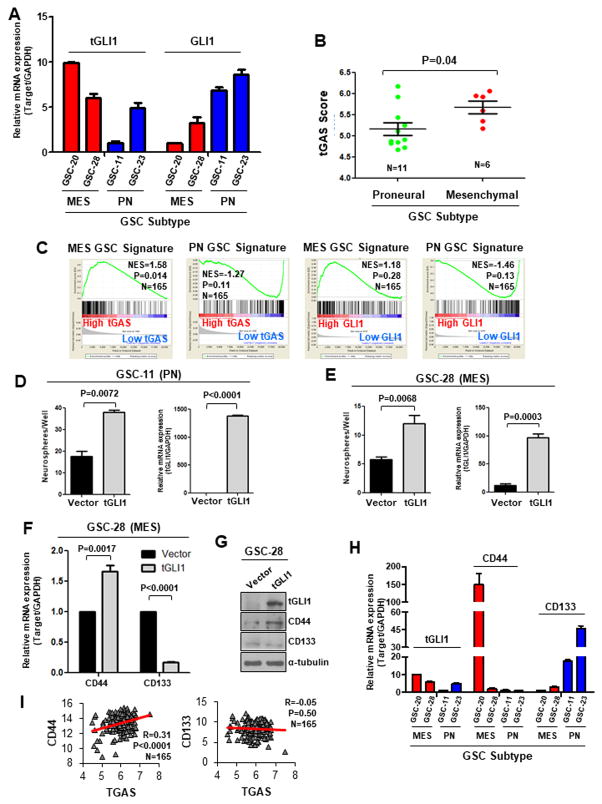
The molecular pathways driving mesenchymal glioblastoma (GBM) are still not well understood. We report here that truncated glioma-associated oncogene homolog 1 (tGLI1) is a tumor-specific transcription factor that facilitates GBM growth, is enriched in the mesenchymal subtype of GBM and glioma stem cells (GSC), and promotes mesenchymal GSC by upregulating transcription of CD44. In an orthotopic GBM xenograft mouse model, tGLI1-overexpressing tumors grew more aggressively with increased proliferation and angiogenesis compared with control and GLI1-overexpressing xenografts. tGLI1 was highly expressed in GBM clinical specimens but undetectable in normal brains, whereas GLI1 was expressed in both tissues. A tGLI1 activation signature (tGAS) correlated with glioma grade, tumor angiogenesis, and poor overall survival, and GBMs with high tGAS were enriched with mesenchymal GBM/GSC gene signatures. Neurospheres contained increased levels of tGLI1, but not GLI1, compared with the monolayer culture; mesenchymal GSC expressed more tGLI1 than proneural GSC. Ectopic tGLI1 expression enhanced the ability of mesenchymal GSC to yield neurospheres in vitro and to form tumors in mouse brains. Selective tGLI1 knockdown reduced neurosphere formation of GBM cells. tGLI1 bound to and transactivated the promoter of the CD44 gene, a marker and mediator for mesenchymal GSC, leading to its expression. Collectively, these findings advance our understanding of GBM biology by establishing tGLI1 as a novel transcriptional activator of CD44 and a novel mediator of mesenchymal GBM and GSC.Significance: These findings highlight the role of a tumor-specific gain-of-function transcription factor tGLI1 in mesenchymal glioma stem cell maintenance and mesenchymal GBM growth. Cancer Res; 78(10); 2589-600. ©2018 AACR.


Conflict of interest statement

The authors declare no conflicts of interest.

Figures

Figure 1
Figure 1. tGLI1 is expressed in a tumor-specific fashion and promotes intracranial GBM growth
A) Isogenic G48LL2 GBM cell lines carrying lentiviral mock, GLI1, or tGLI1 vector were subjected to immunoblotting for GLI1 and tGLI1 expression (top panel). Expression levels for GLI1 and tGLI1 in these cell lines are similar to those found in GBM specimens as shown by IHC (bottom panel). B) tGLI1 rendered GBM more aggressive in growth. Isogenic luciferase-expressing G48LL2 cell lines were injected into the right frontal lobe of female nude mice (N=5 per group) and tumor growth was assessed weekly via bioluminescent imaging. C) Representative bioluminescent images of actively growing tumors at Day 56. D) Representative bioluminescent images of ex vivo mouse brains. E–I) tGLI1-overexpressing GBM xenografts were more proliferative and more vascularized Mouse brains were subjected to H&E staining and IHC with indicated antibodies. Immunostained sections were scored by a pathologist and H-scores were calculated. Panel I shows representative IHC images. J–K) tGLI1 is highly expressed in GBM specimens but not in normal brain tissues. A cohort of normal healthy brain tissues (N=80) and GBM patient samples (N=63) were subjected to IHC using GLI1- and tGLI1-specific antibodies. Immunostained sections were scored by a pathologist to derive H-scores. Panel K shows representative IHC images. Student’s t-test was used to compute p-values.
Figure 2
Figure 2. High tGAS is associated with poor overall survival of GBM patients and increased angiogenesis of GBM samples
A–B) tGLI1 is most activated in GBM across four grades of gliomas. tGAS scores (A) and GLI1 mRNA expression (B) were determined for patient tumors in GSE4290 dataset across normal healthy brain and glioma samples. Student’s t-test was used to compute p-values. NS, non-significant. C) Increased tGLI1 activity is independently associated with poor overall survival of GBM patients. Univariate and multivariate COX proportional hazards were calculated using tGAS score, GLI1 expression, patient age, patient sex, Karnofsky Performance Score (KPS), and tumor size as variables. HR, hazard ratio. The TCGA GBM dataset was used with the outcome variable being overall survival. D–E) Patients with high tGAS in their GBMs had worse overall survival compared to those to low tGAS. Kaplan-Meier survival graphs were drawn using high or low tGAS score (D) or GLI1 expression (E) and data from the TCGA GBM dataset. Log-rank method was used to compute p-values. F–I) tGAS positively correlated with GBM angiogenesis. tGAS score (F–G) or GLI1 expression (H–I) was correlated with markers of tumor vascularity using CD31 (F,H) and VE-cadherin (G,I) using regression analysis. J–K) GBMs with high tGAS were enriched with angiogenesis gene signature. GSEA was performed using the AngioMatrix signature that is representative of GBM angiogenesis. Patients were separated by high or low tGAS score (J) or GLI1 expression (K) using the TCGA GBM dataset. L–M) A positive correlation between tGAS and angiogenesis in GBM specimens. AngioMatrix signature score was correlated with tGAS score (L) or GLI1 expression (M) using the TCGA GBM dataset.
Figure 3
Figure 3. GBMs with high tGAS are enriched with the mesenchymal GBM gene signatures
The TCGA dataset with the gene expression profile of 165 GBMs was used. A–B) GBM tumors with high tGAS were enriched for the TCGA and Phillips mesenchymal gene signatures, but not for those for the other subtypes. Heat maps were drawn using Morpheus software with patients separated by high or low tGAS score using genes in the signatures for each of the four TCGA GBM subtypes (A) or the three Phillips GBM subtypes (B). Right: GSEA. C) The mesenchymal subtype of GBMs had the highest tGAS scores among the four TCGA subtypes. tGAS score was determined for the four TCGA GBM subtypes. D–E) High GLI1 mRNA expression was not associated with either the TCGA or the Phillips mesenchymal subtype, but associated with the TCGA classical subtype. GSEA was performed using the signatures for the TCGA GBM subtypes (D) or the Phillips GBM subtypes and patients were separated by high or low GLI1 mRNA expression.
Figure 4
Figure 4. tGLI1 promotes neurosphere formation and transcriptionally activates CD44 expression
A) tGLI1 was significantly enriched in the neurospheres compared to the monolayer GBM cells. G48LL2 and BTCOE 4810 cell lines were collected under monolayer and neurosphere-forming conditions. Total RNA from cells were subjected to qPCR for tGLI1 and GLI1 levels. B–C) tGLI1-overexpressing cells formed significantly more neurospheres, suggesting an increase in the stem-like cell population. G48LL2 (B) and U373MG (C) cells with stable expression of vector, GLI1, or tGLI1 were subjected to the neurosphere assay. D) tGLI1 knockdown significantly inhibited neurosphere formation. U373MG cells transfected with the tGLI1-targeting or non-targeting control LNA oligos were subjected to the neurosphere assay. E) tGLI1 enhanced CD44 expression. Total RNA from G48a cells with stable expression of either vector or tGLI1 were subjected to qPCR for the indicated genes. F) tGLI1-expressing GBM cells had increased CD44(+) cells. Isogenic G48LL2 cell lines with stable expression of control or tGLI1 vector were subjected to flow cytometry with CD44 or CD133 antibodies. G) Preferential binding of tGLI1, but not GLI1, to the CD44 promoter. U373MG cells with transient expression of control vector or tGLI1 were subjected to the ChIP assay followed by PCR using primers for three regions of the CD44 gene promoter. H) tGLI1 transactivated the CD44 promoter in two GBM cell lines and HEK293 cells. Cells were transiently transfected with control or tGLI1 vector along with the CD44 promoter luciferase reporter, stimulated with SHH (100ng/mL) for 4 hrs, and subjected to the luciferase assay. I) SHH stimulation enhanced tGLI1-mediated activation of the CD44 gene promoter. BTCOE 4795 and U373MG cell lines were transiently transfected with control or tGLI1 vector together with the CD44 promoter luciferase reporter. Cells were then treated with or without SHH (100 ng/mL) for 4 hrs, harvested, and subjected to the luciferase assay. Student’s t-test was performed to calculate p-values. NS, not significant. All experiments were done at least three times to derive means and standard deviations.
Figure 5
Figure 5. tGLI1 is preferentially expressed and activated in the mesenchymal subtype of GSCs
A) MES GSC neurospheres expressed higher levels of tGLI1 and lower levels of GLI1 compared to PN GSC neurospheres. Four different GSCs previously characterized as MES or PN subtype were subjected to total RNA extraction followed by RT-qPCR for tGLI1 and GLI1 expression levels. B) tGAS was significantly higher in MES GSC neurospheres (GSC-20 and GSC-28) compared to the PN GSC neurospheres (GSC-11 and GSC-23). tGAS scores were calculated for PN GSC (N=11) and MES GSC (N=6) lines that were isolated and profiled for expression by Bhat et al. (8). C) GBMs with high tGAS are enriched for the MES GSC signature, but not the PN GSC signature. The TCGA GBM dataset was analyzed by GSEA for the extent of enrichment with the MES and PN GSC signatures (8). Patients were divided into two groups according to tGAS (left) or GLI1 expression (right). D–E) tGLI1 overexpression increased neurosphere-forming capability of both PN (D) and MES (E) GSCs. GSC-11 (PN) and GSC-28 (MES) neurospheres transiently transfected with control vector or tGLI1 vector were subjected to the neurosphere assay (left) and RT-qPCR for tGLI1 expression levels (right). F–G) tGLI1 increased CD44 and decreased CD133 expression at the mRNA (F) and protein levels (G). H) High tGLI1-expressing MES GSC neurospheres expressed higher levels of CD44 and lower levels of CD133, compared to low tGLI1-expressing PN GSC neurospheres. Extracted total RNA was subjected to RT-qPCR for expression of tGLI1, CD44, and CD133. I) A positive correlation between tGAS and CD44, but not CD133 in GBM cohort (N=165). tGAS score was correlated with expression levels of CD44 or CD133 in the TCGA GBM dataset using Pearson correlation. Student’s t-test was used to calculate p-values.
Figure 6
Figure 6. Increased tGLI1 expression enhanced the propensity of GSC to form xenografts
A) Generation of isogenic GSC-28 cells with stable expression of control, GLI1, or tGLI1 vector. GSC neurospheres were analyzed by immunoblotting for GLI1 and tGLI1 levels (top panel). Expression levels for GLI1 and tGLI1 in these GSC lines are similar to those found in GBM specimens as shown by IHC (bottom panel). All GSC lines were maintained as neurospheres. B) GSC-28 cells expressing tGLI1 formed larger tumors compared to GLI1- or vector-expressing cells. Isogenic lines were implanted into the right frontal lobe of nude mice (N=6 per group) and tumor growth was assessed weekly via bioluminescent imaging. C) Representative images of actively growing tumors from animals. D) Representative images of ex vivo mouse brains. E) Mice bearing ectopic tGLI1-expressing GSC-28 xenografts had a shortened survival time. Kaplan-Meier survival graph is shown. Log rank test was used to determine p-values. F) Mouse brains were subjected to H&E staining and IHC with indicated antibodies. Representative images are shown. G–J) tGLI1-expressing GSC-28 tumors had the highest proliferative index and microvessel density. Immunostained mouse brains were scored to determine H-scores. Student’s t-test was used to compute p-values.

References

    1. Kumthekar PU, Macrie BD, Singh SK, Kaur G, Chandler JP, Sejpal SV. A review of management strategies of malignant gliomas in the elderly population. American Journal of Cancer Research. 2014;4:436–44. - PMC - PubMed
    1. Ostrom QT, Gittleman H, Farah P, Ondracek A, Chen Y, Wolinsky Y, et al. CBTRUS Statistical Report: Primary Brain and Central Nervous System Tumors Diagnosed in the United States in 2006–2010. Neuro-Oncology. 2013;15:ii1–ii56. - PMC - PubMed
    1. Phillips HS, Kharbanda S, Chen R, Forrest WF, Soriano RH, Wu TD, et al. Molecular subclasses of high-grade glioma predict prognosis, delineate a pattern of disease progression, and resemble stages in neurogenesis. Cancer Cell. 2006;9:157–73. - PubMed
    1. Verhaak RGW, Hoadley KA, Purdom E, Wang V, Qi Y, Wilkerson MD, et al. An integrated genomic analysis identifies clinically relevant subtypes of glioblastoma characterized by abnormalities in PDGFRA, IDH1, EGFR and NF1. Cancer cell. 2010;17:98. - PMC - PubMed
    1. Colman H, Zhang L, Sulman EP, McDonald JM, Shooshtari NL, Rivera A, et al. A multigene predictor of outcome in glioblastoma. Neuro-Oncology. 2010;12:49–57. - PMC - PubMed

Publication types

MeSH terms