. 2018 Apr 16;38(9):e00001-18.
doi: 10.1128/MCB.00001-18. Print 2018 May 1.

Mutant Isocitrate Dehydrogenase 1 Disrupts PKM2-β-Catenin-BRG1 Transcriptional Network-Driven CD47 Expression

Affiliations

Mutant Isocitrate Dehydrogenase 1 Disrupts PKM2-β-Catenin-BRG1 Transcriptional Network-Driven CD47 Expression

Pruthvi Gowda et al. Mol Cell Biol. .

Abstract

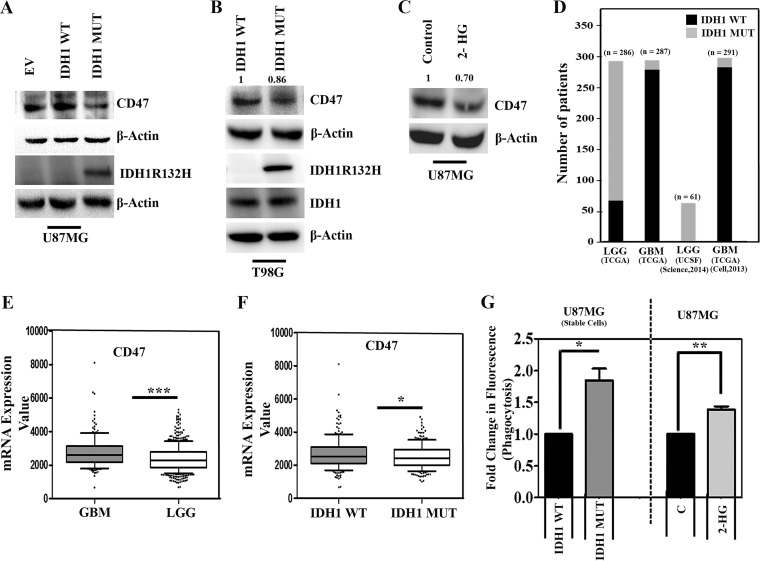
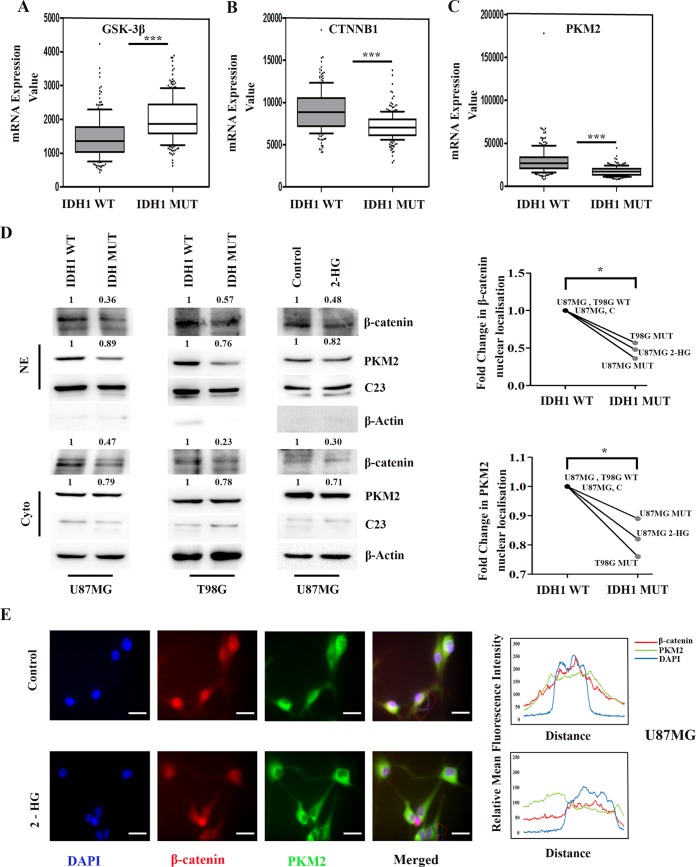
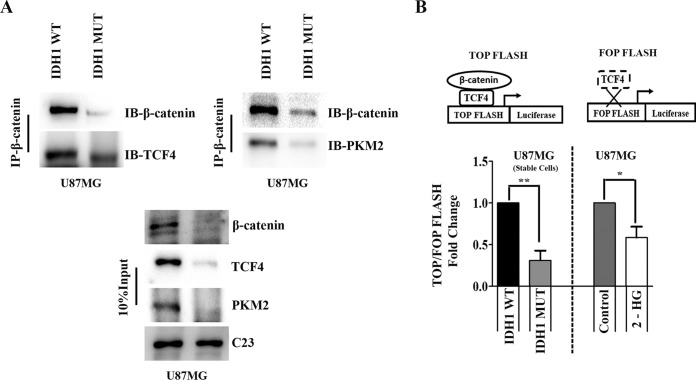
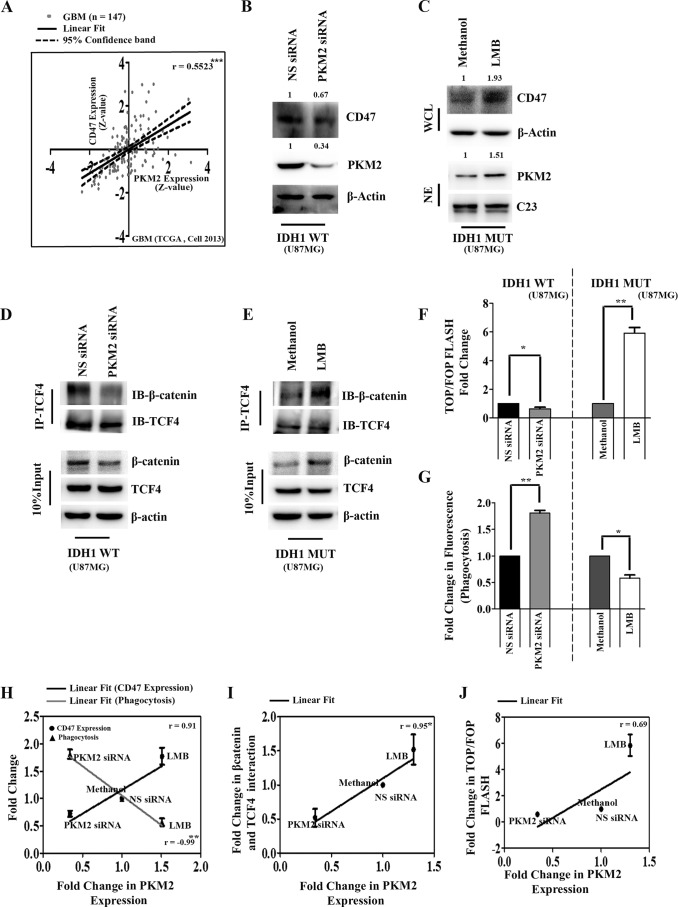
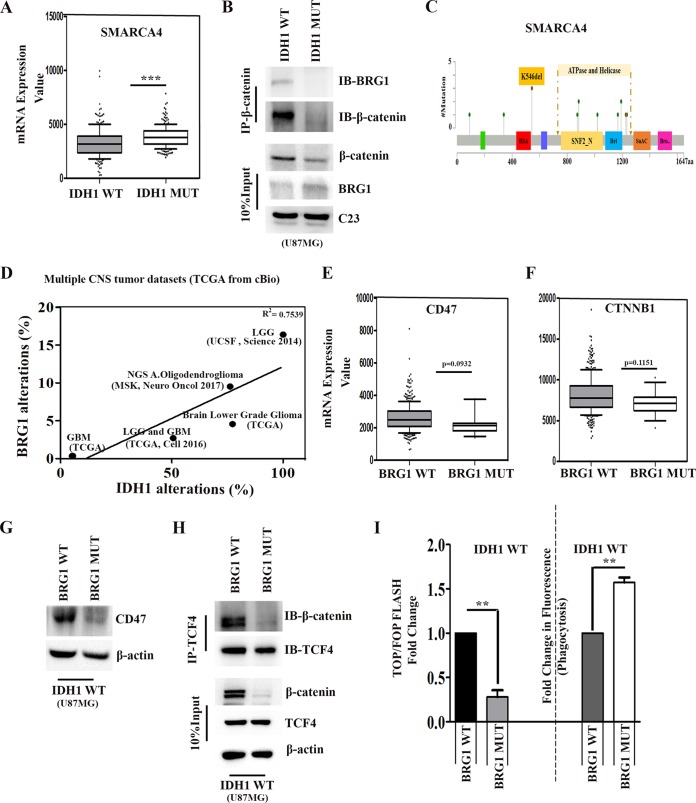
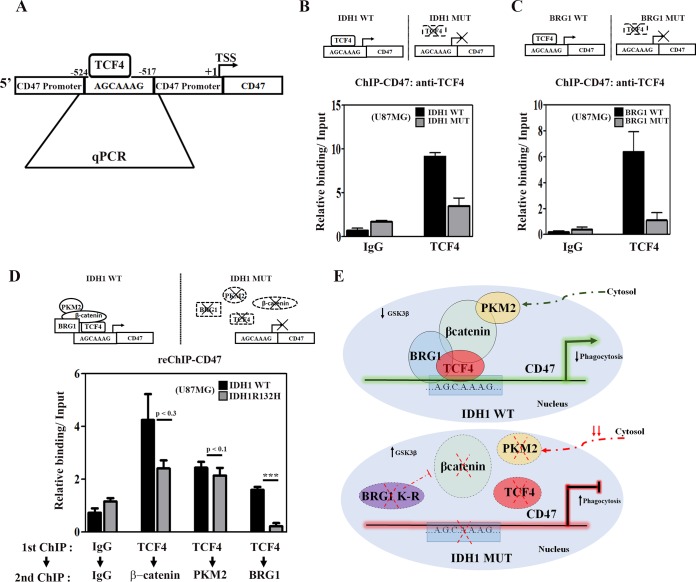
A gain-of-function mutation in isocitrate dehydrogenase 1 (IDH1) affects immune surveillance in gliomas. As elevated CD47 levels are associated with immune evasion in cancers, its status in gliomas harboring mutant IDH1 (IDH1-MT cells) was investigated. Decreased CD47 expression in IDH1-R132H-overexpressing cells was accompanied by diminished nuclear β-catenin, pyruvate kinase isoform M2 (PKM2), and TCF4 levels compared to those in cells harboring wild-type IDH1 (IDH1-WT cells). The inhibition of β-catenin in IDH1-WT cells abrogated CD47 expression, β-catenin-TCF4 interaction, and the transactivational activity of β-catenin/TCF4. The reverse effect was observed in IDH1-MT cells upon the pharmacological elevation of nuclear β-catenin levels. Genetic and pharmacological manipulation of nuclear PKM2 levels in IDH1-WT and IDH1-MT cells suggested that PKM2 is a positive regulator of the β-catenin-TCF4 interaction. The Cancer Genome Atlas (TCGA) data sets indicated diminished CD47, PKM2, and β-catenin levels in IDH1-MT gliomas compared to IDH1-WT gliomas. Also, elevated BRG1 levels with mutations in the ATP-dependent chromatin-remodeling site were observed in IDH1-MT glioma. The ectopic expression of ATPase-deficient BRG1 diminished CD47 expression as well as TCF4 occupancy on its promoter. Sequential chromatin immunoprecipitation (ChIP-re-ChIP) revealed the recruitment of the PKM2-β-catenin-BRG1-TCF4 complex to the TCF4 site on the CD47 promoter. This occupancy translated into CD47 transcription, as a diminished recruitment of this complex was observed in glioma cells bearing IDH1-R132H. In addition to its involvement in CD47 transcriptional regulation, PKM2-β-catenin-BRG1 cross talk affected the phagocytosis of IDH1-MT cells by microglia.

Keywords: BRG1; CD47; IDH1; PKM2; β-catenin.


Figures

FIG 1
FIG 1
Ectopic expression of IDH1-MT decreases CD47 expression and enhances phagocytosis of glioma cells. (A and B) Western blot analysis depicting CD47 expression in glioma cells stably (A) or transiently (B) overexpressing IDH1-WT and IDH1-R132H. The transfection efficiency of IDH1-R132H is shown. EV, empty vector. (C) Treatment with 2-HG diminishes CD47 levels in U87MG cells compared to those in untreated controls. The blots in panels A to C are representative of data from three independent experiments with similar results. Blots were stripped and reprobed for β-actin to establish equivalent loading. Densitometric measurements were performed on the immunoblots by using ImageJ. The values indicate fold changes over the values for the controls. Bands were normalized to their corresponding β-actin levels. (D) Graphical representation of the number of patients bearing IDH1-WT and IDH1-MT in LGG and GBM. The data are from multiple LGG and GBM data sets downloaded from the cBioPortal for Cancer Genomics database (http://www.cBioportal.org/). (E) Comparison of CD47 expression levels between LGG and GBM data sets. (F) LGG and GBM data sets were segregated into IDH1-WT and IDH1-MT, and the CD47 expression level was found to be significantly lower in IDH1-MT cells than in IDH1-WT cells. P values were determined by a 2-tailed, unpaired t test using GraphPad Prism. (G) Graph representing increased phagocytosis of IDH1-MT and 2-HG-treated glioma cells by microglia. The results represent averages of data from three different experiments. The P value was determined by a 2-tailed, paired t test using GraphPad Prism. *, P < 0.05; **, P < 0.01; ***, P < 0.001.
FIG 2
FIG 2
Decreased nuclear PKM2 levels are accompanied by diminished β-catenin expression in IDH1-MT cells. (A to C) GSK3B (encoding GSK-3β), CTNNB1 (encoding β-catenin), and PKM (encoding PKM2) expression levels (obtained from TCGA) were compared between IDH1-WT and IDH1-MT cells. P values were determined by a 2-tailed, unpaired t test using GraphPad Prism. (D) Western blot analysis showing diminished levels of β-catenin and PKM2, both nuclear and cytosolic, in cells overexpressing IDH1-R132H and in glioma cells treated with 2-HG compared to IDH1-WT and untreated glioma cells, respectively. The blots are representative of data from three independent experiments with similar results. Blots were stripped and reprobed for C23 or β-actin to establish equivalent loading. Densitometric measurements were performed on the immunoblots by using ImageJ. The values indicate fold changes over the values for the controls. Bands were normalized to the levels of their corresponding loading controls. NE, nuclear extract; cyto, cytosolic extract. (E) 2-HG treatment diminishes nuclear localization of β-catenin and PKM2. Cells were immunostained with anti-β-catenin (β-catenin) (red) and anti-PKM2 (PKM2) (green). The nucleus is stained with DAPI (4′,6-diamidino-2-phenylindole) (blue). Merged images are shown. Representative images at a ×63 magnification from three independent experiments are shown. Adjacent line profiles show relative mean fluorescence intensities. *, P < 0.05; ***, P < 0.001.
FIG 3
FIG 3
Diminished TCF4/β-catenin transactivation activity in IDH1-MT cells. (A) Coimmunoprecipitation assays with anti-β-catenin antibody show diminished formation of the nuclear β-catenin–PKM2–TCF4 complex in cells overexpressing IDH1-R132H compared to that in cells overexpressing IDH1-WT. IB, immunoblotting. (B) TCF4 transactivation activity in glioma cells was determined by a luciferase reporter assay using TOP Flash and FOP Flash (TOP Flash mutant). The graph depicts TOP/FOP Flash fold changes in relative luciferase units with respect to the control. Values represent the means ± standard errors of the means from three independent experiments. P values were determined by a 2-tailed, paired t test using GraphPad Prism. *, P < 0.05; **, P < 0.01.
FIG 4
FIG 4
CD47 expression is β-catenin dependent. (A) Pearson correlation coefficient analysis of CTNNB1 (encoding β-catenin) and CD47 mRNA levels in the GBM data set of TCGA. (B) siRNA-mediated β-catenin knockdown in IDH1-WT cells decreases CD47 levels as demonstrated by Western blotting. The transfection efficiency of β-catenin siRNA is shown. NS, nonspecific. (C) Western blot demonstrating CD47 and β-catenin expression levels in whole-cell lysates (WCL) and nuclear extracts (NE) of IDH1-WT cells treated with the β-catenin inhibitor iCRT14. Treatment with the β-catenin activator QS11 increased CD47 expression in IDH1-MT cells. Blots (B and C) are representative of data from three independent experiments with similar results. DMSO (dimethyl sulfoxide)-treated IDH1-WT and IDH1-MT glioma cells were used as controls for iCRT14 and QS11 treatments, respectively. Blots were stripped and reprobed for C23 or β-actin to establish equivalent loading. (D) Inhibition of β-catenin by iCRT14 diminishes the β-catenin–TCF4 interaction in cells harboring IDH1-WT. (E) Increased β-catenin–TCF4 interactions in IDH1-R132H-overexpressing cells upon treatment with the β-catenin activator QS11. (F and G) β-Catenin regulates TCF4 transactivation activity positively (F) and phagocytosis negatively (G) in glioma cells, as demonstrated by siRNA-mediated knockdown or pharmacological activation/inhibition of β-catenin. The graphs indicate fold changes with respect to the corresponding controls. Values represent the means ± standard errors of the means from 4 or 5 independent experiments. P values were determined by a 2-tailed, paired t test using GraphPad Prism. (H to J) β-Catenin expression (H), β-catenin–TCF4 interactions (I), and TCF4 transactivation activity (J) show positive correlations with CD47 levels and inverse correlations with phagocytosis. Densitometry data for β-catenin and CD47 under different treatment conditions were normalized to the values for the corresponding loading controls. Fold changes of normalized data were analyzed by using a Pearson correlation test in GraphPad Prism. Fold changes in TOP/FOP Flash values are considered for TCF4 transactivation activity, and fold changes in fluorescence are considered for phagocytosis. *, P < 0.05; **, P < 0.01; ***, P < 0.001. r indicates the Pearson correlation coefficient.
FIG 5
FIG 5
PKM2 functions as a coactivator of β-catenin to regulate CD47 expression. (A) Pearson correlation coefficient analysis of PKM (encoding PKM2) and CD47 mRNA levels in the GBM data set of TCGA. (B) siRNA-mediated knockdown of PKM2 decreases CD47 levels in IDH1-WT cells as determined by Western blotting. The transfection efficiency of PKM2 siRNA is shown. NS, nonspecific. (C) Western blot depicting CD47 and PKM2 expression levels in whole-cell (WCL) and nuclear extracts (NE) of IDH1-R132H cells treated with the nuclear export inhibitor leptomycin B (LMB). Blots in panels B and C are representative of data from three independent experiments with similar results. Blots were stripped and reprobed for C23 or β-actin to establish equivalent loading. Densitometric measurements were performed on the immunoblots by using ImageJ. The values indicate fold changes over values for controls. Bands were normalized to their corresponding β-actin or C23 levels. (D and E) siRNA-mediated knockdown of PKM2 in IDH1-WT cells decreases (D) while leptomycin B treatment increases (E) the β-catenin–TCF4 interaction in IDH1-MT cells. Methanol-treated IDH1-R132H cells were used as a control for LMB treatment. (F and G) PKM2 regulates TCF4 transactivation activity positively (F) and phagocytosis inversely (G) in glioma cells as demonstrated by siRNA-mediated knockdown or upon the nuclear retention of PKM2 by LMB. The graphs indicate fold changes with respect to the values for the corresponding controls. Values represent the means ± standard errors of the means from three independent experiments. P values were determined by a 2-tailed, paired t test using GraphPad Prism. (H to J) PKM2 expression shows positive correlations with CD47 levels (H), β-catenin–TCF4 interactions (I), and TCF4 transactivation activity (J) and inverse correlations with phagocytosis (H). Densitometry data for PKM2 and CD47 under different treatment conditions were normalized to the values for the corresponding loading controls. Fold changes of normalized data were analyzed by a Pearson correlation test using GraphPad Prism. Fold changes in TOP/FOP Flash values are considered for TCF4 transactivation activity, and fold changes in fluorescence are considered for phagocytosis. *, P < 0.05; **, P < 0.01; ***, P < 0.001. r indicates the Pearson correlation coefficient.
FIG 6
FIG 6
BRG1 regulates CD47 expression. (A) TCGA data set analysis of SMARCA4 (encoding BRG1) expression in IDH1-WT and IDH1-MT cells. (B) Coimmunoprecipitation assays with anti-β-catenin antibody show diminished nuclear BRG1–β-catenin complex formation despite increased nuclear BRG1 levels in IDH1-MT cells compared to those in IDH1-WT cells. (C) Mutational profile of BRG1 in LGGs and GBMs (modified from data from cBioPortal) indicating the missense mutation in the ATP binding and helicase activity site of BRG1, which results in the loss of ATPase-dependent BRG1 transcriptional activation. (D) Regression analysis indicates a positive correlation between IDH1 and BRG1 alterations across multiple CNS tumor data sets. R2 values were generated by a linear-fit model using GraphPad Prism. (E and F) Comparison of CD47 and CTNNB1 (β-catenin) expression levels between BRG1-WT and BRG1-MT obtained from TCGA. For panels A, E, and F, P values were determined by a 2-tailed, unpaired t test using GraphPad software. (G) Western blot depicting diminished CD47 expression in IDH1-WT cells transfected with pBJ5-BRG1-K-R. (H) Coimmunoprecipitation showing decreased β-catenin–TCF4 interactions in IDH1-WT cells transfected with pBJ5-BRG1-K-R. Blots in panels B, G, and H are representative of data from two to three independent experiments with similar results. Blots were stripped and reprobed for β-actin and c23 to establish equivalent loading. (I) BRG1 regulates TCF4 transactivation activity positively and phagocytosis inversely in glioma cells. The graphs indicate fold changes with respect to the values for the corresponding controls. Values represent the means ± standard errors of the means from three independent experiments. P values were determined by a 2-tailed, paired t test. *, P < 0.05; **, P < 0.01; ***, P < 0.001.
FIG 7
FIG 7
IDH1-MT decreases the occupancy of the PKM2–TCF4–β-catenin–Brg1 complex at the TCF4 site on the CD47 promoter. (A) Schematic representation showing the putative TCF4 binding site on the CD47 promoter (bp −524 to −517). (B) ChIP-qPCR analysis indicating decreased TCF4 occupancy at the TCF4 binding site on the CD47 promoter in IDH1-MT compared to IDH1-WT cells. (C) Ectopic pBJ5-BRG1-K-R expression decreases the occupancy of TCF4 on the CD47 promoter in IDH1-WT cells. (D) ChIP–re-ChIP analyses indicate diminished recruitment of β-catenin, PKM2, and BRG1 at the TCF4 binding site of the CD47 promoter in IDH1-MT compared to IDH1-WT cells. Primary ChIP and secondary ChIP were performed with TCF4 and β-catenin, PKM2, or BRG1 and then analyzed by qPCR. Values represent the means ± standard errors of the means from two independent experiments. (E) Model depicting the role of PKM2 and BRG1 in β-catenin/TCF4-dependent CD47 expression. P values were determined by a 2-tailed, paired t test. ***, P < 0.001.

References

    1. Balss J, Meyer J, Mueller W, Korshunov A, Hartmann C, von Deimling A. 2008. Analysis of the IDH1 codon 132 mutation in brain tumors. Acta Neuropathol 116:597–602. doi:10.1007/s00401-008-0455-2. - DOI - PubMed
    1. Bleeker FE, Atai NA, Lamba S, Jonker A, Rijkeboer D, Bosch KS, Tigchelaar W, Troost D, Vandertop WP, Bardelli A, Van Noorden CJ. 2010. The prognostic IDH1(R132) mutation is associated with reduced NADP+-dependent IDH activity in glioblastoma. Acta Neuropathol 119:487–494. doi:10.1007/s00401-010-0645-6. - DOI - PMC - PubMed
    1. Parsons DW, Jones S, Zhang X, Lin JC, Leary RJ, Angenendt P, Mankoo P, Carter H, Siu IM, Gallia GL, Olivi A, McLendon R, Rasheed BA, Keir S, Nikolskaya T, Nikolsky Y, Busam DA, Tekleab H, Diaz LA Jr, Hartigan J, Smith DR, Strausberg RL, Marie SK, Shinjo SM, Yan H, Riggins GJ, Bigner DD, Karchin R, Papadopoulos N, Parmigiani G, Vogelstein B, Velculescu VE, Kinzler KW. 2008. An integrated genomic analysis of human glioblastoma multiforme. Science 321:1807–1812. doi:10.1126/science.1164382. - DOI - PMC - PubMed
    1. Yan H, Parsons DW, Jin G, McLendon R, Rasheed BA, Yuan W, Kos I, Batinic-Haberle I, Jones S, Riggins GJ, Friedman H, Friedman A, Reardon D, Herndon J, Kinzler KW, Velculescu VE, Vogelstein B, Bigner DD. 2009. IDH1 and IDH2 mutations in gliomas. N Engl J Med 360:765–773. doi:10.1056/NEJMoa0808710. - DOI - PMC - PubMed
    1. Turcan S, Rohle D, Goenka A, Walsh LA, Fang F, Yilmaz E, Campos C, Fabius AW, Lu C, Ward PS, Thompson CB, Kaufman A, Guryanova O, Levine R, Heguy A, Viale A, Morris LG, Huse JT, Mellinghoff IK, Chan TA. 2012. IDH1 mutation is sufficient to establish the glioma hypermethylator phenotype. Nature 483:479–483. doi:10.1038/nature10866. - DOI - PMC - PubMed

Publication types

MeSH terms