. 2018 Mar 6;115(10):2395-2400.
doi: 10.1073/pnas.1800235115. Epub 2018 Feb 20.

Structural basis and energy landscape for the Ca2+ gating and calmodulation of the Kv7.2 K+ channel

Affiliations

Structural basis and energy landscape for the Ca2+ gating and calmodulation of the Kv7.2 K+ channel

Ganeko Bernardo-Seisdedos et al. Proc Natl Acad Sci U S A. .

Erratum in

Abstract

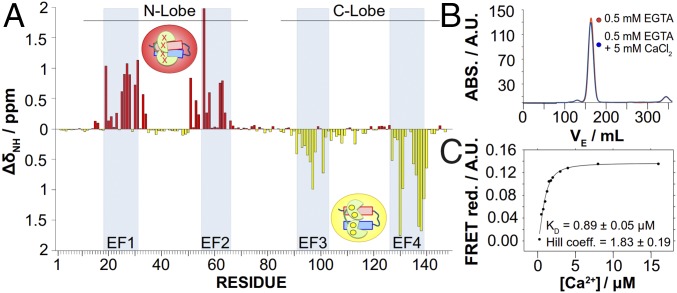
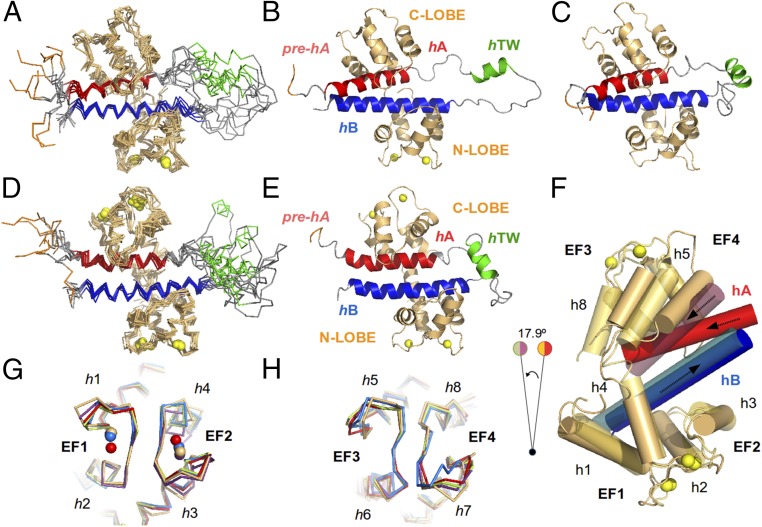
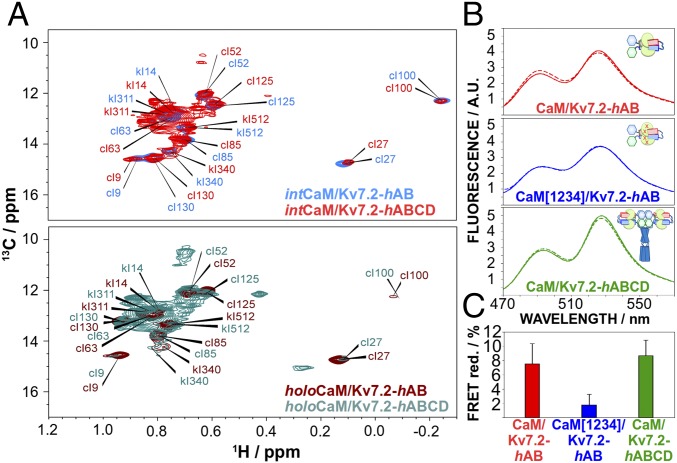
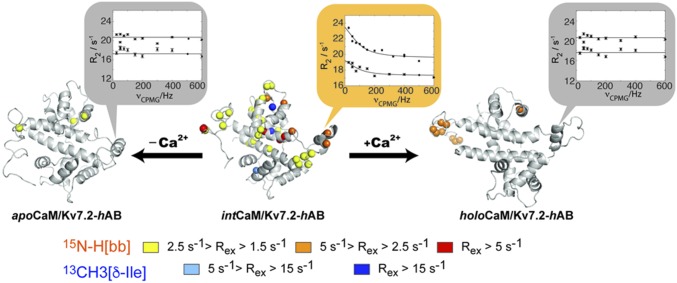
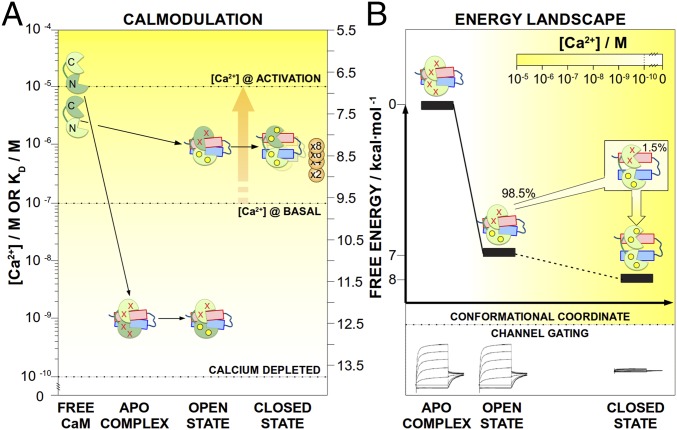
The Kv7.2 (KCNQ2) channel is the principal molecular component of the slow voltage-gated, noninactivating K+ M-current, a key controller of neuronal excitability. To investigate the calmodulin (CaM)-mediated Ca2+ gating of the channel, we used NMR spectroscopy to structurally and dynamically describe the association of helices hA and hB of Kv7.2 with CaM, as a function of Ca2+ concentration. The structures of the CaM/Kv7.2-hAB complex at two different calcification states are reported here. In the presence of a basal cytosolic Ca2+ concentration (10-100 nM), only the N-lobe of CaM is Ca2+-loaded and the complex (representative of the open channel) exhibits collective dynamics on the millisecond time scale toward a low-populated excited state (1.5%) that corresponds to the inactive state of the channel. In response to a chemical or electrical signal, intracellular Ca2+ levels rise up to 1-10 μM, triggering Ca2+ association with the C-lobe. The associated conformational rearrangement is the key biological signal that shifts populations to the closed/inactive channel. This reorientation affects the C-lobe of CaM and both helices in Kv7.2, allosterically transducing the information from the Ca2+-binding site to the transmembrane region of the channel.

Keywords: Kv7 potassium channel; M-current; calcium regulation; calmodulin; ion channel.


Conflict of interest statement

The authors declare no conflict of interest.

Figures

Fig. 1.
Fig. 1.
CSPs induced by Ca2+ over CaM complexed with helices A and B. (A) CSP analysis of residues forming CaM. The apoCaM/Kv7.2-hAB complex shows large CSPs in the EF1 and EF2 hands, whereas holoCaM/Kv7.2-hAB shows large CSPs in the EF3 and EF4 hands, demonstrating that intCaM/Kv7.2-hAB is Ca2+-loaded in the N-lobe, whereas the C-lobe is Ca2+-free. ΔδNH, absolute amide chemical shift differences. (B) Size exclusion chromatography profiles after injecting samples with and without Ca2+ in a Superdex 26/60 column. Elution peaks for the apo- and holoCaM/Kv7.2-hAB complexes (30.27 kDa) are almost identical (162.66 mL and 163.896 mL, respectively), corresponding to a theoretical molecular mass of 31.13 kDa and 30.3 kDa, respectively. ABS., absorbance; VE, eluted volume. (C) Ca2+ titration curve for the CaM/Kv7.2-hAB complex. Ca2+ affinity is measured by FRET ratio reduction between the mTFP1 (donor) and mVenus (acceptor) fluorophores located in the N and C termini of the Kv7.2-hAB construct complexed with CaM. The EC50 value (equivalent to an apparent Kd for the C-lobe) is 0.89 ± 0.05 μM, and the Hill coefficient is h = 1.83 ± 0.19 as obtained from the fitting to a Hill equation: EC50=F·[Ca2+]h/(EC50h+[Ca2+]h), where EC50 corresponds to the concentration of Ca2+ at which FRET change is half-maximal, h is the Hill coefficient, and Fis the FRET change found at a large excess of free calcium.
Fig. 2.
Fig. 2.
Structure of the CaM/Kv7.2-hAB complex at different calcification states. An overlay of the 10 lowest energy conformers representing the 3D solution structure of the intCaM/Kv7.2-hAB (A) or holoCaM/Kv7.2-hAB (D) complex is shown. A ribbon representation of the intCaM/Kv7.2-hAB (B) or holoCaM/Kv7.2-hAB (E) complex shows the structural elements: CaM protein (orange); the prehelix A(pre-hA), which connects segment 6 of the pore with the rest of the intracellular C terminus of the Kv7.2 channel (purple); helix hA (red); helix hTW (green); and helix hB (blue). Ca2+ ions are represented as spheres. The same color code is used for the ribbon representations of the apoCaM/Kv7.2-hAB complex. (C) Ribbon representation of the structural model of the apoCaM/Kv7.2-hAB complex. (F) Alignment of intCaM/Kv7.2-hAB and holoCaM/Kv7.2-hAB by the center of mass of the N-lobe of CaM displays the rotation (17.9°) of a segment of the complex upon Ca2+ binding to the C-lobe of CaM. The involved structural elements are h5 and h8 in CaM and hA in Kv7.2-hAB. (G) Alignment of the EF-hand motifs of the N-lobe of intCaM/Kv7.2-hAB (orange) with the equivalent motif in other reported (Ca2+-loaded) CaM structures: 4RJD (purple), 4UMO (blue), 4GOW (red), and 5J03 (green), with rmsd values of 1.12 Å, 1.22 Å, 1.26 Å, and 1.39 Å, respectively. (H) Alignment of the EF-hand motifs of the C-lobe of intCaM/Kv7.2-hAB (orange) with the equivalent motif in other reported (apo) CaM structures: 4V0C (blue), 4E50 (red), 4JQ0 (purple), and 5J03 (green), with rmsd values of 0.93 Å, 0.94 Å, 1.18 Å, and 1.25 Å, respectively.
Fig. 3.
Fig. 3.
Conformational changes are also observed in tetrameric channel constructs. (A) 13C–δ-Ile region of the methyl-TROSY spectrum for intCaM/Kv7.2-hAB (blue, Top), intCaM/Kv7.2-hABCD (red, Top), holoCaM/Kv7.2-hAB (brown, Bottom), and holoCaM/Kv7.2-hABCD (green, Bottom). The monomeric complex (CaM/Kv7.2-hAB) and the tetrameric assembly (CaM/Kv7.2-hABCD) experience the same conformational changes triggered by Ca2+. The assignment of the methyl peaks in intCaM/Kv7.2-hAB was achieved by a combination of multiple 3D experiments, while the same peaks in intCaM/Kv7.2-hABCD are estimated by spectra overlap. (B) mTFP1 (Donor) and mVenus (Acceptor) are localized in the N and C termini of helices AB, respectively. CaM/Kv7.2-hAB (Top, red), CaM[1234]/Kv7.2-hAB (Middle, blue), and CaM/Kv7.2-hABCD (Bottom, green) emission spectra in the absence (full line) and presence (dashed line) of Ca2+-saturating concentrations are shown. (C) FRET reduction ratios relative to the maximum excitation (∼492 nm) and emission (∼526 nm) peaks. Ca2+ addition induces noticeable conformational changes (similar in magnitude) in the monomeric version (CaM/Kv7.2-hAB) or the tetrameric version (CaM/Kv7.2-hABCD), but not for the CaM[1234]/Kv7.2-hABCD tetramer.
Fig. 4.
Fig. 4.
Millisecond dynamics of intCaM/Kv7.2-hAB populate the holoCaM/Kv7.2-hAB state to a low extent. In the structure, the spheres pinpoint the 15N-H backbone (bb) amide groups and 13C–δ-Ile methyl groups that are experiencing microsecond-to-millisecond dynamics for the three conformations under consideration. The magnitude of the exchange line broadening is color-coded as indicated. The vignettes show a representative example of the RD profiles (Val366). The solid lines correspond to the fitting to the Carver–Richards equation, simultaneously, of the two static magnetic field datasets (600 and 800 MHz).
Fig. 5.
Fig. 5.
Energy landscape and calmodulation of Kv7.2. The energy landscape and calmodulation connect the two different states of the channel: the open state (apoCaM/Kv7.2-hAB and intCaM/Kv7.2-hAB complexes) and the closed state (holoCaM/Kv7.2-hAB complex). In both panels, [Ca2+] is visualized by the yellow color intensity, as indicated in the inset scale. (A) Cartoons representing the different molecules are located in the ordinate axis according to the affinities of the dark green lobes. For instance, the N-lobes of CaM change their Kd for Ca2+ from 14 μM (free) to a Kd of less than 10−3 μM after complexation with Kv7.2-hAB (calmodulation). The horizontal dotted lines indicate the two different intracellular concentrations (the basal concentration and the maximum concentration induced by bradykinin), as well as a level that can be considered ion-free (Ca2+ depleted). The bradykinin-mediated Ca2+ release (orange arrow) triggers the transition from the open state toward the closed state of the channel. The apparent affinity of the channel for Ca2+ depends on the number of ions required to trigger the conformational change (from one to eight), as indicated by the orange circles. (B) Ca2+ affinities are used to estimate the relative energy levels of the different conformations, underlining the progressive stabilization of the complex with the Ca2+-binding coordinate. In the intCaM/Kv7.2-hAB complex, the main population is in the open state, while a small population (1.5%) is already in the closed state.

References

    1. Jespersen T, Grunnet M, Olesen S-P. The KCNQ1 potassium channel: From gene to physiological function. Physiology (Bethesda) 2005;20:408–416. - PubMed
    1. Sanguinetti MC, et al. Coassembly of K(V)LQT1 and minK (IsK) proteins to form cardiac I(Ks) potassium channel. Nature. 1996;384:80–83. - PubMed
    1. Berkefeld H, et al. BKCa-Cav channel complexes mediate rapid and localized Ca2+-activated K+ signaling. Science. 2006;314:615–620. - PubMed
    1. Miranda P, Giraldez T, Holmgren M. Interactions of divalent cations with calcium binding sites of BK channels reveal independent motions within the gating ring. Proc Natl Acad Sci USA. 2016;113:14055–14060. - PMC - PubMed
    1. Chin D, Means A-R. Calmodulin: A prototypical calcium sensor. Trends Cell Biol. 2000;10:322–328. - PubMed

Publication types

LinkOut - more resources