. 2018 Mar 13;115(11):E2556-E2565.
doi: 10.1073/pnas.1713370115. Epub 2018 Feb 20.

Bone degradation machinery of osteoclasts: An HIV-1 target that contributes to bone loss

Affiliations

Bone degradation machinery of osteoclasts: An HIV-1 target that contributes to bone loss

Brigitte Raynaud-Messina et al. Proc Natl Acad Sci U S A. .

Abstract

Bone deficits are frequent in HIV-1-infected patients. We report here that osteoclasts, the cells specialized in bone resorption, are infected by HIV-1 in vivo in humanized mice and ex vivo in human joint biopsies. In vitro, infection of human osteoclasts occurs at different stages of osteoclastogenesis via cell-free viruses and, more efficiently, by transfer from infected T cells. HIV-1 infection markedly enhances adhesion and osteolytic activity of human osteoclasts by modifying the structure and function of the sealing zone, the osteoclast-specific bone degradation machinery. Indeed, the sealing zone is broader due to F-actin enrichment of its basal units (i.e., the podosomes). The viral protein Nef is involved in all HIV-1-induced effects partly through the activation of Src, a regulator of podosomes and of their assembly as a sealing zone. Supporting these results, Nef-transgenic mice exhibit an increased osteoclast density and bone defects, and osteoclasts derived from these animals display high osteolytic activity. Altogether, our study evidences osteoclasts as host cells for HIV-1 and their pathological contribution to bone disorders induced by this virus, in part via Nef.

Keywords: HIV-1 infection; Nef; bone loss; osteoclast; podosome.


Conflict of interest statement

The authors declare no conflict of interest.

Figures
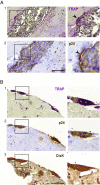
Fig. 1.
Fig. 1.
Tissue OC are infected with HIV-1 in vivo and ex vivo. (A) HIV-1 infects OC in vivo in HIV-1–infected BLT-humanized mice. Two serial sections (3-µm thick, 1 and 2) of the head of a tibia of HIV-1–BLT mice were stained for TRAP activity (in purple, 1) and with a monoclonal antibody directed toward human viral protein p24 (in brown, 2). Representative sections (n = 4 mice, two sections per mouse of tibia and femur heads). Arrowheads show an infected OC. (Scale bar, 50 µm.) Enlarged frames, 2× zoom. (B) Human OC are infected with HIV-1 in synovial explants. Pieces of a noninflammatory human synovial tissue were cultured with M-CSF and RANKL and infected with HIV-1 (ADA strain). Two weeks postinfection, histological analyses [TRAP activity in purple (1), p24 (2) and cathepsin K (CtsK) (3) IHC in brown, nuclei in blue] were performed on three serial sections (3-µm thick, 13). Representative histological sections (n = 3 synovial tissues, four pieces per tissue). (Scale bar, 100 µm.) Enlarged frames, 2.3× zoom.
Fig. 2.
Fig. 2.
HIV-1 infects human OC and their precursors in vitro. (AC) OC are infected by cell-free viruses at different stages of differentiation. (A) Experimental design of infection (ADA strain). (B and C) Kinetics of the percentage of p24+ cells (B, determined by IF) and of p24 release in the supernatants (C, determined by ELISA) in cells maintained in M-CSF plus RANKL (OC, black bars) or M-CSF alone (MDM, blue bars) from the same donors are shown. Results are expressed as mean ± SEM (n = 3 donors and 5 donors for day 10). Day of i, day of infection. (D) Transmission electron microscopy images of infected OC. Mature OC were infected with HIV-1 and examined 10 d postinfection. Images of a budding virus (Left, red arrowhead) and viruses contained in a cytoplasmic membrane compartment (Right, black arrowheads show mature viruses). (Scale bar, 100 nm.)
Fig. 3.
Fig. 3.
HIV-1 is transmitted from infected T lymphocytes to OC. (AC) OC have been in contact for 6 h with noninfected Jurkat T lymphocytes (Left), with HIV-1–infected T lymphocytes (Center), or with cell-free viral particles produced by T cells during 6 h (Right); they were washed, then harvested immediately (day 0) or 5 d later (day 5). (A) Representative mosaic of 3 × 3 confocal fields of original magnification 20×, after staining for p24 (green), F-actin (phalloidin-Texas red, red), and nuclei (DAPI, blue) at day 5. (Scale bar, 50 µm.) (B and C) Quantifications (mean ± SD, n = 8 donors) of the percentage of p24+ cells evaluated by IF (B) immediately (day 0) or 5 d (day 5) postinfection and of p24 release in the supernatants determined by ELISA after 5 d (day 5) (C). **P ≤ 0.01; ****P ≤ 0.0001.
Fig. 4.
Fig. 4.
HIV-1 enhances 3D migration of OC precursors in Matrigel. OC precursors were infected or not at day 1, seeded at day 2 on thick layers of Matrigel polymerized in transwell chambers, and migration was measured 48 h later. (A) Representative brightfield images of live cells either at the surface (top) or within the matrix (inside), taken after 48 h of migration using an inverted video microscope. (Scale bar, 50 μm.) (B) The percentage of migrating cells was measured (mean ± SEM, n = 7 donors) (NI, noninfected). ***P ≤ 0.001. (C) Three-dimensional positions of OC precursors in the matrix and mean distance of migration (dmean) from a representative experiment of seven are shown using the TopCat software.
Fig. 5.
Fig. 5.
HIV-1 enhances OC fusion, osteolytic activity, and adhesion of OC. (A) HIV-1 triggers OC fusion. Ten days postinfection, cells were stained for p24 (green), F-actin (red), and nuclei (blue). Images from a mosaic of 4 × 4 confocal fields of original magnification 20×. (Scale bar, 150 μm.) The cell fusion index (nuclei number in multinucleated cells/total nuclei number) and the surface percentage covered by multinucleated cells (surface index) were measured for >3,000 cells in each condition, n = 6 donors. Results are expressed as mean ± SEM. (BG) HIV-1 infection increases the bone resorption activity of OC. Day 10-noninfected and HIV-1–infected OC were seeded on cortical bone slides for 48 h. Then, OC were removed, the supernatants collected, and the bone slices stained with Toluidine blue to visualize resorption pits in purple. Data were obtained from six donors. (B) Representative brightfield images of bone-resorption pits (purple). (Scale bar, 20 μm.) (C) Representative confocal images of pits. Color codes for the depth of resorption pits (color scale bar). (Scale bar, 20 μm.) Quantification of the percentage of degradation area (D) and circularity (E) from brightfield images and resorbed volume (F) from confocal images are shown. In D, the degradation area of noninfected OC, normalized to 100%, corresponded to 9% of the total area. (G) The concentration of CTX in the supernatant was measured by ELISA and normalized to 100% for noninfected cells (mean CTX concentration = 1,790 pg/mL), n = 6 donors. (HK) Effects of infection on mineral dissolution and extracellular osteolytic enzymes. (H) Day 10-noninfected and HIV-1–infected OC were seeded on crystalline inorganic calcium phosphate-coated multiwells. The cells were removed and the wells stained to reveal demineralized area (black). (Scale bar, 50 µm.) Graph shows the area covered by mineral dissolution pits from 10 fields per condition and per donor, n = 3 donors. (IK) The supernatants of noninfected and HIV-1–infected OC seeded on glass were collected at day 10. TRAP and CtsK expression levels (Western blot, I and J) and MMP9 activity (zymography analysis, K) were quantified. Protein loading has been controlled by Coomassie blue staining, n = 4 donors. (L) HIV-1 infection increases OC adhesive properties. Noninfected and HIV-1–infected OC were removed at day 10 with Accutase for 10 min and the percentage of remaining adherent cells quantified by counting nuclei (adhesion index). Graph represents average of five fields per condition from n = 3 donors (NI, noninfected). *P ≤ 0.05; **P ≤ 0.01; ***P ≤ 0.001, ****P ≤ 0.0001.
Fig. 6.
Fig. 6.
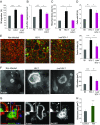
HIV-1 modifies the organization of the SZ and induces Src-kinase activation in human OC. (AE) HIV-1 infection increases the size and F-actin intensity of the SZ. (A) Confocal images of noninfected or HIV-1–infected OC seeded on bone slides. Cells were stained for p24 (green) and F-actin (red). (Scale bar, 10 μm.) (B) Quantification of the percentage of cells forming SZ (n = 4 donors, 300 cells per donor). (CE) Vertical scatter plots showing for each SZ, the surface (C), the percentage of the cell surface occupied by SZ (D), and the F-actin intensity (E) (n = 3 donors, >25 SZ). Graphs show individual SZ values and the mean ± SEM. (F and G) HIV-1 infection increases the size of individual podosomes. OC seeded on glass were infected with HIV-1 and stained for F-actin. (F) IF images. (Scale bar, 10 μm.) (G) Automated quantification of the F-actin fluorescence area of individual podosomes. Mean ± SEM, n = 3 donors (>2,000 podosomes, 10 cells per donor). (H) HIV-1 infection induces Src-kinase activation. Whole-cell lysates were subjected to Western blotting using antibodies against the phospho-Tyr416 of Src kinases, Src and Actin. A representative blot and quantification of the phospho-Tyr416 kinase ratio over total Src are shown. Results are expressed as mean ± SEM, n = 6 donors (NI, noninfected). **P ≤ 0.01; ***P ≤ 0.001, ****P ≤ 0.0001.
Fig. 7.
Fig. 7.
HIV-1 effects on differentiation and function of OC involve the viral protein Nef. (AF) Nef is necessary for HIV-1–induced effects in OC. Human OC precursors (A) or mature OC (BF) were infected with wt HIV-1 or with delta nefHIV-1 (NI, noninfected). (A) Percentage of migrating OC precursors after 48 h measured as in Fig. 4, n = 4 donors. (B) Quantification of Western blot analyses on whole-cell lysates using antibodies against the phospho-Tyr416 of Src kinases, Src and Actin as in Fig. 6H. Results are expressed as mean ± SEM, n = 6 donors. Quantification of (C) resorbed bone area (n = 4), (D) the percentage of cells forming SZ (n = 4 donors, 300 cells per donor), (E) the fusion index (>3,000 cells per condition, n = 6 donors) illustrated by mosaics of 4 × 4 confocal fields (F-actin in red and nuclei in green), (F) the SZ surface in OC seeded on bones and stained for F-actin (phalloidin), (n = 3 donors, >25 SZ). (Scale bars, 150 μm in E, 10 µm in F.) Results are expressed as mean ± SEM. (G and H) Expression of Nef-GFP in OC. OC were transfected with NefSF2-GFP or GFP (control) and stained for F-actin (phalloidin, red) and nuclei (blue). (G) A fraction of Nef localizes at the SZ. Confocal images of OC expressing NefSF2-GFP. Arrowheads show colocalization of Nef-GFP with F-actin at the SZ. (Scale bar, 10 µm, Insets, 2× zoom.) (H) Nef expression increases the size of individual podosomes. Automated quantification of the F-actin fluorescence area of individual podosomes. Mean ± SEM, n = 4 donors (>2,000 podosomes from over five cells per donor). *P ≤ 0.05; **P ≤ 0.01; ***P ≤ 0.001, ****P ≤ 0.0001.
Fig. 8.
Fig. 8.
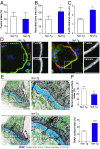
In Nef-Tg mice, the osteolytic activity of OC and bone defects are enhanced. (AD) OC differentiated ex vivo from Tg-mice are more osteolytic. OC were differentiated from bone marrow precursors isolated from Nef-Tg and non Tg mice and the fusion index (A), the bone resorption area (B), and the F-actin belt thickness (C) were quantified (50 SZ per condition, n = 3 mice per genotype). (D) Representative images of belt structures of OC from non Tg and Nef-Tg mice stained for F-actin (red), vinculin (green) and DAPI (blue). Enlarged frames, 2× zoom. (Scale bars, 10 μm.) (E and F) Nef-Tg mice exhibit bone defects. (E) Representative histological sections of tibia from 7-wk-old mice stained for TRAP to visualize OC (purple), and counterstained with Methyl green and Alcian blue: the bone tissue appears in gray, nuclei in green (corresponding to the nuclei of bone marrow cells), and cartilage in blue. (Scale bar, 200 µm.) Enlarged frames: ×4 zoom. (F) Quantification of the surface occupied by trabecular bone and surface occupied by TRAP-positive signal in three separate histological sections per mouse (n = 3 mice per genotype) are shown. *P ≤ 0.05; **P ≤ 0.01; ***P ≤ 0.001, ****P ≤ 0.0001.
Fig. 9.
Fig. 9.
Graphical abstract proposed to explain HIV-1-induced bone defects in patients. HIV-1 infection affects OC precursor recruitment to bones and the OC differentiation process. These effects, dependent on the viral protein Nef, result in more numerous and more osteolytic OC exhibiting larger and denser SZ.

Comment in

  • Deciphering how HIV-1 weakens and cracks the bone.
    Ofotokun I. Ofotokun I. Proc Natl Acad Sci U S A. 2018 Mar 13;115(11):2551-2553. doi: 10.1073/pnas.1801555115. Epub 2018 Mar 1. Proc Natl Acad Sci U S A. 2018. PMID: 29496959 Free PMC article. No abstract available.

References

    1. Cotter AG, Mallon PW. The effects of untreated and treated HIV infection on bone disease. Curr Opin HIV AIDS. 2014;9:17–26. - PubMed
    1. Descours B, et al. CD32a is a marker of a CD4 T-cell HIV reservoir harbouring replication-competent proviruses. Nature. 2017;543:564–567, and erratum (2017) 546:686. - PubMed
    1. Bruera D, Luna N, David DO, Bergoglio LM, Zamudio J. Decreased bone mineral density in HIV-infected patients is independent of antiretroviral therapy. AIDS. 2003;17:1917–1923. - PubMed
    1. Gibellini D, et al. RANKL/OPG/TRAIL plasma levels and bone mass loss evaluation in antiretroviral naive HIV-1-positive men. J Med Virol. 2007;79:1446–1454. - PubMed
    1. Grijsen ML, et al. High prevalence of reduced bone mineral density in primary HIV-1-infected men. AIDS. 2010;24:2233–2238. - PubMed

Publication types

MeSH terms

Substances

LinkOut - more resources