. 2018 Mar 6;115(10):E2467-E2476.
doi: 10.1073/pnas.1714723115. Epub 2018 Feb 20.

Fundamental limits on dynamic inference from single-cell snapshots

Affiliations

Fundamental limits on dynamic inference from single-cell snapshots

Caleb Weinreb et al. Proc Natl Acad Sci U S A. .

Abstract

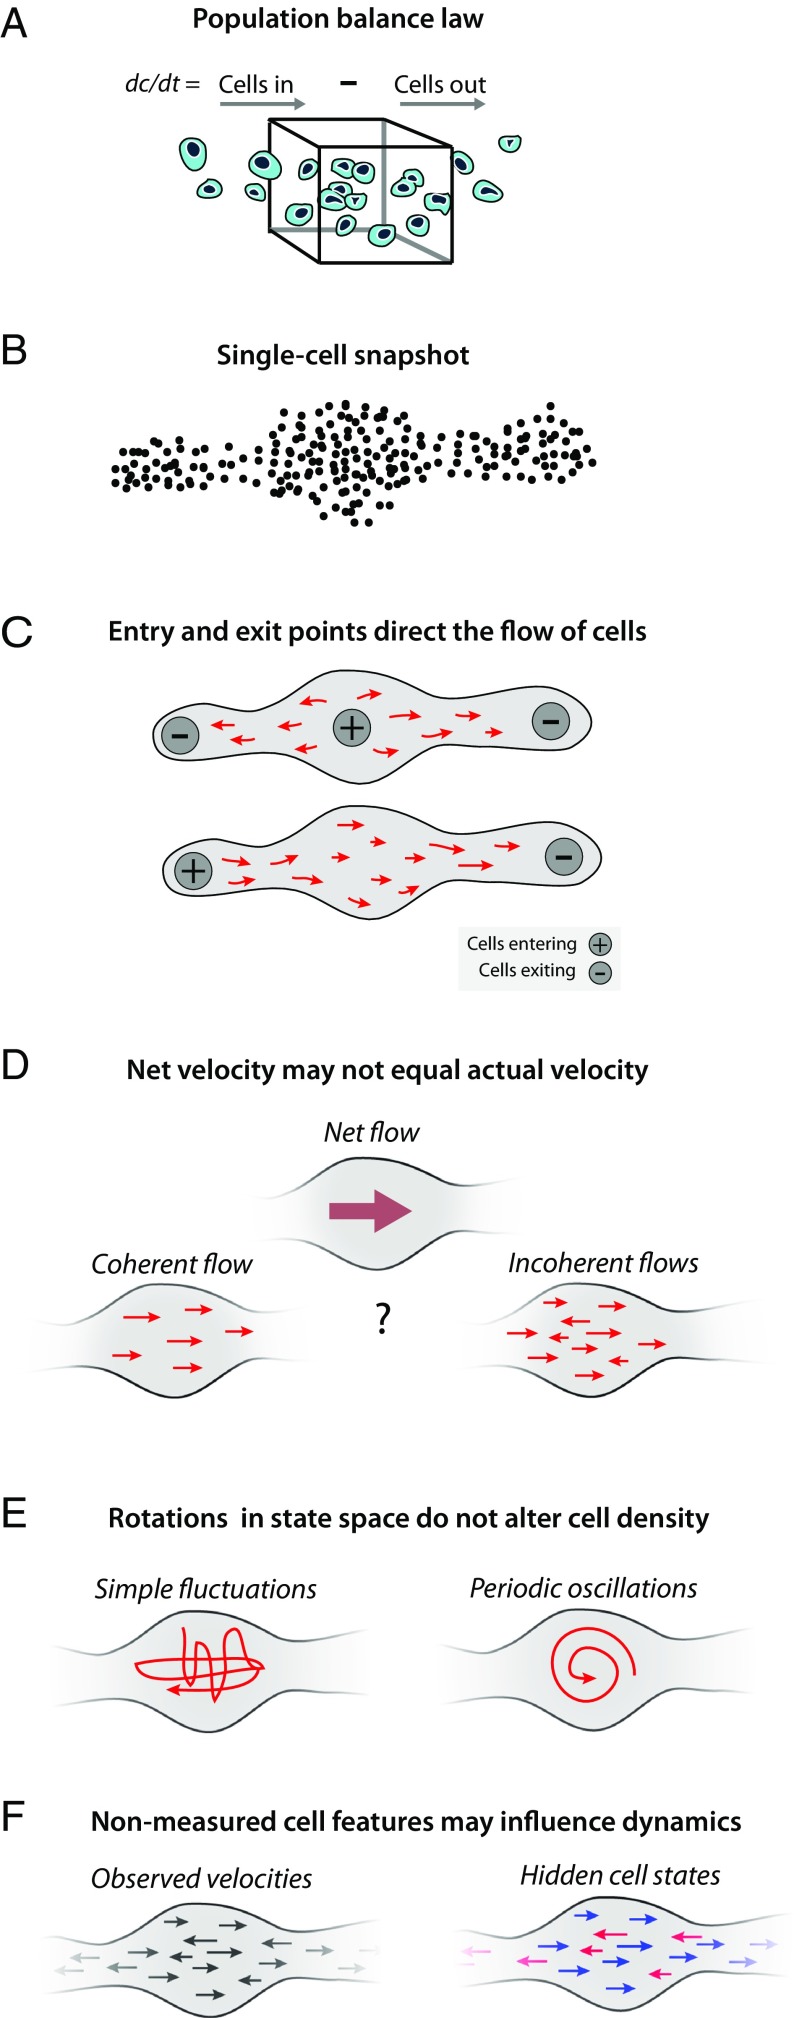
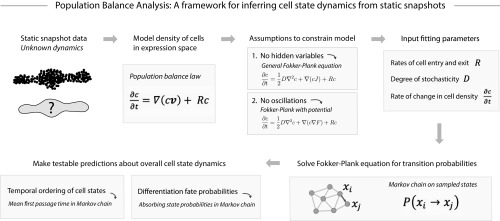
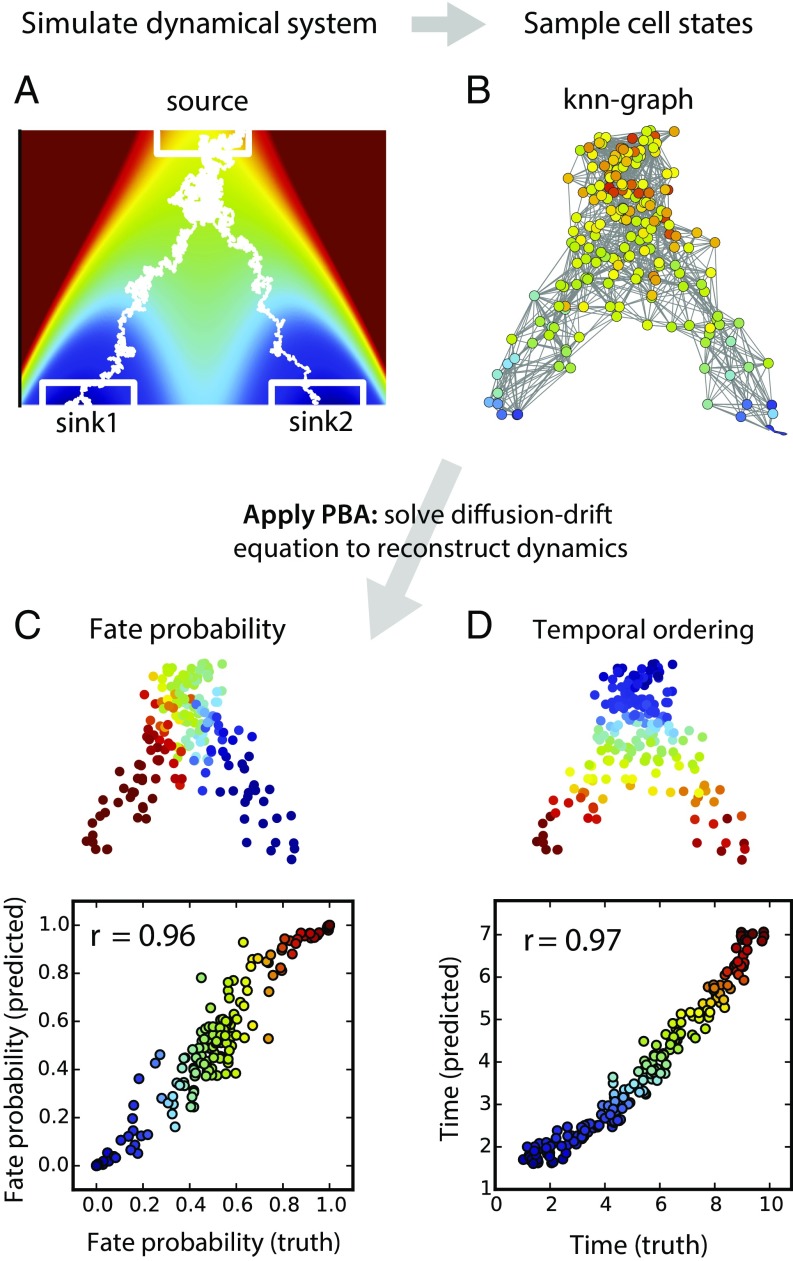
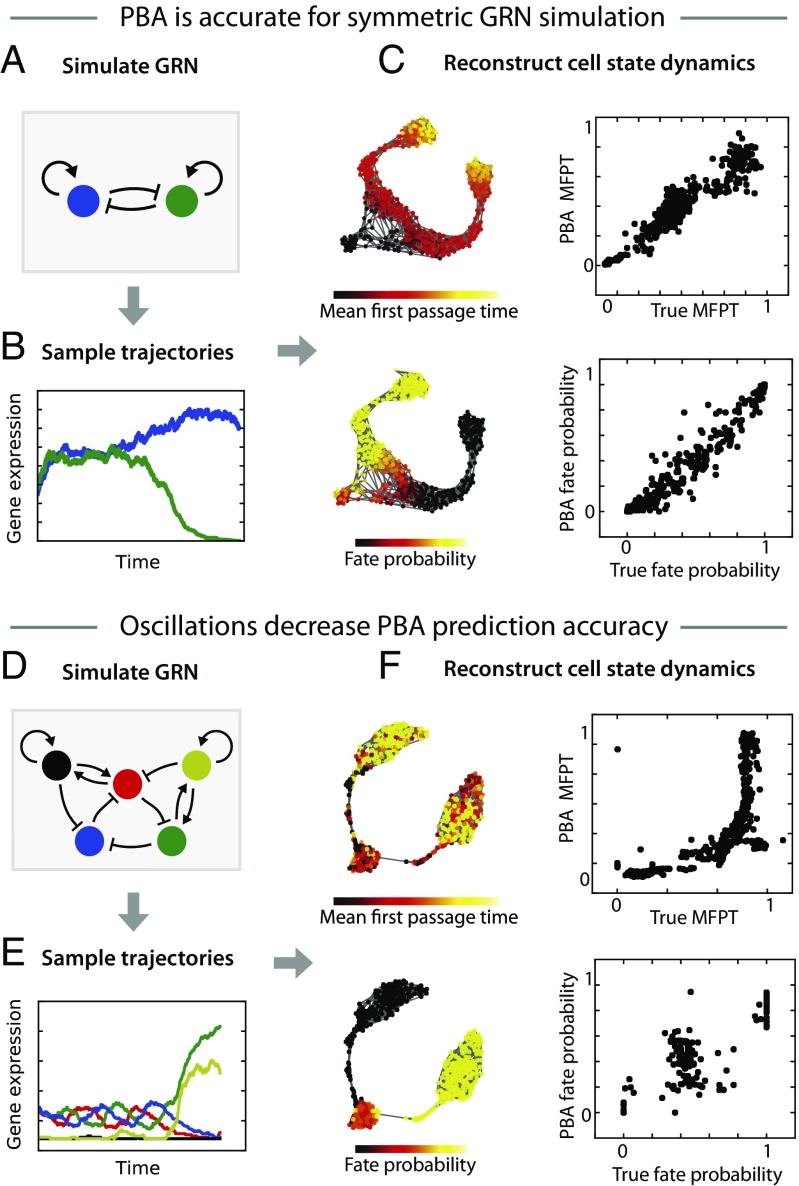
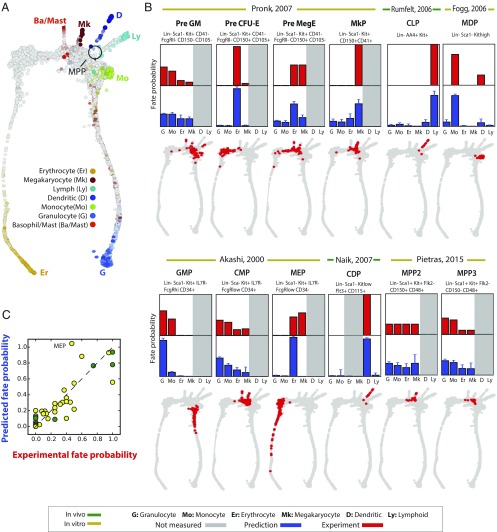
Single-cell expression profiling reveals the molecular states of individual cells with unprecedented detail. Because these methods destroy cells in the process of analysis, they cannot measure how gene expression changes over time. However, some information on dynamics is present in the data: the continuum of molecular states in the population can reflect the trajectory of a typical cell. Many methods for extracting single-cell dynamics from population data have been proposed. However, all such attempts face a common limitation: for any measured distribution of cell states, there are multiple dynamics that could give rise to it, and by extension, multiple possibilities for underlying mechanisms of gene regulation. Here, we describe the aspects of gene expression dynamics that cannot be inferred from a static snapshot alone and identify assumptions necessary to constrain a unique solution for cell dynamics from static snapshots. We translate these constraints into a practical algorithmic approach, population balance analysis (PBA), which makes use of a method from spectral graph theory to solve a class of high-dimensional differential equations. We use simulations to show the strengths and limitations of PBA, and then apply it to single-cell profiles of hematopoietic progenitor cells (HPCs). Cell state predictions from this analysis agree with HPC fate assays reported in several papers over the past two decades. By highlighting the fundamental limits on dynamic inference faced by any method, our framework provides a rigorous basis for dynamic interpretation of a gene expression continuum and clarifies best experimental designs for trajectory reconstruction from static snapshot measurements.

Keywords: dynamic inference; hematopoiesis; pseudotime; single cell; spectral graph theory.


Conflict of interest statement

The authors declare no conflict of interest.

Figures

Fig. 1.
Fig. 1.
Symmetries and inhomogeneities of the population balance law set fundamental limits on dynamic inference. (A) Schematic of the population balance law (Eq. 1), which serves as a starting point for inferring cell dynamics from high-dimensional snapshots. In each small region of gene expression space, the rate of change in cell density equals the net cell flux into and out of the region. Symmetries and unknown variables of the population balance law mean that there is no unique solution for dynamics from a static snapshot (B), shown schematically in CE. (C) Alternative assumptions on cell entry and exit rates across gene expression space lead to different dynamic solutions. (D) Snapshot data constrain only net cell flows through the population balance law, and not the noise in dynamic trajectories of individual cells. (E) A gauge symmetry of the population balance law means that static snapshots arising from periodic oscillations of cell state can also be explained by simple fluctuations that do not have a consistent direction and periodicity. (F) Hidden but stable properties of a cell—such as epigenetic state—allow for a superposition of cell populations following different dynamic laws. These unknowns are constrained by assumptions in any algorithm inferring dynamics from static snapshot data.
Fig. 2.
Fig. 2.
Population balance analysis (PBA). Although many dynamics are consistent with a given static snapshot of cell states, testable assumptions can constrain a unique solution. Shown schematically here is PBA, one such approach to dynamic inference under explicit assumptions. PBA constrains the population balance law by assuming a dynamics that is Markovian and described by a potential landscape (see Construction of the PBA Framework for details), and including fitting parameters that incorporate prior knowledge or can be directly measured. The resulting diffusion-drift equation is solved asymptotically exactly in high dimensions on single-cell data through a graph theoretic result (SI Appendix, Theory Supplement and ref. 22). The PBA algorithm outputs transition probabilities for each pair of observed states, which can then be used to compute dynamic properties such as temporal ordering and fate potential.
Fig. 3.
Fig. 3.
Demonstration of PBA on a simulated high-dimensional differentiation process. (A) Cells emerge from a proliferating bipotent state (source) and differentiate into one of two fates (sinks 1 and 2) in a high-dimensional gene expression space, with two dimensions shown. Heat map colors show a potential field containing the cell trajectories. Example trajectories are shown in white. (B) Static expression profiles sampled asynchronously through differentiation serve as the input to PBA, which reconstructs trajectories and accurately predicts future fate probabilities (C) and timing (D) of each cell.
Fig. 4.
Fig. 4.
Test of PBA on cell states from a simulated gene regulatory network (GRN). (A) We tested PBA on cell states sampled from a GRN composed of two genes that repress each other and activate themselves. (B) Trajectories from this GRN begin in an unstable state with both genes at an intermediate level and progress to a stable state with one gene dominating. (C) PBA was applied to a steady-state snapshot of cells from this process (shown on Left using a force-directed layout generated by SPRING). The resulting predictions for temporal ordering (Top) and fate probability (Bottom) are compared with ground truth. (D) To challenge PBA, we defined a GRN with two stable states that compete with semistable limit cycle. (E) Trajectories from the GRN begin with all genes oscillating and then progress to stable state where one pair of genes dominates. (F) PBA was applied to a steady-state snapshot of cells from this process, with predictions for ordering (Top) and fate probability (Bottom) compared with ground truth. In C and F, the mean first-passage time (MFPT) is defined as the mean simulation time taken to enter the neighborhood of each sampled state; the “fate probability” equals the fraction of simulations starting from each sampled state that reach one of the two absorbing states.
Fig. 5.
Fig. 5.
Population balance analysis reproduces known fate probabilities of hematopoietic progenitor cell (HPC) subpopulations from single-cell data. (A) Single-cell profiles of 3,803 Kit+ HPCs reveal a continuum of gene expression states that pinches off at different points to form seven downstream lineages. Cells in this map are colored by marker gene expression and are laid out as a k-nearest-neighbor (knn) graph using SPRING, an interactive force-directed layout software. (B) PBA is applied to HPCs, and the predicted fate probabilities (blue bars) are compared with those observed experimentally (red bars) for reported HPC subpopulations (red dots on gray HPC map; identified using transcriptional similarity to existing microarray profiles for each reported subpopulation). Cell fates predicted by PBA but not measured experimentally are shaded gray. Error bars represent 90% confidence intervals across 120 parameter combinations for the PBA pipeline. (C) Summary of comparisons made in B; green points, in vivo measurements; yellow points, in vitro measurements.
Fig. 6.
Fig. 6.
Potential landscapes arise from symmetric GRNs. (A) Inferences about the deterministic component of average cell velocities, J(x), can be interpreted as statements about an underlying gene regulatory network (GRN), with dJi/dxj giving the sensitivity of the dynamics of gene i to the expression level of gene j. (B) The existence of a potential landscape-driven dynamics implies that the underlying GRN has strictly symmetric interactions, which allows for some common gene regulatory motifs but rules out many others.

References

    1. Linnarsson S, Teichmann SA. Single-cell genomics: Coming of age. Genome Biol. 2016;17:97. - PMC - PubMed
    1. Klein AM, et al. Droplet barcoding for single-cell transcriptomics applied to embryonic stem cells. Cell. 2015;161:1187–1201. - PMC - PubMed
    1. Macosko EZ, et al. Highly parallel genome-wide expression profiling of individual cells using nanoliter droplets. Cell. 2015;161:1202–1214. - PMC - PubMed
    1. Buenrostro JD, et al. Single-cell chromatin accessibility reveals principles of regulatory variation. Nature. 2015;523:486–490. - PMC - PubMed
    1. Lombard-Banek C, Moody SA, Nemes P. Single-cell mass spectrometry for discovery proteomics: Quantifying translational cell heterogeneity in the 16-cell frog (Xenopus) embryo. Angew Chem Int Ed Engl. 2016;55:2454–2458. - PMC - PubMed

Publication types