. 2018 Mar 6;115(10):E2183-E2192.
doi: 10.1073/pnas.1714530115. Epub 2018 Feb 20.

OligoMiner provides a rapid, flexible environment for the design of genome-scale oligonucleotide in situ hybridization probes

Affiliations

OligoMiner provides a rapid, flexible environment for the design of genome-scale oligonucleotide in situ hybridization probes

Brian J Beliveau et al. Proc Natl Acad Sci U S A. .

Abstract

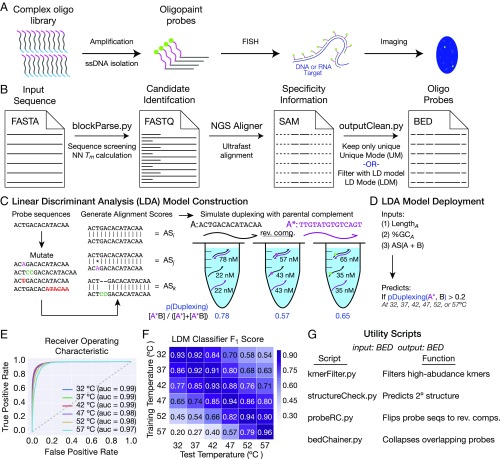
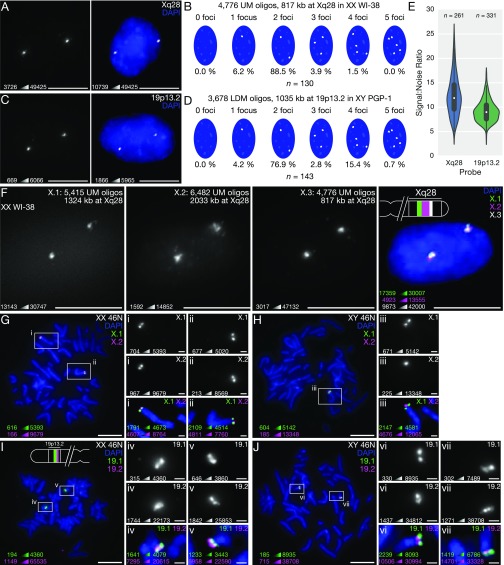
Oligonucleotide (oligo)-based FISH has emerged as an important tool for the study of chromosome organization and gene expression and has been empowered by the commercial availability of highly complex pools of oligos. However, a dedicated bioinformatic design utility has yet to be created specifically for the purpose of identifying optimal oligo FISH probe sequences on the genome-wide scale. Here, we introduce OligoMiner, a rapid and robust computational pipeline for the genome-scale design of oligo FISH probes that affords the scientist exact control over the parameters of each probe. Our streamlined method uses standard bioinformatic file formats, allowing users to seamlessly integrate new and existing utilities into the pipeline as desired, and introduces a method for evaluating the specificity of each probe molecule that connects simulated hybridization energetics to rapidly generated sequence alignments using supervised machine learning. We demonstrate the scalability of our approach by performing genome-scale probe discovery in numerous model organism genomes and showcase the performance of the resulting probes with diffraction-limited and single-molecule superresolution imaging of chromosomal and RNA targets. We anticipate that this pipeline will make the FISH probe design process much more accessible and will more broadly facilitate the design of pools of hybridization probes for a variety of applications.

Keywords: FISH; in situ; oligo; oligonucleotide; superresolution.


Conflict of interest statement

The authors declare no conflict of interest.

Figures

Fig. 1.
Fig. 1.
Implementation of OligoMiner. (A) Schematic overview of the Oligopaints. (B) Schematic overview of the OligoMiner pipeline. (C and D) Schematic overviews of LDA model (C) creation and (D) implementation. (E) Receiver operating characteristic curves for each temperature-specific LDA model. auc, area under the curve. (F) Heat map showing the support-weighted F1 score for each temperature-specific LDA model when tested against validation data simulated at each of the six indicated temperatures. (G) Description of utility scripts also developed as part of OligoMiner.
Fig. 2.
Fig. 2.
Genome-scale probe discovery with OligoMiner. (A) Description of three parameter sets used for genome-scale mining runs. (BE) Box plots displaying overall mining times and rates for UM (B and C) and LDM (D and E). Each chromosome was run separately and reported, resulting in 24 data points per parameter setting and a total of 72 data points per plot. The mean rate or time for all 72 data points is displayed beneath each box plot. (F and G) Swarm plots displaying changes in probe density (i.e., probes per kilobase) that occurred over the course of the pipeline in UM (F) and LDM (G). bP, blockParse; kF, kmerFilter; oC, outputClean. (H) Swarm plot displaying probe densities in the C. elegans (ce11), D. melanogaster (dm6), zebrafish (danRer10), human (hg38), mouse (mm10), and A. thaliana (tair10) genome assemblies after whole-genome mining using LDM and kmerFilter.
Fig. 3.
Fig. 3.
OligoMiner enables highly efficient FISH. (A and B) Representative single-channel minimum-maximum (min-max) contrasted image (Left) and two-color image with manual contrast adjustment (Right) (A) and signal number quantification (B) of 3D FISH experiment performed with a probe set consisting of 4,776 UM oligos targeting 817 kb at Xq28 in human XX 2N WI-38 fibroblasts. (C and D) Representative single-channel min-max contrasted image (C, Left) and two-color contrast-adjusted (C, Right) and signal number quantification (D) of 3D FISH experiment performed with a probe set consisting of 3,678 LDM oligos targeting 1,035 kb at 19p13.2 in human XY 2N PGP-1 fibroblasts. (E) Quantification of background-subtracted SNR for the Xq28 and 19p13.2 probes. (F) Three-color 3D FISH experiment performed using ATTO 488-labeled “X.1” (green), ATTO 565-labeled “X.2” (magenta), and Alexa Fluor 647-labeled “X.3” UM probe sets targeting adjacent regions on Xq28 in WI-38 fibroblasts. (G and H) Two-color metaphase FISH experiment performed using ATTO 488-labeled “X.1” (green) and Alexa Fluor 647-labeled “X.2” (magenta) UM probe sets targeting adjacent regions on Xq28 on XX 46N (G) and XY 46N (H) chromosome spreads. (I and J) Two-color metaphase FISH experiment performed using Alexa Fluor 647-labeled “19.1” (green) and Cy3B-labeled “19.2” (magenta) LDM probe sets targeting adjacent regions on 19p13.2 on XX 46N (I) and XY 46N (J) chromosome spreads. All images in are maximum-intensity projections in Z. DNA is stained with DAPI (blue) in multichannel images. In GJ, the multicolor images of the full spread and single-channel images (Inset) are min-max contrasted and the multichannel images (Inset) have manual contrast adjustments. (Scale bars: 10 µm; GJ, Inset, 1 µm.) For each image, the minimum and maximum pixel intensity value used to set the display scale is indicated in the lower left.
Fig. 4.
Fig. 4.
Single-molecule superresolution imaging of OligoMiner oligos. (A and B) Diffraction-limited (A) and superresolved STORM (B) images of a probe set consisting of 3,678 LDM oligos targeting 1,035 kb at 19p13.2 in human XY 2N PGP-1 fibroblasts. (C and D) Diffraction-limited (C) and superresolved STORM (D) images of a probe set consisting of 104 LDM oligos targeting 20 kb at 19p13.2 in PGP-1 fibroblasts. (E and F) Diffraction-limited (E) and superresolved DNA-PAINT (F) images of a probe set consisting of 4,776 UM oligos targeting 817 kb at Xq28 in human XY 2N MRC-5 fibroblasts. (G and H) Diffraction-limited (G) and superresolved DNA-PAINT (H) images of a probe set consisting of 176 LDM oligos targeting 11 kb of the Xist RNA in human XX 2N WI-38 fibroblasts. (iviii) Normalized single-molecule counts along the indicated 1D line traces (blue bars) and one- or two-component Gaussian fits to the underlying data (black lines). Superresolution data are presented using a “hot” color map in which single-molecule localization density scales from black (lowest) to red to yellow to white (highest). (Scale bars: 500 nm.) The minimum and maximum values of detected photons per square nanometer used to set the display scale is shown to right of each superresolution image, and the SD of the Gaussian blur used in the construction of each superresolution image is denoted in the top right corner.

References

    1. Pardue ML, Gall JG. Molecular hybridization of radioactive DNA to the DNA of cytological preparations. Proc Natl Acad Sci USA. 1969;64:600–604. - PMC - PubMed
    1. John HA, Birnstiel ML, Jones KW. RNA-DNA hybrids at the cytological level. Nature. 1969;223:582–587. - PubMed
    1. Buongiorno-Nardelli M, Amaldi F. Autoradiographic detection of molecular hybrids between RNA and DNA in tissue sections. Nature. 1970;225:946–948. - PubMed
    1. Lawrence JB, Singer RH. Quantitative analysis of in situ hybridization methods for the detection of actin gene expression. Nucleic Acids Res. 1985;13:1777–1799. - PMC - PubMed
    1. van der Ploeg M. Cytochemical nucleic acid research during the twentieth century. Eur J Histochem. 2000;44:7–42. - PubMed

Publication types