. 2018 Mar 6;115(10):2478-2483.
doi: 10.1073/pnas.1714717115. Epub 2018 Feb 20.

Transcriptional factor ICER promotes glutaminolysis and the generation of Th17 cells

Affiliations

Transcriptional factor ICER promotes glutaminolysis and the generation of Th17 cells

Michihito Kono et al. Proc Natl Acad Sci U S A. .

Abstract

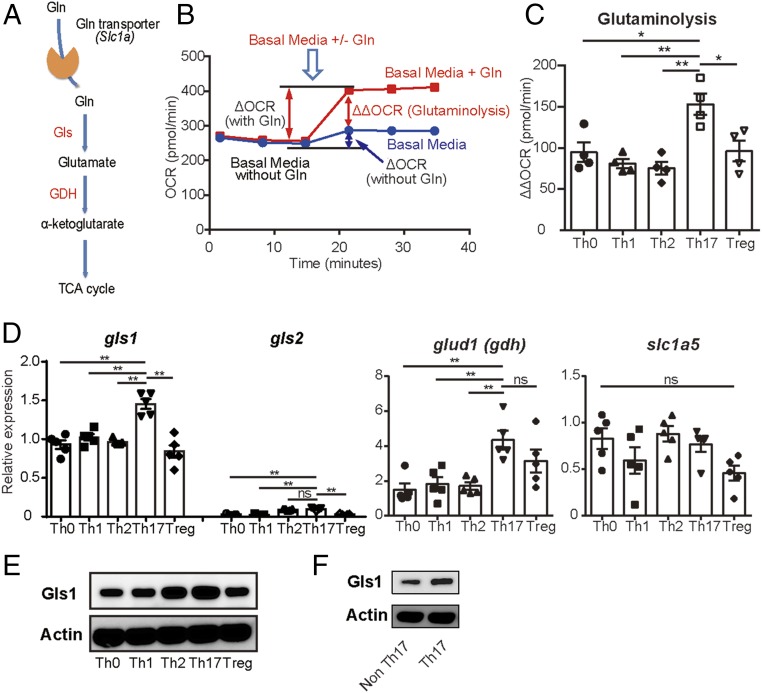
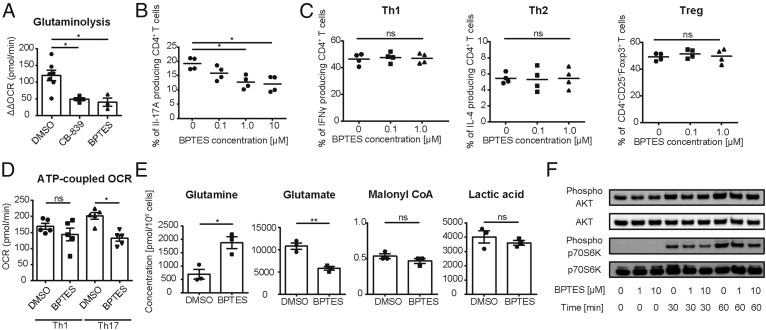
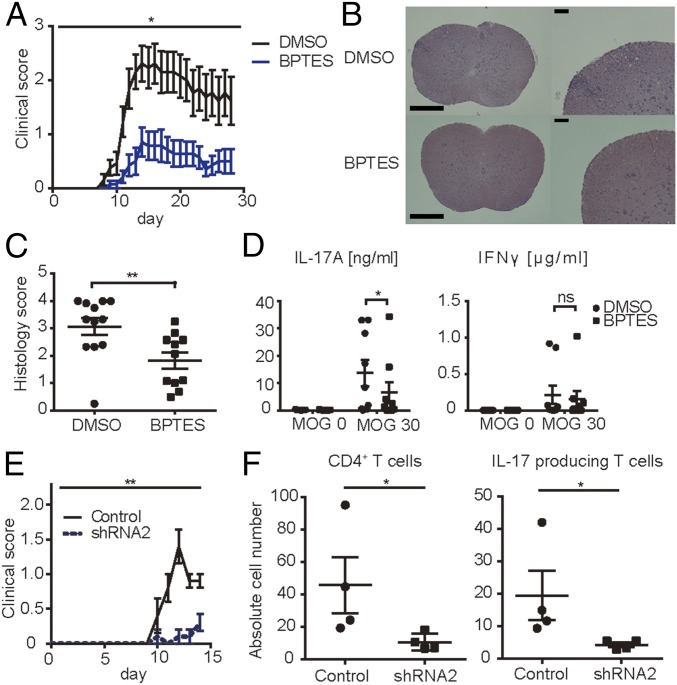
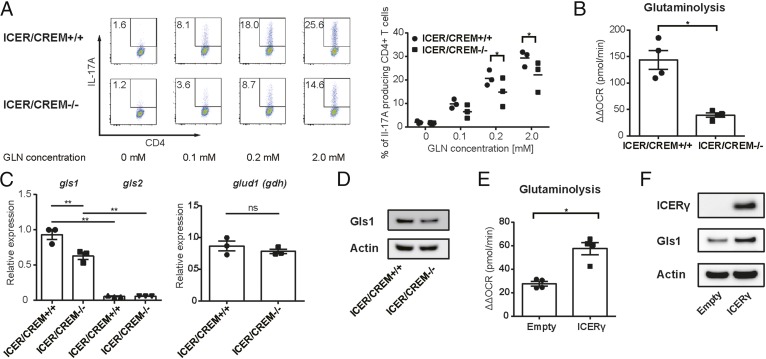
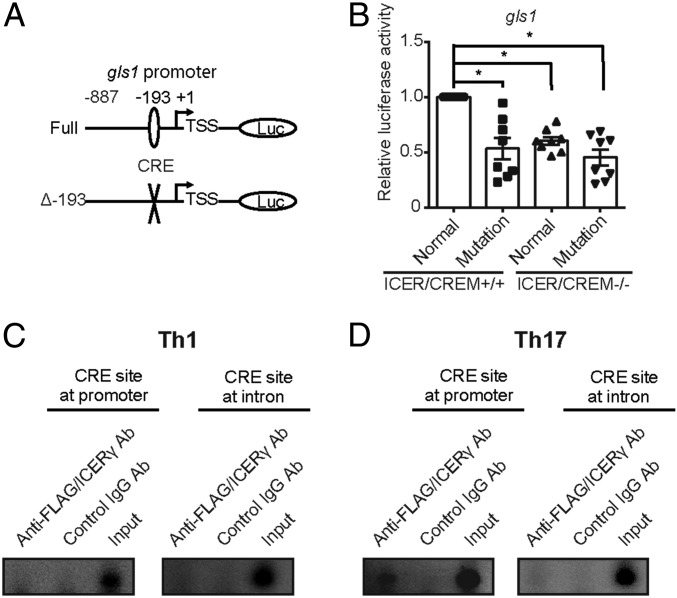
Glutaminolysis is a well-known source of energy for effector T cells but its contribution to each T cell subset and the mechanisms which are responsible for the control of involved metabolic enzymes are not fully understood. We report that Th17 but not Th1, Th2, or Treg cell induction in vitro depends on glutaminolysis and the up-regulation of glutaminase 1 (Gls1), the first enzyme in the glutaminolysis pathway. Both pharmacological and siRNA-based selective inhibition of Gls1 reduced in vitro Th17 differentiation and reduced the CD3/TCR-mediated increase of the mammalian target of rapamycin complex 1 activity. Treatment of mice with a Gls1 inhibitor ameliorated experimental autoimmune encephalomyelitis. Furthermore, RAG1-deficient mice that received Gls1-shRNA-transfected 2D2 T cells had reduced experimental autoimmune encephalomyelitis scores compared with those that received control-shRNA-treated cells. Next we found that T cells deficient in inducible cAMP early repressor (ICER), a transcriptional factor known to promote Th17 differentiation, display reduced activity of oxidative phosphorylation rates in the presence of glutamine and reduced Gls1 expression, both of which could be restored by ICER overexpression. Finally, we demonstrate that ICER binds to the gls1 promoter directly and increases its activity. These findings demonstrate the importance of glutaminolysis in the generation of Th17 and the direct control of Gls1 activity by the IL-17-promoting transcription factor ICER. Pharmaceutical modulation of the glutaminolysis pathway should be considered to control Th17-mediated pathology.

Keywords: ICER; Th17; autoimmunity; glutaminase 1; glutaminolysis.


Conflict of interest statement

The authors declare no conflict of interest.

Figures

Fig. 1.
Fig. 1.
Th17 cells depend on glutaminolysis more than the other T cell subsets. (A) Enzymes involved in the glutaminolysis pathway. (B) Schematic representations of the experiments performed to measure glutaminolysis [ΔΔoxygen consumption rate (OCR)] by extracellular flux analyzer. ΔOCR with Gln: change amount of oxidative consumption by supplying glutamine-containing media. ΔOCR without Gln: change amount of oxidative consumption by supplying Gln-free media. Glutaminolysis (ΔΔOCR) was determined by subtracting ΔOCR without Gln from ΔOCR with Gln. (CE) Naïve CD4+ T cells were polarized under the indicated conditions. (C) OCR was measured by extracellular flux analyzer. Cumulative data of calculated ΔΔOCR on day 2 are shown (mean ± SEM); n = 4. (D) The relative gene expressions of the indicated molecules on day 3 were measured by qRT-PCR. Cumulative data are shown (mean ± SEM); n = 5. (E) Gls1 and actin protein expression on day 3 were assessed by Western blotting. Representative blots are shown. Data are representative of three experiments. (F) Naïve CD4+ T cells from IL-17GFP mice were polarized under Th17 conditions for 3 d. Gls1 and actin protein expression of FACS-sorted GFP+ (IL-17A–producing cells) and GFP (IL-17A–nonproducing cells) were assessed by Western blotting. Representative blots are shown. Data are representative of three experiments. *P < 0.05; **P < 0.01. ns, not significant.
Fig. 2.
Fig. 2.
Gls1 is requisite for Th17 differentiation. (A) Naïve CD4+ T cells were cultured under Th17-polarizing conditions and DMSO, CB-839, or BPTES was added on day 0. Oxygen consumption rate (OCR) was measured by extracellular flux analyzer on day 2. Cumulative data of calculated ΔΔOCR are shown (mean ± SEM); n = 3–7. (B) Naïve CD4+ T cells were cultured under Th17-polarizing conditions in the presence of increasing concentration of BPTES (0–10 μM) for 3 d. Percentage of IL-17A–positive cells was measured by flow cytometry. Cumulative data are shown (mean ± SEM); n = 4. (C) Naïve CD4+ T cells were cultured under Th1-, Th2-, and Treg-polarizing conditions for 3 d in the presence of increasing concentration of BPTES (0–1 μM) for 3 d. Percentage of IFNγ+ (Th1), IL-4+ (Th2), or CD25+Foxp3+–cells (Tregs) were measured by flow cytometry. Cumulative data are shown (mean ± SEM); n = 4. (D) Naïve CD4+ T cells were cultured under Th1- and Th17-polarizing conditions in the presence of DMSO or BPTES for 2 d. ATP-coupled OCR was assessed by extracellular flux analyzer. Cumulative data are shown (mean ± SEM); n = 5. (E) Naïve CD4+ T cells were cultured under Th17-polarizing conditions in the presence of DMSO or BPTES for 2 d. Absolute concentrations of each indicated metabolite were determined by CE-MS analysis. Cumulative data are shown (mean ± SEM); n = 3. (F) Naïve CD4+ T cells were stimulated in the presence of BPTES (0, 1, or 10 μM). Expression of phosphorylated-AKT, AKT, phosphorylated-p70S6K, and p70S6K were assessed by Western blot analysis. Representative blots of those proteins at 0, 30, and 60 min of stimulation are shown. Data are representative of three independent experiments. *P < 0.05; **P < 0.01. ns, not significant.
Fig. 3.
Fig. 3.
Gls1 inhibition ameliorates EAE. (AD) EAE was induced in B6 mice by immunization with MOG35–55 emulsified in complete Freund’s adjuvant. Mice were treated with DMSO or BPTES twice a week intraperitoneally. (A) Clinical scores. Cumulative results of three independent experiments with three to five mice per group are shown (mean ± SEM). (B) Spinal cords were harvested at day 14 and stained with H&E to assess inflammation. [Scale bars, 500 μm or 100 μm (magnified panels).] (C) Quantitative cumulative data are shown (mean ± SEM); n = 11–12. (D) Mononuclear cells harvested from inguinal lymph nodes of DMSO- or BPTES-treated mice on day 8 were activated in vitro with MOG35–55 for 3 d. IL-17A and IFNγ concentrations were measured by ELISA. Cumulative data are shown (mean ± SEM); n = 8–9. (E and F) Naïve CD4+ T cells from 2D2 mice were cultured under Th17-polarizing conditions. Gls1 shRNA- or control shRNA-containing lentiviral particles were infected on day 1. On day 4 of culture, those harvested cells were transferred to recipient Rag1-deficient mice intravenously. (E) Clinical scores of recipient mice. Cumulative results of five mice per group are shown (mean ± SEM). (F) Absolute cell numbers of spinal cord-infiltrated CD4+ T cells, IL-17A–producing CD4+ T cells, and IFNγ-producing CD4+ T cells from DMSO- or BPTES-treated mice evaluated by flow cytometry on day 14. Cumulative data are shown (mean ± SEM); n = 4. *P < 0.05; **P < 0.01. ns, not significant.
Fig. 4.
Fig. 4.
ICER/CREM-deficient mice display decreased Gls1 expression, glutaminolysis, and Th17 polarization. (A) ICER/CREM-deficient or -sufficient naïve CD4+ T cells as cultured under Th17-polarizing condition in media containing the indicated doses of glutamine (Gln) (0–2.0 mM) for 3 d. Representative flow plots (Left) and cumulative data (Right) are shown (mean ± SEM); n = 3. (BD) ICER/CREM-deficient or -sufficient naïve CD4+ T cells as cultured under Th17-polarizing conditions. (B) Calculated ΔΔOCRs on day 2. Cumulative data are shown (mean ± SEM); n = 4. (C) Relative gene expressions of the gls and glud1 (gdh) on day 3 as assessed by qRT-PCR. Cumulative data are shown (mean ± SEM); n = 3. (D) Gls1 and actin protein expression on day 3 as assessed by Western blotting. Representative blots are shown. Data are representative of three experiments. (E and F) ICER/CREM-deficient naïve CD4+ T cells as cultured under Th17-polarizing conditions. Empty vector (empty) or ICERγ expressing (ICERγ) plasmids were transfected to cultured T cells on day 1. (E) Calculated ΔΔOCRs on day 2. Cumulative data are shown (mean ± SEM); n = 4. (F) ICERγ, Gls1, and actin protein expression on day 3 as assessed by Western blotting. Representative blots are shown. Data are representative of three experiments. *P < 0.05; **P < 0.01. ns, not significant.
Fig. 5.
Fig. 5.
ICERγ binds to the gls1 promoter directly and increases its activity. (A) Schematic representations of the reporter constructs. Numbers represent the position from transcription start site (TSS) of the murine gls1 gene. (BD) ICER/CREM-deficient or -sufficient naïve CD4+ T cells as cultured under Th17- (B and C) and Th1- (D) polarizing conditions. (B) The full-length gls1 promoter region (full) or a version containing a mutated CRE binding site (Δ-193) transfected to Th17-polarized T cells on day 1. Cells were harvested and lysed on day 2. Cumulative results of eight independent experiments are shown (mean ± SEM). (C and D) FLAG-tagged ICERγ overexpression vector transfected to ICER/CREM-deficient CD4+ T cells on day 1. Cells were harvested and lysed on day 3 and binding of FLAG/ICERγ to the CRE was assessed by chromatin immunoprecipitation (ChIP) assay. CRE at the first intron of the gls1 gene was used as a negative control for ChIP enrichment. Representative blots from three experiments are shown. *P < 0.05.

References

    1. Park H, et al. A distinct lineage of CD4 T cells regulates tissue inflammation by producing interleukin 17. Nat Immunol. 2005;6:1133–1141. - PMC - PubMed
    1. Korn T, Bettelli E, Oukka M, Kuchroo VK. IL-17 and Th17 cells. Annu Rev Immunol. 2009;27:485–517. - PubMed
    1. Di Cesare A, Di Meglio P, Nestle FO. The IL-23/Th17 axis in the immunopathogenesis of psoriasis. J Invest Dermatol. 2009;129:1339–1350. - PubMed
    1. Ooi JD, Kitching AR, Holdsworth SR. Review: T helper 17 cells: Their role in glomerulonephritis. Nephrology (Carlton) 2010;15:513–521. - PubMed
    1. MacIver NJ, Michalek RD, Rathmell JC. Metabolic regulation of T lymphocytes. Annu Rev Immunol. 2013;31:259–283. - PMC - PubMed

Publication types

MeSH terms