. 2018 Mar 6;115(10):E2238-E2245.
doi: 10.1073/pnas.1713845115. Epub 2018 Feb 20.

Light-activated protein interaction with high spatial subcellular confinement

Affiliations

Light-activated protein interaction with high spatial subcellular confinement

Lorena Benedetti et al. Proc Natl Acad Sci U S A. .

Abstract

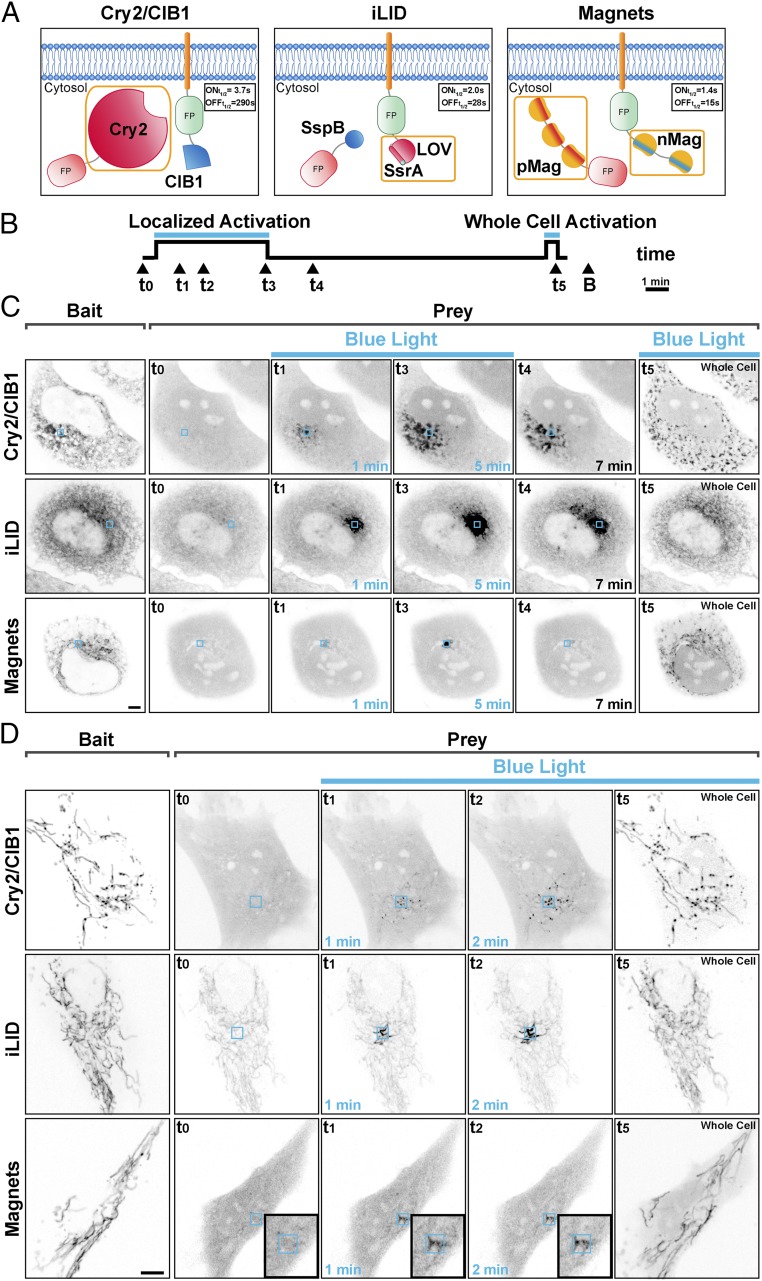
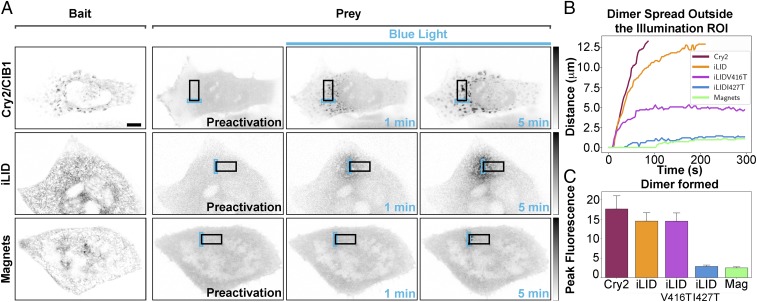
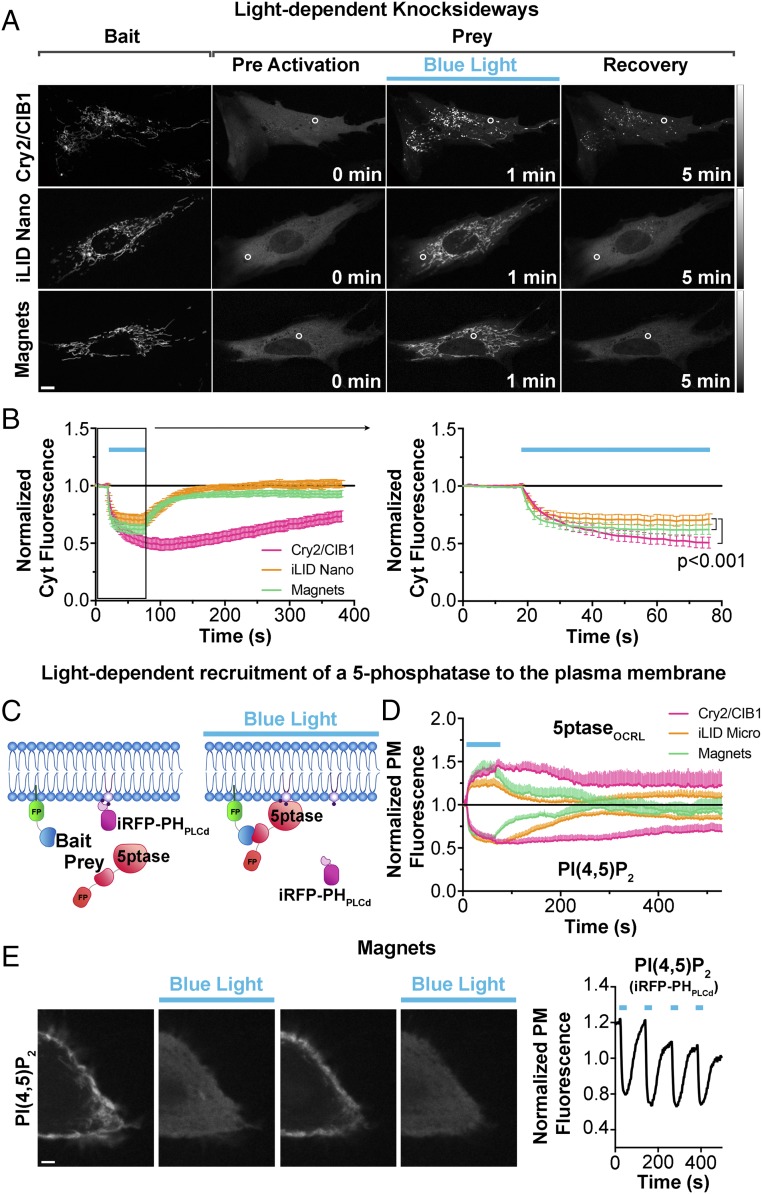
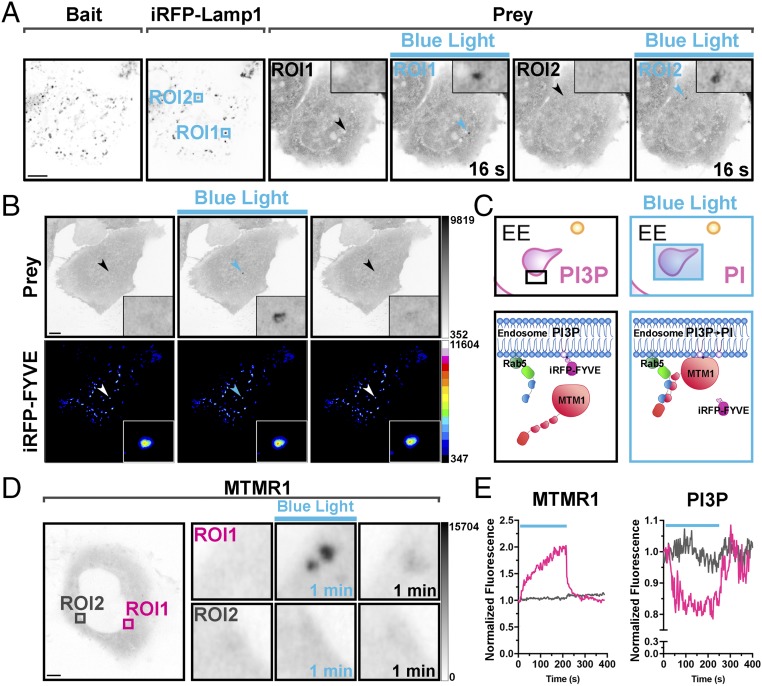
Methods to acutely manipulate protein interactions at the subcellular level are powerful tools in cell biology. Several blue-light-dependent optical dimerization tools have been developed. In these systems one protein component of the dimer (the bait) is directed to a specific subcellular location, while the other component (the prey) is fused to the protein of interest. Upon illumination, binding of the prey to the bait results in its subcellular redistribution. Here, we compared and quantified the extent of light-dependent dimer occurrence in small, subcellular volumes controlled by three such tools: Cry2/CIB1, iLID, and Magnets. We show that both the location of the photoreceptor protein(s) in the dimer pair and its (their) switch-off kinetics determine the subcellular volume where dimer formation occurs and the amount of protein recruited in the illuminated volume. Efficient spatial confinement of dimer to the area of illumination is achieved when the photosensitive component of the dimerization pair is tethered to the membrane of intracellular compartments and when on and off kinetics are extremely fast, as achieved with iLID or Magnets. Magnets and the iLID variants with the fastest switch-off kinetics induce and maintain protein dimerization in the smallest volume, although this comes at the expense of the total amount of dimer. These findings highlight the distinct features of different optical dimerization systems and will be useful guides in the choice of tools for specific applications.

Keywords: Cry2/CIB1; LOV domain; optical dimerizer; optogenetics; protein–protein interaction.


Conflict of interest statement

The authors declare no conflict of interest.

Figures

Fig. 1.
Fig. 1.
Spatial confinement of light-dependent protein dimerization achieved with blue-light-dependent dimerization systems. (A) Optical dimerization systems used. Protein photoreceptors are outlined by an orange box. The on and off kinetics of dimer formation, measured as the rate of recruitment and release of the prey protein to a mitochondria-anchored bait, in living cells at 37 °C is shown. (B) Experimental paradigm: Cells were illuminated within a 3-µm × 3-µm ROI with 200-ms blue-light pulses at 0.5 Hz for 5 min, allowed to recover in the absence of blue light for 12 min, and then illuminated over the entire surface with 200-ms blue-light pulses at 0.5 Hz for 30 s. The localization of the bait (B) was assessed at the end of the illumination period. (C and D) Comparison of the three systems in their property to confine bait–prey dimers to the photoexcitation area. Human fibroblastic cells expressing a soluble prey and an ER-targeted (C) or a mitochondria-targeted (D) bait, respectively. The left columns of each row show the expression of the bait. The other images in each row show the localization of the prey at the indicated time. With the Cry2/CIB1 and with the iLID/SspB systems dimers can be observed outside the illumination ROI in an area that increases with time. With Magnets the bait–prey interaction is mainly limited to the area of photoexcitation, remains confined to this region, and is rapidly reversible. (Magnification: D, Insets, 1.7×.) (Scale bars: 5 μm.)
Fig. 2.
Fig. 2.
Quantification of the spatial confinement of dimer achieved by the three dimerization systems used. (A) HeLa cells expressing a soluble prey and an ER-tethered bait were photoexcited within a 3-µm ×10-µm ROI with 200-ms blue-light pulses at 0.5 Hz for 5 min. The area of prey–bait dimer localization for each dimerization system at 1 and 5 min after stimulation is shown. Fluorescence intensity in each time lapse is minimum–maximum-normalized (grays inverted lookup table), background-subtracted, and filtered with Gaussian blur. (Scale bar: 10 μm.) (B) Plots indicating the spatial spread of dimers away from the illuminated ROI for each system. The lines denote the maximum distance at which the normalized intensity has doubled over that of the intracellular basal intensity (n = 12 cells for Cry2/CIB1, 13 for iLID, 10 for iLID V416T, 6 for iLID I427T, and 17 for Magnets; n = 3). (C) Histograms showing the peak normalized fluorescence intensity reached by each system in the illuminated ROI after 5 min of light excitation [17.6 ± 3.4 for Cry2/CIB1, n = 12; 14.5 ± 2.2 for iLID, n = 13; 14.5 ± 2.1 for iLID V416T, n = 10; 2.9 ± 0.3 for iLID I427T, n = 6; 2.5± 0.3, n = 17 cells for Magnets (Mag); n = 3].
Fig. 3.
Fig. 3.
Comparison of the property of the three systems to recruit a prey to a membrane-bound bait upon global cell illumination. (A and B) Comparison of the efficiency of the three light-dependent dimerization systems in the blue-light-dependent (200-ms pulses at 0.5 Hz for 1 min) removal of a protein from the soluble cytosolic phase by sequestering it to the outer surface of mitochondria (so-called knocksideways; ref. 47) in human primary fibroblasts. Confocal microsopy images are shown in A (Scale bar: 10 μm; grays lookup table) and the quantification of the data is shown in B. Curves in B show a soluble prey’s removal from, and then reappearance into, the cytosol (the cytosolic ROI is indicated with a white circle). The region enclosed in the black box (Left) is shown at an expanded timescale (Right). n = 23 for Cry2/CIB1, 27 for iLID Nano, and 20 for Magnets; three independent experiments. Data were examined with a two-way ANOVA followed by Tukey’s multiple comparison test, both performed with GraphPad Prism. (C and D) Comparison of the efficiency and speed of the three light-dependent dimerization systems in the recruitment to the plasma membrane of an inositol 5-phosphstase (5ptaseOCRL) to induce loss of PI(4,5)P2, as detected by the PI(4,5)P2 probe iRFP-PHPLCδ in this membrane in COS7 cells. The cartoon in C shows the experimental setup. (D) The three systems have similar efficiency in depleting PI(4,5)P2, but recovery is much faster with iLID and Magnets (n = 10 for Cry2/CIBN, 12 cells for iLID, and 12 cells for Magnets; three independent experiments). An example of the speed and reversibility of Magnets is further illustrated in E, which shows HeLa cell expressing PM-nMag(3x), mCh-pMagFast2(3x)-5ptaseOCRL, and the PI(4,5)P2 reporter iRFP-PHPLCδ. Blue-light illumination cycles were applied as 200-ms pulses at 0.5 Hz for 60 s every 1.5 min. iRFP fluorescence detected by confocal microscopy (Left) and its quantification at the cell periphery [thus reflecting PI(4,5)P2 dynamics] (Right) are shown. (Scale bar: 5 μm.)
Fig. 4.
Fig. 4.
Light-dependent recruitment of a prey protein at single-organelle resolution. (A) Localized protein recruitment to a single lysosome. HeLa cell expressing Lys-nMag (bait), pMagFast2(3x)-tgRFPt (prey), and iRFP-Lamp1 (lysosomal marker). iRFP fluorescence was used to select the area of blue-light illumination (arrows). Blue boxes indicate two areas subjected to sequential 200-ms blue-light pulses at 0.5 Hz for 2 and 1 min, for ROI1 and ROI2, respectively. The prey is recruited selectively to the illuminated lysosome as shown (Inset). (Magnification: Insets, 5×.) (Scale bar: 10 μm.) (B) Localized protein recruitment to a single endosome. HeLa cell expressing nMag-Rab5 (not shown), pMagFast2(3x)-mCherry (prey), and iRFP-FYVE [PI3P binding endosome marker]. iRFP fluorescence was used to select the endosome to be illuminated (arrows). (Insets) Prey recruitment at that endosome. (Magnification: Insets, 6×.) (Scale bar: 10 μm.) (CE) Selective reduction of PI3P levels on a single endosome (magenta box in the left micrograph of D), without affecting PI3P on the other endosomes (e.g., gray box), by the specific recruitment of the PI3P phosphatase MTMR1 to that endosome. Schematic cartoon depicting the experiment is shown in C, and a quantification of the recruitment to endosomes of MTMR1 (mCherry fluorescence) and of the levels of PI3P (iRFP fluorescence) on the same endosomes is shown in E. (Magnification: D, Right Insets, 7×.) (Scale bar: 5 μm.)

References

    1. Mohr SE, Smith JA, Shamu CE, Neumüller RA, Perrimon N. RNAi screening comes of age: Improved techniques and complementary approaches. Nat Rev Mol Cell Biol. 2014;15:591–600. - PMC - PubMed
    1. Spencer DM, Wandless TJ, Schreiber SL, Crabtree GR. Controlling signal transduction with synthetic ligands. Science. 1993;262:1019–1024. - PubMed
    1. Fegan A, White B, Carlson JCT, Wagner CR. Chemically controlled protein assembly: Techniques and applications. Chem Rev. 2010;110:3315–3336. - PubMed
    1. Putyrski M, Schultz C. Protein translocation as a tool: The current rapamycin story. FEBS Lett. 2012;586:2097–2105. - PubMed
    1. DeRose R, Miyamoto T, Inoue T. Manipulating signaling at will: Chemically-inducible dimerization (CID) techniques resolve problems in cell biology. Pflugers Arch. 2013;465:409–417. - PMC - PubMed

Publication types

MeSH terms