Crop intensification, land use, and on-farm energy-use efficiency during the worldwide spread of the green revolution
- PMID: 29463755
- PMCID: PMC5877987
- DOI: 10.1073/pnas.1717072115
Crop intensification, land use, and on-farm energy-use efficiency during the worldwide spread of the green revolution
Abstract
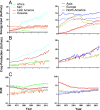
We analyzed crop production, physical inputs, and land use at the country level to assess technological changes behind the threefold increase in global crop production from 1961 to 2014. We translated machinery, fuel, and fertilizer to embedded energy units that, when summed up, provided a measure of agricultural intensification (human subsidy per hectare) for crops in the 58 countries responsible for 95% of global production. Worldwide, there was a 137% increase in input use per hectare, reaching 13 EJ, or 2.6% of the world's primary energy supply, versus only a 10% increase in land use. Intensification was marked in Asia and Latin America, where input-use levels reached those that North America and Europe had in the earlier years of the period; the increase was more accentuated, irrespective of continent, for the 12 countries with mostly irrigated production. Half of the countries (28/58), mainly developed ones, had an average subsidy >5 GJ/ha/y (with fertilizers accounting for 27% in 1961 and 45% in 2014), with most of them (23/28) using about the same area or less than in 1961 (net land sparing of 31 Mha). Most of the remaining countries (24/30 with inputs <5 GJ/ha/y), mainly developing ones, increased their cropped area (net land extensification of 135 Mha). Overall, energy-use efficiency (crop output/inputs) followed a U-shaped trajectory starting at about 3 and finishing close to 4. The prospects of a more sustainable intensification are discussed, and the inadequacy of the land-sparing model expectation of protecting wilderness via intensified agriculture is highlighted.
Keywords: EROI; Jevons paradox; land sharing; land sparing; water–energy–food security nexus.
Conflict of interest statement
The authors declare no conflict of interest.
Figures


References
-
- Carson R. Silent Spring. Houghton Mifflin Harcourt; Boston: 1962.
-
- Green MB. 1978. Eating Oil (Westview, Boulder, CO), 205 pp.
-
- Odum HT. 1971. Environment, Power and Society (Wiley, New York), 336 pp.
-
- Pimentel D, et al. Food production and the energy crisis. Science. 1973;182:443–449. - PubMed
-
- Pelletier N, et al. Energy intensity of agriculture and food systems. Annu Rev Environ Resour. 2011;36:223–246.
Publication types
MeSH terms
Substances
LinkOut - more resources
Full Text Sources
Other Literature Sources

