. 2018 Feb 20;9(1):787.
doi: 10.1038/s41467-018-03232-w.

Diverse genetic error modes constrain large-scale bio-based production

Affiliations

Diverse genetic error modes constrain large-scale bio-based production

Peter Rugbjerg et al. Nat Commun. .

Abstract

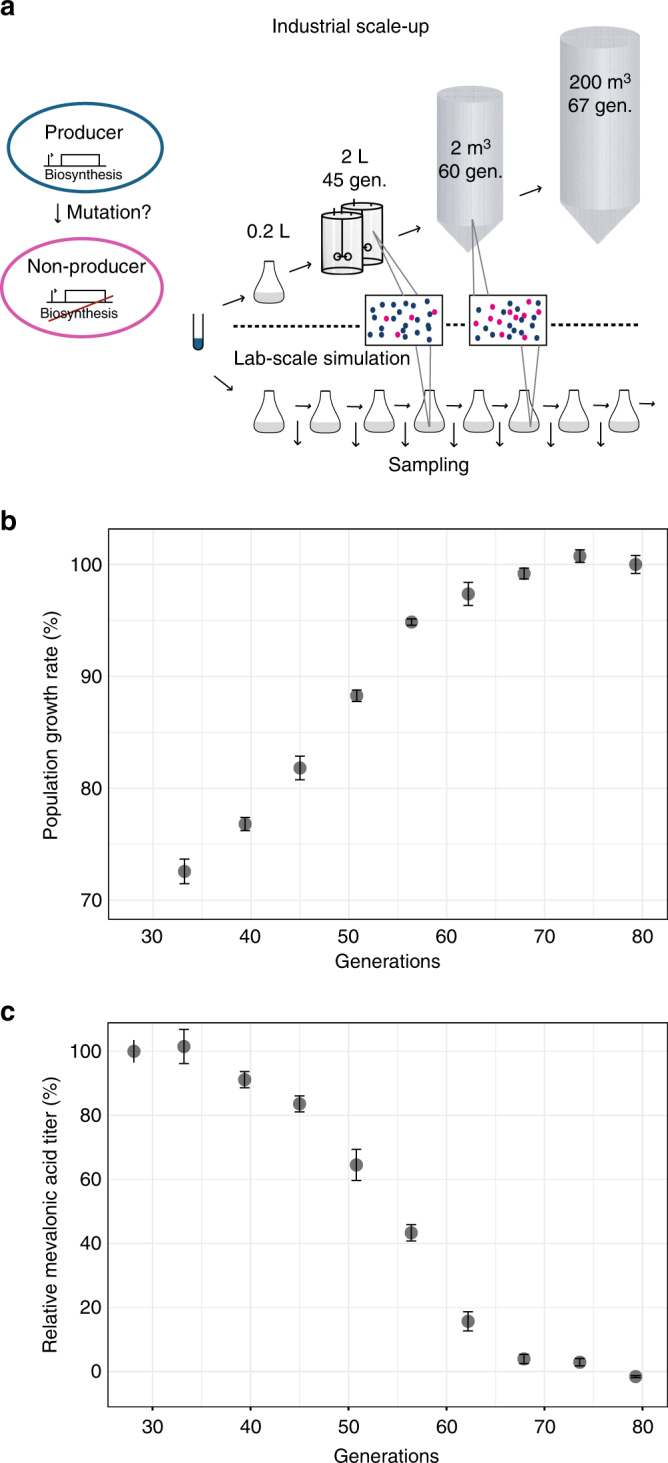
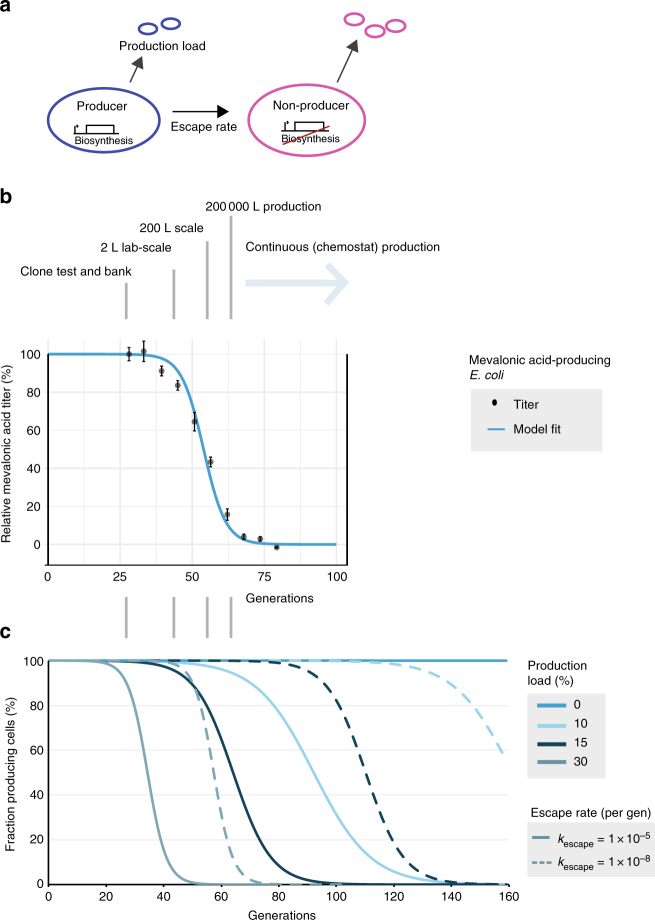
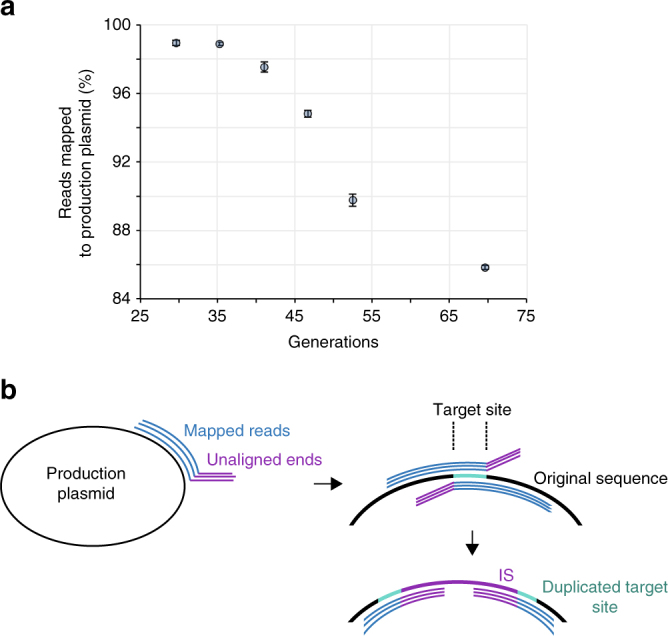
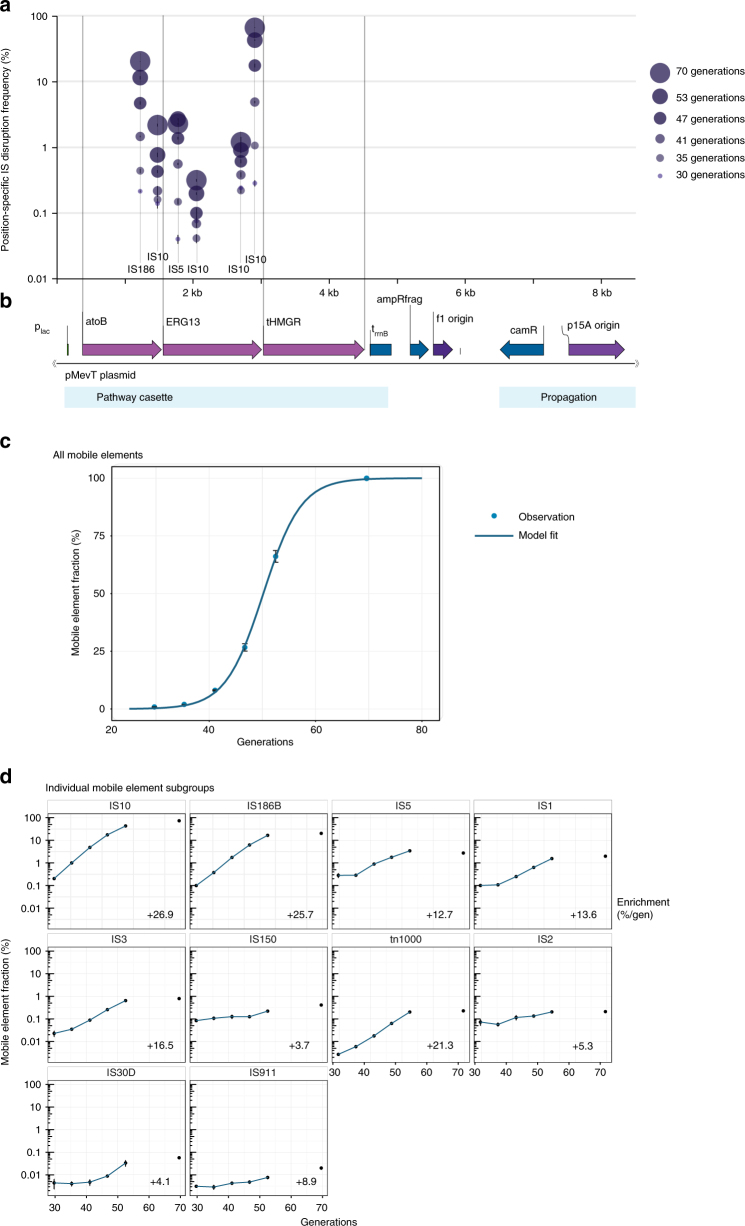
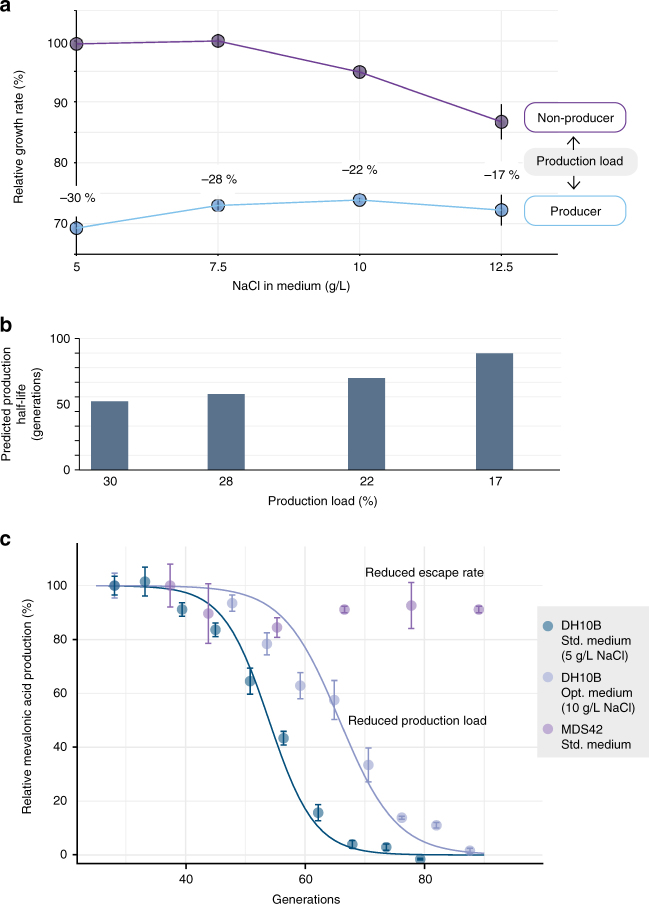
A transition toward sustainable bio-based chemical production is important for green growth. However, productivity and yield frequently decrease as large-scale microbial fermentation progresses, commonly ascribed to phenotypic variation. Yet, given the high metabolic burden and toxicities, evolutionary processes may also constrain bio-based production. We experimentally simulate large-scale fermentation with mevalonic acid-producing Escherichia coli. By tracking growth rate and production, we uncover how populations fully sacrifice production to gain fitness within 70 generations. Using ultra-deep (>1000×) time-lapse sequencing of the pathway populations, we identify multiple recurring intra-pathway genetic error modes. This genetic heterogeneity is only detected using deep-sequencing and new population-level bioinformatics, suggesting that the problem is underestimated. A quantitative model explains the population dynamics based on enrichment of spontaneous mutant cells. We validate our model by tuning production load and escape rate of the production host and apply multiple orthogonal strategies for postponing genetically driven production declines.


Conflict of interest statement

The authors declare no competing financial interests.

Figures

Fig. 1
Fig. 1
Stability of the mevalonic acid-producing phenotype. a Large-scale industrial production of mevalonic acid was simulated through serial transfer of five parallel mevalonic acid-producing populations. The length of the fermentation simulation was chosen to mimic the generation number of a fermentation population in a 200 m3 fermentation tank. Production populations were sampled every 8 h for subsequent phenotypic and genotypic analysis (Supplementary Table 2). b Population-level average local growth rates were determined for parallel populations over the course of the experiment (Methods). The means are shown relative to the last time point (absolute value 0.84/h). A transition of the mean population growth rate is observed after 35 generations, in which the population growth rate increases to a stable phenotypic state after 70 generations, alleviating the measured production load (Supplementary Fig. 1). c Mevalonic acid titers during the simulated fermentations. The means are shown relative to the earliest time point (Supplementary Table 3) and were calculated from five parallel lineages of the E. coli TOP10 mevalonic acid-producing clone. Error bars denote s.e.m. (n = 5)
Fig. 2
Fig. 2
Mathematical modeling is consistent with the observed mevalonic acid production titer. a Producer cells mutate from the production state at a specific escape rate, thereby alleviating the production load (fitness cost of production; Supplementary Note 1). b The best fit of the mathematical model (Supplementary Table 5) to the observed mevalonic acid titer throughout laboratory-simulated mevalonic acid fermentations (relative to earliest time point, Supplementary Table 3). Error bars indicate the s.e.m. (n = 5). For reference, possible reactor sizes corresponding to particular generation numbers are shown (Supplementary Table 1). c Modeled fractions of producer cells remaining in the population, in which producer cells irreversibly mutate to non-producers at various escape rates. The magnitude of the production load drives the rate by which spontaneously formed non-producers will enrich the population
Fig. 3
Fig. 3
Inferring invasion of deep-sequenced fermentation cell populations by foreign genetic material. a Percentage of total reads mapped to the production plasmid sequence declined over the course of the fermentation (cell generations; error bars depict s.e.m., n = 3, except generation 70: n = 5). b Analysis of mapped reads indicated insertion sequence (IS) transposition owing to the presence of crossed-over broken read mappings representing IS insertion and the duplication of target sites, also evident from elevated target site sequencing coverage (Supplementary Fig. 4)
Fig. 4
Fig. 4
Genetic pathway stability of a mevalonic acid-producing E. coli TOP10 clone in parallel lineages. a Time-lapse high-depth sequencing revealed rising frequencies (population fractions) of mobile element insertions. b The production plasmid pMevT, which encodes the genes atoB, ERG13, and tHMGR in the mevalonic acid pathway. c Total enrichment of mobile elements in plasmid populations over the experimentally simulated fermentation period along with the model fit. d Individual enrichment of host mobile elements in production plasmid populations over the simulated fermentation, and their percent-wise enrichment per generation in the exponential range (generations 30–53; regression statistics in Supplementary Table 7). For all the graphs, the error bars depict s.e.m. (n = 3, except at generation 70: n = 5)
Fig. 5
Fig. 5
Reducing production decline by optimization of spontaneous escape rate and production load. a Limiting the production load of mevalonic acid production by supplementing medium with elevated NaCl concentrations (i.e., minimizing the growth advantage of mutation). This reduction is evident by the growth rate difference of pure producing and non-producing populations. Growth rates depicted relative to fastest growing condition and production load calculated as relative growth rate difference. Error bars depict s.e.m. (n = 6). b Predicted half-life of a producing cell population with a 2.1 × 10–7/generation escape rate and corresponding production loads estimated from modulated NaCl levels in panel a. c Utilizing a reduced production load and escape rate, respectively, to extend production half-life in experimentally simulated long-term fermentations, evaluated by mevalonic acid production titers (relative to earliest time point; Supplementary Table 3). Results shown for a TOP10 host (h2m0) in standard (n = 5, blue data points) and in optimized medium (n = 4, generation 49: n = 3, blue-gray data points) and for an MDS42 host (h10m0) with reduced escape rate (n = 4, purple data points). Error bars depict s.e.m. Lines represent best fits to population fraction model at a 2.1 × 10–7/generation escape rate (Supplementary Table 5). Data for TOP10 host in std. medium also shown in Fig. 2b is included for comparison
Fig. 6
Fig. 6
Pathway-coupled essential gene reshapes the long-term production error profile. a Genetic pathway design of control (h2) and transcriptionally coupled essential pathway gene (kle1#1). b Mevalonic acid titers (relative to earliest point) (Supplementary Table 3) in experimentally simulated fermentations of control pMevT h2 and pathway-coupled essential gene strain kle1#1 (Supplementary Table 9). c Fraction (%) in pathway population of the three most abundant pathway-disrupting IS types, compared to summed frequencies of pathway SNPs (Supplementary Table 10). Error bars denote s.e.m. (n = 3)

References

    1. Nielsen J, Keasling J. Engineering cellular metabolism. Cell. 2016;164:1185–1197. doi: 10.1016/j.cell.2016.02.004. - DOI - PubMed
    1. Borkowski O, Ceroni F, Stan G, Ellis T. Overloaded and stressed: wholecell considerations for bacterial synthetic biology. Curr. Opin. Microbiol. 2016;33:123130. doi: 10.1016/j.mib.2016.07.009. - DOI - PubMed
    1. Kumar PK, Maschke HE, Friehs K, Schügerl K. Strategies for improving plasmid stability in genetically modified bacteria in bioreactors. Trends Biotechnol. 1991;9:279–284. doi: 10.1016/0167-7799(91)90090-5. - DOI - PubMed
    1. Ikeda M. Amino acid production processes. Adv. Biochem. Eng. Biotechnol. 2003;79:1–35. - PubMed
    1. Stanbury, P., Whitaker, A., Hall, S.J. in Principles of Fermentation Technology, 2nd edition, Butterworth-Heinemann (1995).

Publication types