. 2018 Mar;21(3):329-340.
doi: 10.1038/s41593-018-0083-7. Epub 2018 Feb 20.

Microglia-mediated recovery from ALS-relevant motor neuron degeneration in a mouse model of TDP-43 proteinopathy

Affiliations

Microglia-mediated recovery from ALS-relevant motor neuron degeneration in a mouse model of TDP-43 proteinopathy

Krista J Spiller et al. Nat Neurosci. 2018 Mar.

Abstract

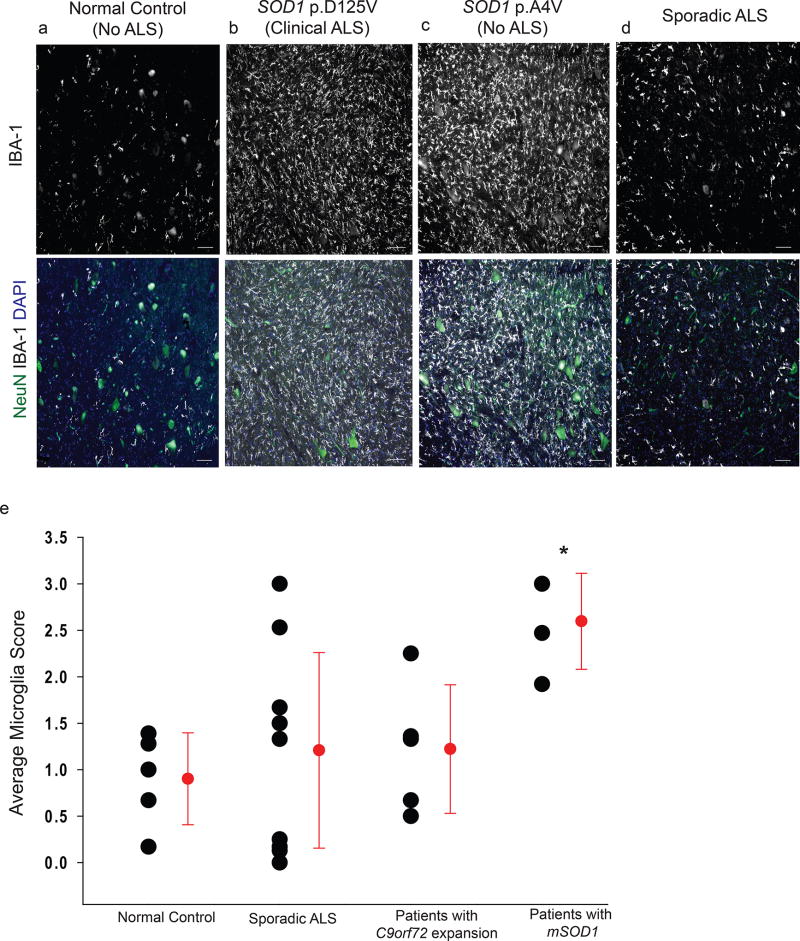
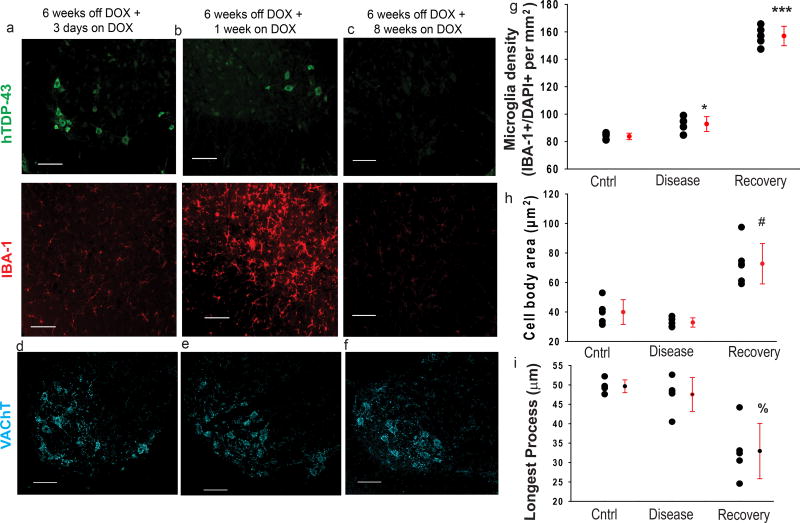
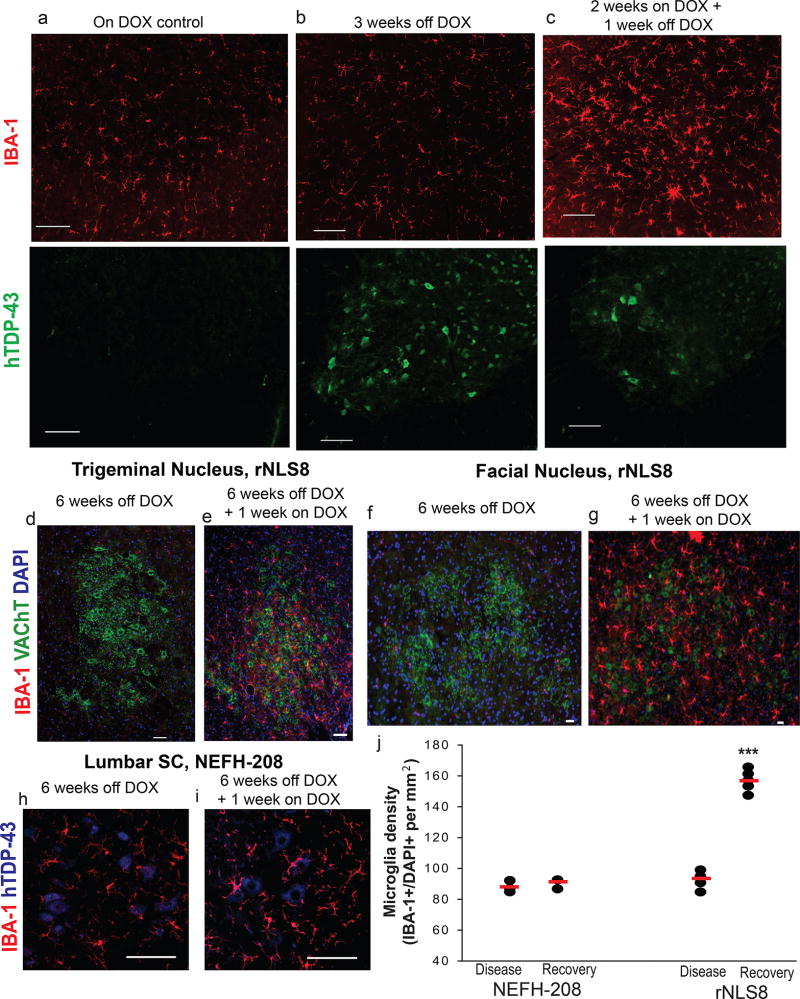
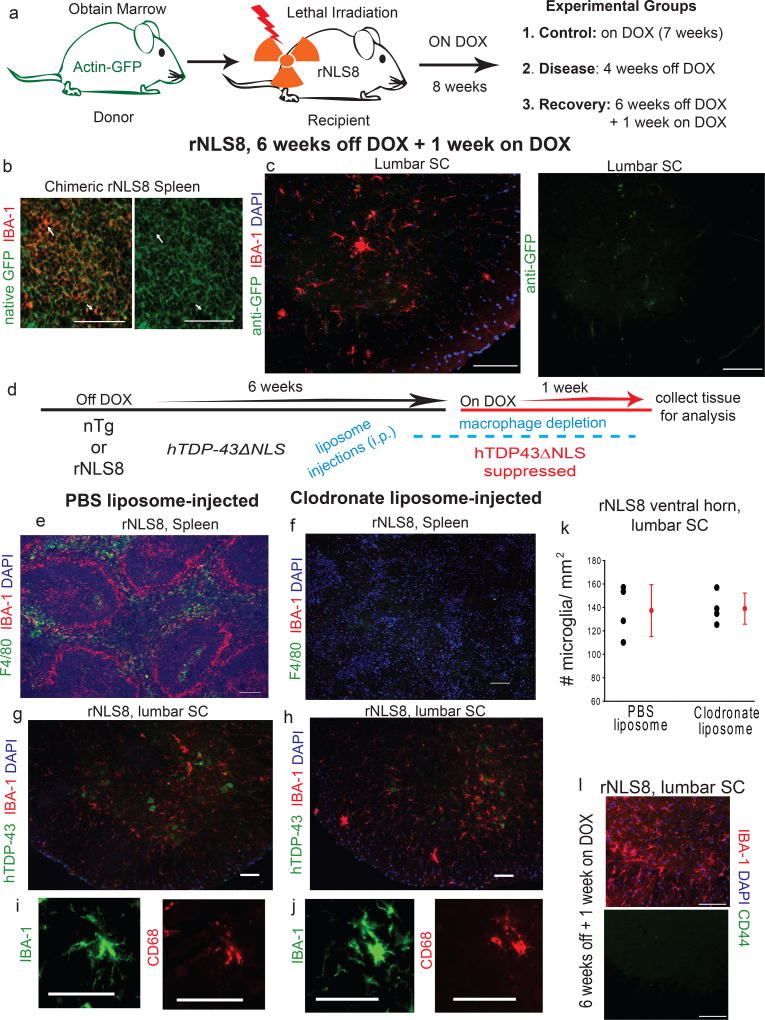
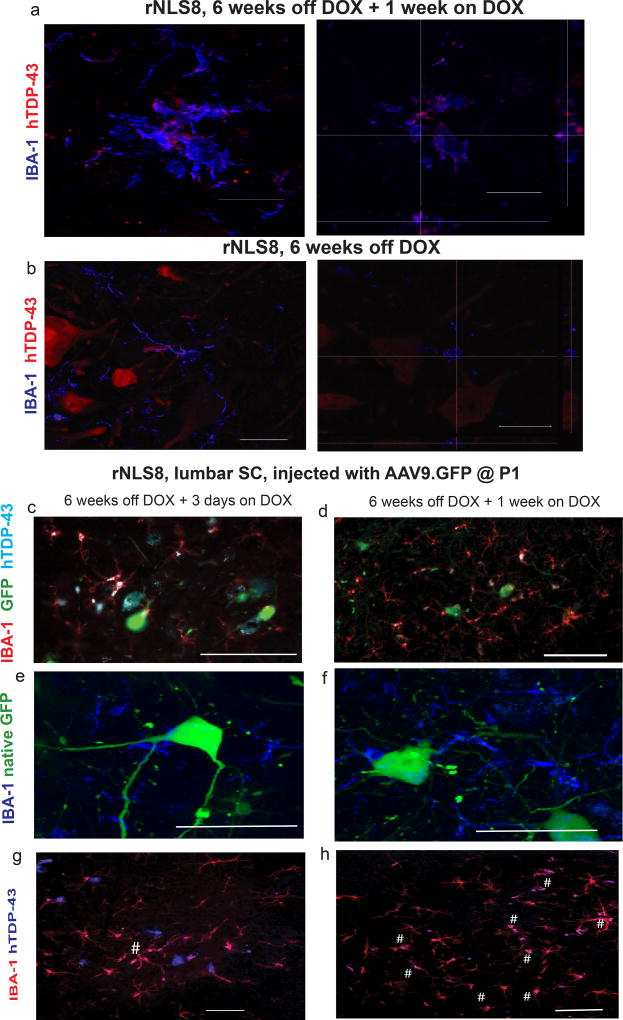
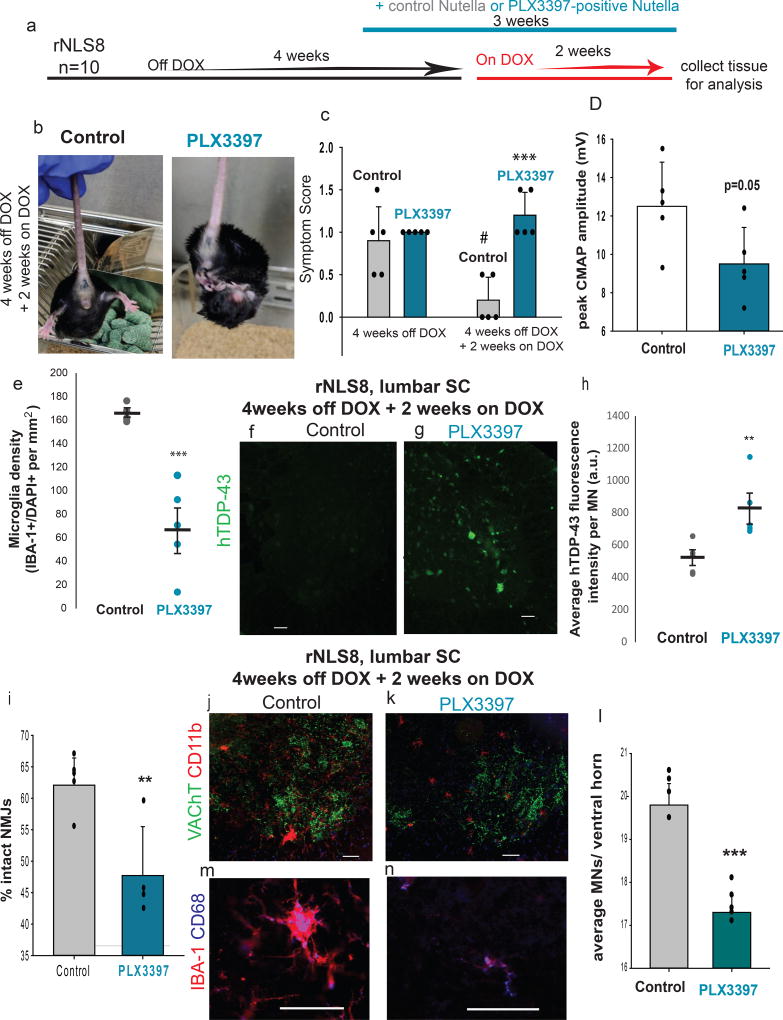
Though motor neurons selectively degenerate in amyotrophic lateral sclerosis, other cell types are likely involved in this disease. We recently generated rNLS8 mice in which human TDP-43 (hTDP-43) pathology could be reversibly induced in neurons and expected that microglia would contribute to neurodegeneration. However, only subtle microglial changes were detected during disease in the spinal cord, despite progressive motor neuron loss; microglia still reacted to inflammatory triggers in these mice. Notably, after hTDP-43 expression was suppressed, microglia dramatically proliferated and changed their morphology and gene expression profiles. These abundant, reactive microglia selectively cleared neuronal hTDP-43. Finally, when microgliosis was blocked during the early recovery phase using PLX3397, a CSF1R and c-kit inhibitor, rNLS8 mice failed to regain full motor function, revealing an important neuroprotective role for microglia. Therefore, reactive microglia exert neuroprotective functions in this amyotrophic lateral sclerosis model, and definition of the underlying mechanism could point toward novel therapeutic strategies.


Conflict of interest statement

Competing financial interests:

T.C.F., R.G.C., and C.R. are employees and stockholders of Biogen, Inc.

Figures

Figure 1
Figure 1. There are only slight changes in microglia density and morphology during disease progression in rNLS8 mouse SC
(a) Schematic showing the time course of neuromuscular decline in rNLS8 mice after chronic hTDP43ΔNLS expression triggered by DOX removal. (b–g) Representative images from lumbar SC of 1 of 5 rNLS8 mice with similar staining, examined at 0, 2, and 8 weeks off DOX. (b) Before DOX removal, MNs (VAChT, red) do not express hTDP-43 (red) and microglia have a resting morphology. (c) By 2 weeks off DOX, the cytoplasm of MNs express high levels of hTDP-43, yet the microglia remain unreactive. (d) At 8 weeks off DOX, microglia appear unreactive, despite widespread nuclear clearance of TDP-43, aggregated cytoplasmic hTDP-43, and cell death. Scale bar= 100µm. (e–g) Cells expressing IBA-1 (green) and DAPI (blue) were analyzed by confocal microscopy, and determined that there were no obvious changes in morphology over the course of disease as assessed in images displayed as a maximum projected z stack of 10 confocal slices. Similar results were observed from 4 independent animals per group. Scale bar= 50 µm. (h–i) Only a slight increase in microglia at 6 weeks off DOX (n=5 per group, one way ANOVA, F3,18=10.6, p=0.004, h) and no change in the activation state are observed, as measured by % area occupied by CD68 throughout the disease course (n=4 mice per group, i). Individual data points shown with black circles with group means ± S.D. shown to the right in red.
Figure 2
Figure 2. Abundant reactive microglia are found in postmortem samples of lumbar SCs of patients with SOD1 mutations, but not consistently in samples from sALS or C9orf72 patients
(a–d) Representative images of ventral horn grey matter from 1 of 5 control patients (a), a fALS patient with a SOD1 mutation (b), a patient with a SOD1 mutation without clinical or pathological evidence of ALS (c), and 1 of the 10 patients with sporadic ALS patient (d) immunostained with IBA-1 (white) and NeuN (green) show high levels of reactive microgliosis in samples from patients with indicated mutations in SOD1, but not in sporadic ALS despite obvious MN loss. Scale bar = 100 µm (e) An average of 3 independent scores per patient shows that patients with the SOD1 mutation, but not sALS patients or those with a C9orf72 expansion, have significantly more reactive microglia in ventral horn grey matter than controls, one way ANOVA, F3,24=3.8, p=0.03. Individual data points shown with black circles with group means ± S.D. shown to the right in red. See Supplementary Table 1 for patient details.
Figure 3
Figure 3. In early disease recovery, there is an abundant increase in the number of microglia and a change in their morphology
(a–c) When the transgene is turned off, the hTDP-43 (green) begins to clear from the lumbar SC beginning at 3 days after DOX introduction (a), with most clearance happening after 1 week (b), and the hTDP-43 being totally cleared from all SC neurons by 8 weeks (c). Concurrent with this clearance, there is a dramatic increase in the number of IBA-1+ microglia (red), which peaks at 1 week on DOX (d) and then returns to baseline levels, despite no change in the number of MNs (d–f). After 1 week of transgene suppression, the microglia also have a reactive morphology, with significantly larger cell bodies (h) and shorter, thicker processes (i).(g–i) Individual data points shown with black circles with group means ± S.D. shown to the right in red. Labels “cntrl” are for rNLS8 mice maintained on DOX (n=5), “Disease” are for rNLS mice that were 6 weeks off DOX (n=5), and “Recovery” are rNLS8 mice that were off DOX for 6 weeks and then on DOX for 1 week (n=6). Analyses by one way ANOVA, (g) F2,14=307.5, *p=0.02, ***p<0.001; (h) F2,14=26.2, # p<.001; (i) F2,14=17.1,% p<0.001 . For (a–f), similar staining was observed in 6 animals per time-point. Scale bar= 100 µm.
Figure 4
Figure 4. After transgene suppression, microglial activation is independent of prior neuron death
(a–c) Representative images of rNLS8 lumbar SC stained with hTDP-43 (green) and IBA-1 (red) shows immunoreactive hTDP43ΔNLS in MNs at the 3 weeks off DOX time-point (b), but no change in microglia numbers or morphology. However, when the transgene is suppressed for 1 week, after hTDP-43 expression but prior to MN death (c), there is a dramatic increase in reactive microglia. Similar staining was seen in n=6 mice per DOX treatment group. (d–g) The same pattern of microglial activation is seen in brainstem nuclei labeled with VAChT (green) and IBA-1 (red), despite no prior cell death of trigeminal MNs (e) or facial MNs (g). Similar brainstem nuclei staining was seen in 4 rNLS8 mice per DOX treatment. (h–j) Mice with the same inducible system under the same NEFH promoter that express C-terminal fragments of hTDP-43 (amino acids 208–414) do not have the same pattern of microglial activation after neuronal expression (h) and 1 week of clearance of hTDP-43 C-terminal fragments (i), (designated NEH8-208 Recovery in the dot plot) with mean microglia density for each group indicated with the red line (j). NEFH-208, n=3 per group; rNLS8, n=5 per group.***, unpaired, two-tailed t-test, t=−17.6, p= 0.0000002. Scale bars= 100 µm
Figure 5
Figure 5. Increased microglia numbers are not the result of infiltrating myeloid cells from the periphery
(a) Experimental design: rNLS8 mice are myoablated by irradiation then injected with progenitor cells from Actin-GFP mice. 8 weeks later, animals were either maintained on DOX (n=4), had DOX removed for 4 weeks (n=6), or were 6 weeks off DOX + 1 week on DOX (n=6). (b) Representative cryosection of an irradiated rNLS8 mouse spleen stained with IBA-1 (red) shows GFP-positive macrophages, indicating the successful engraftment observed in all 16 mice. (c) At 6 weeks off DOX + 1 week on, there was increased reactive microglia in the lumbar SC (IBA-1, red), but these cells GFP (green) negative, a consistent result in all animals (d) Experimental timeline: rNLS8 mice were 6 weeks off DOX + 1 week on, and given injections (i.p.) of either clodronate or PBS-liposomes 10 days prior to analysis. (e–f) Representative cryosections of spleen from rNLS8 mice that were injected with PBS-liposomes (e) or clodronate-liposomes (f) immunostained with F4/80 (green), IBA-1 (red), and DAPI (blue) show intact splenic macrophages after PBS-liposome administration, but ablated populations after clodronate-liposome treatment. (g–k) Depleting peripheral myeloid cells had no effect on microgliosis. Individual data points shown with black circles with group means ± S.D. shown to the right in red., n=4. (l). Representative cryosection of lumbar SC from 1 of 3 rNLS8 mice during peak microgliosis shows that the microglia are negative for CD44, a marker of peripheral myeloid cells. Scale bars= 100 µm.
Figure 6
Figure 6. Transcriptional profiling of purified SC microglia reveals robust gene changes in microglia during recovery in rNLS8 mice
(a) Hierarchical clustering of late disease (purple) and early recovery (blue) samples from SC based on FDR <0.05 and fold change (FC) shows clear separation of gene expression profiles over the course of 1 week of hTDP43ΔNLS suppression. Yellow and blue indicate higher and lower expression levels, respectively. (b) Table showing the number of differentially expressed genes between indicated SC microglial samples with at least |1.5|FC. Note: There are nearly no gene changes in early disease samples, but robust changes in late disease and early recovery samples. Differential expression was determined using DESeq2, which uses the Wald test for significance testing. “Control”, n=14; “early disease”, n=7; “late disease”, n=9; “recovery”, n=9 (c) Venn diagram showing numbers of upregulated genes in late disease compared to control (green) and overlap with the downregulated genes between late disease and recovery (purple). (d) Venn diagram showing numbers of upregulated genes and overlap between late disease vs. control (green) and recovery vs. control (blue). Note: 76 genes are uniquely upregulated in recovery. (e) Volcano plot showing gene expression changes during recovery indicates many upregulated microglia genes and comparatively fewer downregulated genes, FDR <0.05 |FC| 1.5. (f) Representative image of microglia (red) and hTDP-43 (green) from 1 of 6 rNLS8 mice at 6 weeks off DOX + 3 days on DOX shows that some neurons are in close contact with reactive microglia. Scale bar = 100 µm.
Figure 7
Figure 7. Reactive microglia clear hTDP-43, and this is selective over other neuronally overexpressed cytoplasmic proteins
(a–b) Representative images of microglia (blue), and hTDP-43 (red) in an rNLS8 SC after 1 or 0 weeks of hTDP43ΔNLS suppression following 6 weeks of expression, with orthogonal views to show hTDP-43 localization. Scale bar = 25 µm. Similar results were observed in 10 cryosections from n=3 in each group by confocal microscopy. (c–h) When AAV9.GFP is overexpressed in MNs of rNLS8 mice, microglia (IBA-1+, red) do not take up GFP (green) after 3 days (c) or 7 days (d) of recovery, though the majority of microglia do contain the hTDP-43 (blue) by 1 week back on DOX. Scale bar= 100 µm. (e–f) Microglia (blue) surround GFP+ MNs, but do not themselves contain GFP. Scale bar= 50 µm. (g–h) Microglia (red) are actively clearing the hTDP-43 (blue) from the rNLS8 SC, and after 1 week back on DOX, the majority of microglia are now positive for hTDP-43 (co-positive cells labeled with #). Representative images shown from 1 of 3 mice at 6 weeks + 3 days, and 4 mice at 6 weeks + 1 week, each with similar results. Scale bar= 100 µm.
Figure 8
Figure 8. Microglia are necessary for early recovery from MN disease
(a) Timeline for experiments using PLX3397 to deplete microglia in rNLS8 mice. (b–c) rNLS8 mice given Nutella containing PLX3397 (right), but not control (left) still clasp after 2 weeks on DOX. #, paired t-test, t=3.5, d.f.=4, p=0.02, relative to control mice at 4 weeks off DOX. ***, t=−5.8, d.f.=8, p=0.0004, relative to control mice at 4 weeks off DOX + 2 weeks on. (d) PLX3397-treated mice trend towards reduced evoked CMAP. t=2.3, d.f.=8, p=0.05. (e) PLX3397 treatment reduced the density of IBA-1+ cells in SC. ***, t=5.6, d.f.=8, p=0.0005. (f–h) hTDP-43 (green) is cleared from sham-treated rNLS8 MNs (f), whereas many hTDP-43-positive MNs remain in the PLX3397-treated lumbar SC (g). (h) Quantification of average fluorescence intensity per MN in control (grey) and PLX3397-treated mice (blue) shows that the MNs in microglia-depleted animals are more hTDP-43 immunopositive; **, t=3.3, d.f.= 8, p=0.01. (i) PLX3397-treated mice (n=4) have significantly fewer intact NMJs in their TA muscles than controls. **, t=3.5, d.f.=7, p=0.009. (j–k) Representative cryosections immunostained with CD11b (red) to label microglia and VAChT (green) to label MNs. (l) There are significantly fewer MNs in PLX3397-treated mice compared to control, ***, t=8.7, d.f.=8, p=0.00002. Scale bar= 100 µm. (m–n) Many microglia (IBA-1, red) from control (m) and PLX3397-treated (n) rNLS8 mice express CD68 (blue). Scale bar= 50 µm. Bars represent mean ± S.D., n=5 per group and t-tests unpaired and two-tailed, unless otherwise specified. See Supplementary Table 2 for data summary.

Comment in

References

    1. Block ML, Zecca L, Hong JS. Microglia-mediated neurotoxicity: uncovering the molecular mechanisms. Nature reviews. Neuroscience. 2007;8:57–69. - PubMed
    1. Waisman A, Ginhoux F, Greter M, Bruttger J. Homeostasis of Microglia in the Adult Brain: Review of Novel Microglia Depletion Systems. Trends in immunology. 2015;36:625–636. - PubMed
    1. Hong S, Dissing-Olesen L, Stevens B. New insights on the role of microglia in synaptic pruning in health and disease. Current opinion in neurobiology. 2016;36:128–134. - PMC - PubMed
    1. Paolicelli RC, et al. Synaptic pruning by microglia is necessary for normal brain development. Science. 2011;333:1456–1458. - PubMed
    1. Dougherty KD, Dreyfus CF, Black IB. Brain-derived neurotrophic factor in astrocytes, oligodendrocytes, and microglia/macrophages after spinal cord injury. Neurobiology of disease. 2000;7:574–585. - PubMed

Publication types

MeSH terms