. 2018 Feb 20;9(1):724.
doi: 10.1038/s41467-018-03063-9.

Near-100 MeV protons via a laser-driven transparency-enhanced hybrid acceleration scheme

Affiliations

Near-100 MeV protons via a laser-driven transparency-enhanced hybrid acceleration scheme

A Higginson et al. Nat Commun. .

Abstract

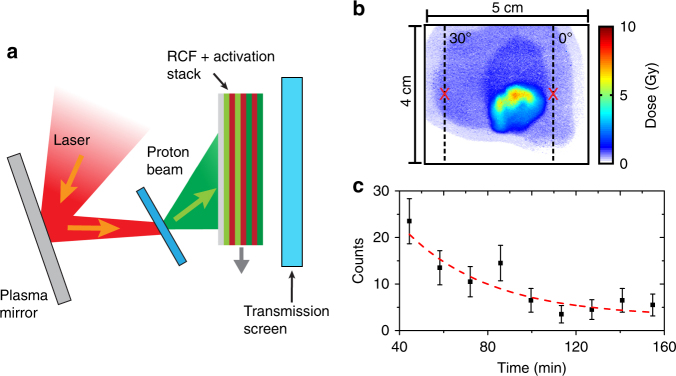
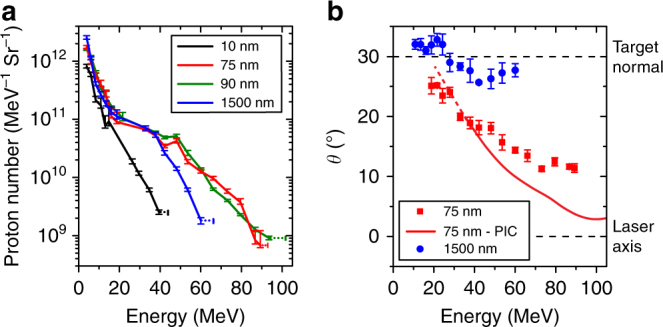
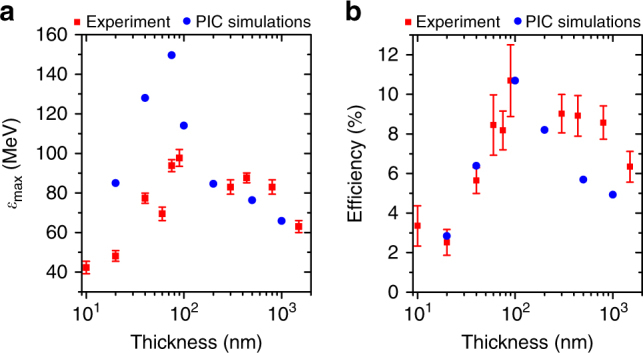
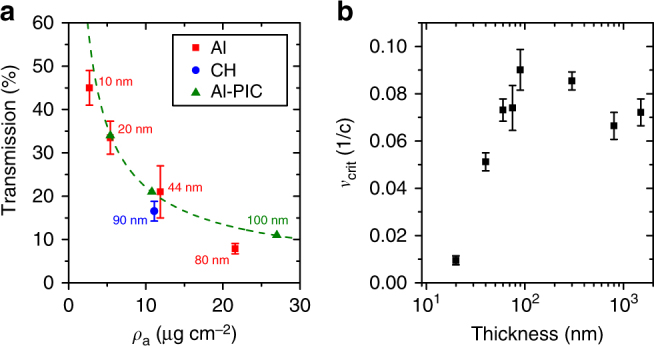
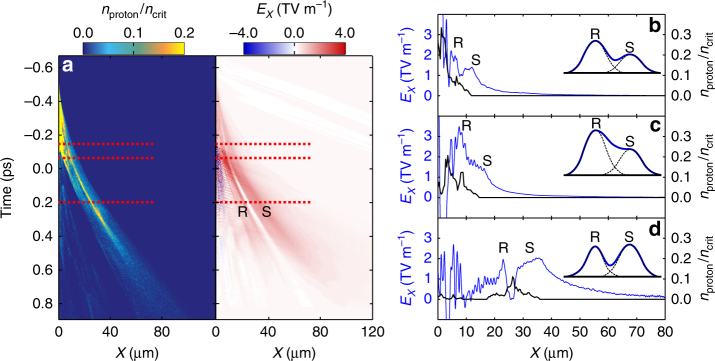
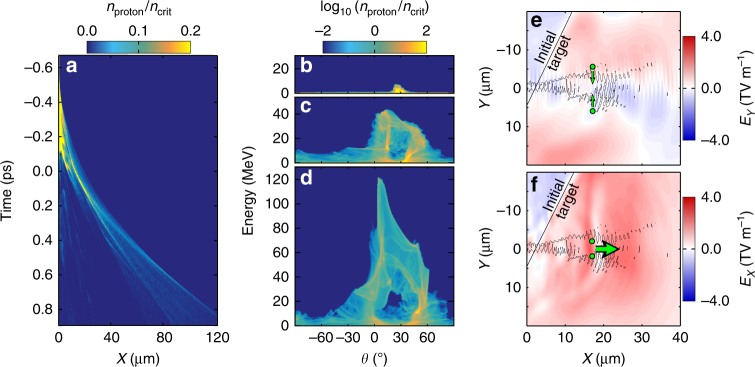
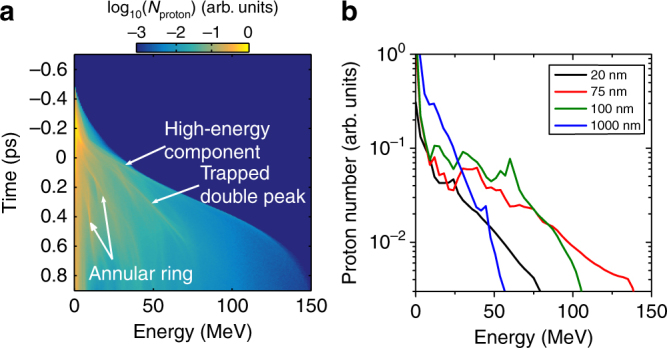
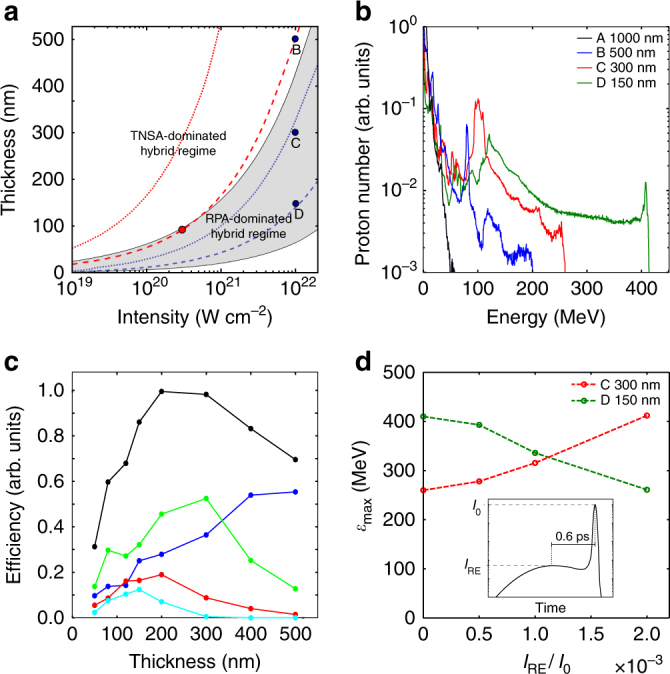
The range of potential applications of compact laser-plasma ion sources motivates the development of new acceleration schemes to increase achievable ion energies and conversion efficiencies. Whilst the evolving nature of laser-plasma interactions can limit the effectiveness of individual acceleration mechanisms, it can also enable the development of hybrid schemes, allowing additional degrees of control on the properties of the resulting ion beam. Here we report on an experimental demonstration of efficient proton acceleration to energies exceeding 94 MeV via a hybrid scheme of radiation pressure-sheath acceleration in an ultrathin foil irradiated by a linearly polarised laser pulse. This occurs via a double-peaked electrostatic field structure, which, at an optimum foil thickness, is significantly enhanced by relativistic transparency and an associated jet of super-thermal electrons. The range of parameters over which this hybrid scenario occurs is discussed and implications for ion acceleration driven by next-generation, multi-petawatt laser facilities are explored.


Conflict of interest statement

he authors declare no competing financial interests.

Figures

Fig. 1
Fig. 1
Schematic of the experiment set-up and example measurements. a A pulse from the Vulcan laser is focused by an f/3 off-axis parabola and reflected from a planar plasma mirror onto a target foil. The spatial-intensity profile of the beam of accelerated protons is measured using stacked dosimetry film (RCF), interwoven with Cu foils for nuclear activation measurements. The transmitted laser energy is characterised on a transmission screen (with the stack retracted). b Example proton beam dose distribution, as measured using RCF, for proton energies εp ≥ 89 MeV. The red markers at 0° and 30° correspond to the laser axis and target normal axis, respectively. c Example measurements of the positron-emission decay of the 63Zn radioisotope produced by proton activation of Cu in the stack (63Cu(p,n)63Zn), for protons with εp > 92 MeV. The time is measured from the time of the laser-plasma interaction and the error bars are determined from the statistical uncertainties in the measured counts. The dashed curve is a fit corresponding to the 38.5 min half-life of 63Zn, confirming proton-induced activation in the high-energy region of the filter stack
Fig. 2
Fig. 2
Measurements of proton beam spectrum and direction. a Example proton energy spectra, as deconvolved from the RCF measurements, for given foil thickness, . The horizontal error bars at the maximum energy are defined by the energy corresponding to the last RCF layer for which proton signal is measured (lower limit) and the energy of the next RCF layer (upper limit). The vertical error bars are defined by the level of uncertainty in the calibration of the RCF. b Measured angle of the centre of the proton beam, θ, with respect to the laser axis (in the plane of the incident laser beam), as a function of energy, for  = 75 nm (red) and 1.5 μm (blue). The error bars are defined by the uncertainty in determining the angle of the centre of the proton beam from application of a beam fitting routine. An example PIC simulation result for  = 75 nm (red curve) is included for comparison. The dashed lines mark the target normal and laser axis, for ease of reference
Fig. 3
Fig. 3
Scaling of the maximum proton energy and energy conversion efficiency with thickness. Measured a maximum proton energy (εmax) and b laser-to-proton energy conversion efficiency (η), as a function of foil thickness (red), together with results from 2D PIC simulations (blue). The conversion efficiencies from the simulations are scaled by a fixed value, such that the maximum value is normalised to the measured maximum efficiency. The maximum energies from the simulations are unscaled. Both proton beam parameters are maximised at an optimum target thickness range of 70–100 nm. The error bars in the maximum energy are defined by the energy corresponding to the last RCF layer for which proton signal is measured (lower limit) and the energy of the next RCF layer (upper limit). The error bars in the conversion efficiency are determined from the uncertainties in the measured proton energy spectra
Fig. 4
Fig. 4
Measurements of laser light transmission and target critical surface velocity. a Percentage of laser light transmitted as a function of target areal density (ρa) for stated thicknesses (), for plastic (blue; CH) and Al (red) foils. The error bars are determined from the uncertainties in the calibration of the light level on the transmission screen and the area of the transmitted beam sampled. Results from the 2D PIC simulations with Al foils (green; Al-PIC) are included. b Recession velocity of the critical density surface (vcrit) as a function of for plastic targets, as determined from measurements of spectral shift in second harmonic light produced at the critical density surface. The lower and upper limits of the error bars are determined from the maximum red-shifted wavelength, where the signal is resolvable above the noise level and by application of a fitting routine, respectively
Fig. 5
Fig. 5
Simulation results displaying the electron and ion density spatial profiles. ac Electron density profile at a t = −0.2 ps, b t = 0.1 ps and c t = 0.3 ps (where time t = 0 corresponds to the peak of the pulse arriving at the target). df Corresponding plots showing the proton (blue) and C6+ (green) ion density profiles
Fig. 6
Fig. 6
Simulation results illustrating the hybrid acceleration scheme. a Proton density (nproton) and longitudinal electrostatic field (EX; along the laser axis) as a function of X and time (where time t = 0 corresponds to the peak of the pulse arriving at the target) for the interaction of a 0.4 ps, 2 × 1020 W cm−2 laser pulse with a  = 75 nm plastic foil. The three dotted lines correspond to the example times considered in bd, from top to bottom, respectively. bd Longitudinal electric field (blue) and proton density (black) at b t = −0.15 ps, c t = −0.05 ps and d t = 0.2 ps. Peaks R and S are the RPA and TNSA fields, respectively. The insets in bd schematically illustrate the evolution of the dual-peaked structure
Fig. 7
Fig. 7
Simulation results illustrating the influence of the electron jet on the proton beam. a Evolution of the proton density (nproton) at angle θ = 5° (same simulation as in Fig. 6). bd Proton density and energy as a function of angle θ (with respect to the laser axis) at b t = −0.3 ps, c t = 0.1 ps and d t = 0.5 ps. e Transverse electric field (EY) with super-thermal electron jet, as shown by contours for electrons with >10 MeV at 0.1ncrit. The arrows show the direction of the resultant force on protons, as represented by the green dots. f, Same for the longitudinal electrostatic field (EX)
Fig. 8
Fig. 8
Energy spectra from the simulation results. a Temporal evolution of the proton energy spectrum for a  = 75 nm target, sampled within an angular cone of ±60° of the laser axis. Distinct proton energy components are labelled. b Proton energy spectrum at t = 0.8 ps for given foil thicknesses
Fig. 9
Fig. 9
Modelling and simulation results for multi-petawatt scale laser parameters. a -IL parameter space for the TNSA- and RPA-dominant hybrid regimes, for plastic. Scaling of the maximum for which RIT occurs (dotted) and optimum for which RIT occurs near the peak of the pulse (dashed) with IL, for pulse durations τL = 900 fs (red) and τL = 40 fs (blue). The red point corresponds to opt in the experiment. The blue points labelled B, C and D correspond to example cases discussed in the main text. b Proton energy spectra for four example target thicknesses, from 2D PIC simulations for 40 fs and 1022 W cm−2 laser pulses. c Laser-to-proton energy conversion efficiency as a function of (for the same laser pulse parameters). The total efficiency is shown (black), as well as the fraction in each of four energy bands: 10–50 MeV (blue); 50–150 MeV (green); 150–250 MeV (red); and >250 MeV (cyan). d Maximum proton energy as a function of the ratio of the intensity on the pulse rising edge, IRE, at an example time of 0.6 ps, to the peak laser intensity, I0. This is simulated by the addition of a wide, low intensity, pre-pulse, as illustrated in the inset, for the two example foil thickness cases C and D

References

    1. Daido H, Nishiuchi M, Pirozhkov AS. Review of laser-driven ion sources and their applications. Rep. Prog. Phys. 2012;75:056401. doi: 10.1088/0034-4885/75/5/056401. - DOI - PubMed
    1. Macchi A, Borghesi M, Passoni M. Ion acceleration by superintense laser-plasma interaction. Rev. Mod. Phys. 2013;85:751–793. doi: 10.1103/RevModPhys.85.751. - DOI
    1. Mackinnon AJ, et al. Proton radiography of a laser-driven implosion. Phys. Rev. Lett. 2006;97:045001. doi: 10.1103/PhysRevLett.97.045001. - DOI - PubMed
    1. Borghesi M, et al. Electric field detection in laser-plasma interaction experiments via the proton imaging technique. Phys. Plasmas. 2002;9:2214–2220. doi: 10.1063/1.1459457. - DOI
    1. Patel PK, et al. Isochoric heating of solid-density matter with an ultrafast proton beam. Phys. Rev. Lett. 2003;91:125004. doi: 10.1103/PhysRevLett.91.125004. - DOI - PubMed

Publication types

LinkOut - more resources