. 2018 Jun;12(7):1694-1705.
doi: 10.1038/s41396-018-0075-3. Epub 2018 Feb 20.

Specialized plant biochemistry drives gene clustering in fungi

Affiliations

Specialized plant biochemistry drives gene clustering in fungi

Emile Gluck-Thaler et al. ISME J. 2018 Jun.

Abstract

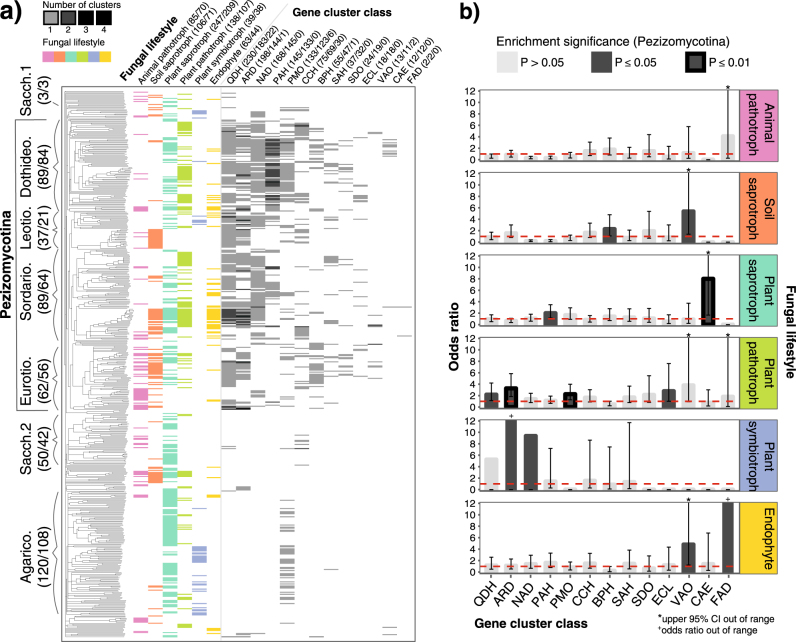
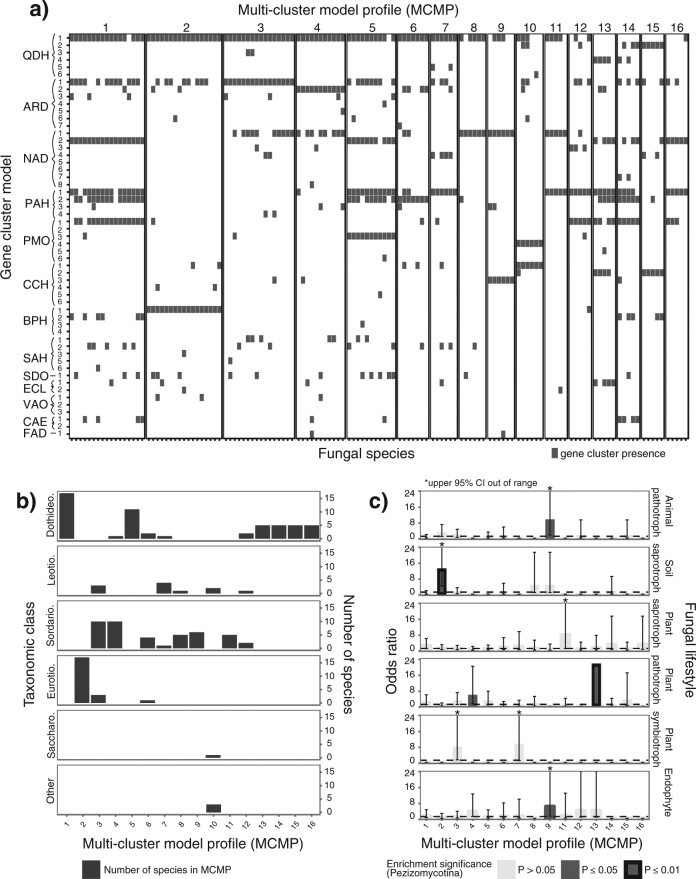
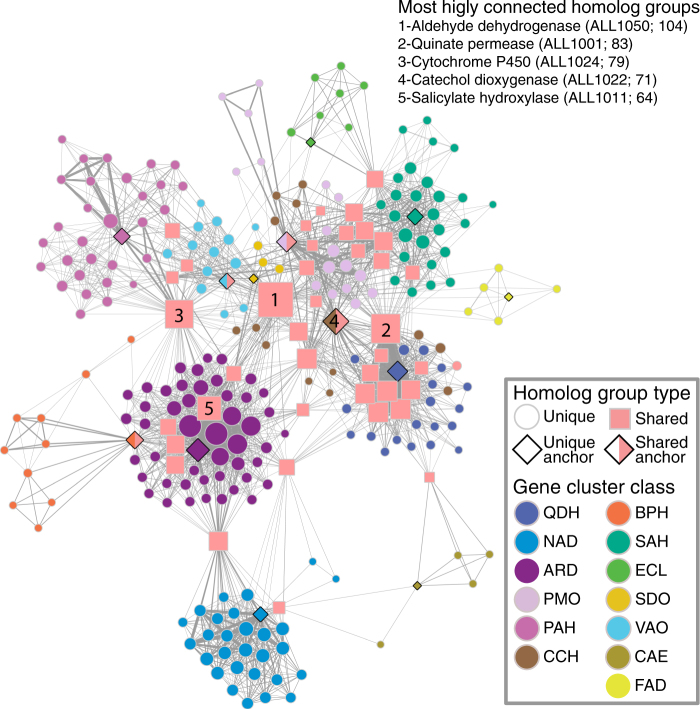
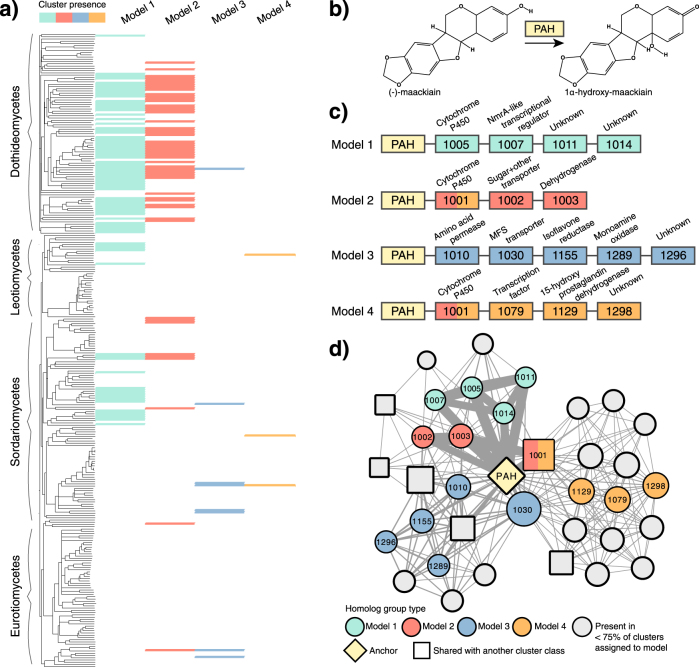
The fitness and evolution of prokaryotes and eukaryotes are affected by the organization of their genomes. In particular, the physical clustering of genes can coordinate gene expression and can prevent the breakup of co-adapted alleles. Although clustering may thus result from selection for phenotype optimization and persistence, the impact of environmental selection pressures on eukaryotic genome organization has rarely been systematically explored. Here, we investigated the organization of fungal genes involved in the degradation of phenylpropanoids, a class of plant-produced secondary metabolites that mediate many ecological interactions between plants and fungi. Using a novel gene cluster detection method, we identified 1110 gene clusters and many conserved combinations of clusters in a diverse set of fungi. We demonstrate that congruence in genome organization over small spatial scales is often associated with similarities in ecological lifestyle. Additionally, we find that while clusters are often structured as independent modules with little overlap in content, certain gene families merge multiple modules into a common network, suggesting they are important components of phenylpropanoid degradation strategies. Together, our results suggest that phenylpropanoids have repeatedly selected for gene clustering in fungi, and highlight the interplay between genome organization and ecological evolution in this ancient eukaryotic lineage.


Conflict of interest statement

The authors declare that they have no conflict of interest.

Figures

Fig. 1
Fig. 1
Associations between gene cluster distributions and fungal lifestyle. a A phylogeny of 529 fungi (representing 454 species) based on pairwise microsyntenic similarity is shown to the left, annotated by taxonomic class. All taxonomic classes have been abbreviated by removing “-mycetes” suffixes. A matrix indicating the ecological lifestyle(s) associated with each fungus is shown to the immediate right of the phylogeny, followed by a heatmap indicating the number of candidate phenylpropanoid-degrading gene clusters in each genome, for each cluster class. Numbers in brackets following the taxonomic class and ecological lifestyle headers correspond to the number of genomes and species within those categories. Numbers in brackets following cluster class headers indicate the total number of clusters assigned to that class, the number of species with at least one cluster, and the number of clusters that overlap with clusters from another cluster class. b Odds ratios representing the strength of the association between cluster presence and fungal ecological lifestyle are shown for each of 13 gene cluster classes and 6 lifestyles, using data at the species level from the Pezizomycotina. Dotted red lines indicate an odds ratio of 1. Dark gray bars indicate enrichment below a significance level of 0.05, whereas black outlines indicate enrichment below a significance level of 0.01. Error bars indicate the 95% confidence interval (CI) for each odds ratio measurement. CIs of 0 are not shown. The color-coding of ecological lifestyle is consistent across the entire figure.
Fig. 2
Fig. 2
Combinations of candidate phenylpropanoid-degrading gene clusters in fungal genomes. a A matrix describes the presence/absence of various homologous clusters (as determined by cluster model; rows) in the genomes of 133 fungal species (columns). Species are grouped into 16 multi-cluster model profiles (MCMPs) based on similarities in the combinations of clusters found in their genomes. b A bar chart depicts the number of fungal species from each MCMP per taxonomic class. c Odds ratios representing the strength of the association between MCMP and fungal ecological lifestyle are shown, using data at the species level from the Pezizomycotina. Dotted black lines indicate an odds ratio of 1. Dark gray bars indicate enrichment below a significance level of 0.05, whereas black outlines indicate enrichment below a significance level of 0.01. Error bars indicate the 95% confidence interval (CI) for each odds ratio measurement. CIs of 0 are not shown. Enrichment data are not shown for MCMP 10, as fewer than five fungi from the Pezizomycotina are assigned to this MCMP.
Fig. 3
Fig. 3
Co-occurrence network of homolog groups in candidate phenylpropanoid-degrading gene clusters. Each node represents a homolog group found in a candidate phenylpropanoid-degrading gene cluster. All nodes are color-coded by the cluster class in which they are found, except for those homolog groups found associated with multiple cluster classes (i.e., “shared”), colored pink and shaped as squares. Nodes representing anchor gene families used to retrieve the clusters are shaped as diamonds, and those anchor gene families that are shared across multiple cluster classes are additionally colored pink. Edges symbolize the co-occurrence of two homolog groups in the same gene cluster, whereas edge width is proportional to the frequency of that occurrence. Node size is proportional to the number of connections emanating from that node. The proximity of nodes to one another is proportional to the number of shared connections. The annotations, followed by the code names and number of unique connections in parentheses, of nodes with the greatest number of connections (i.e., associated with the greatest diversity of homolog groups) are indicated in the top right-hand corner of the network.
Fig. 4
Fig. 4
The distribution of pterocarpan hydroxylase (PAH) clusters in fungi. a A phylogeny of the Pezizomycotina based on pairwise microsyntenic distance is shown to the left, annotated by taxonomic class. The presence/absence of clusters assigned to the four PAH cluster models is indicated in the matrix to the right of the phylogeny, color-coded by cluster model. b A simplified schematic of one of several reactions catalyzed by PAH. c Homolog groups present in ≥75% of clusters assigned to a given cluster model are depicted as boxes color-coded by cluster model, whereas PAH homologs are indicated in yellow. The four-digit code and predicted annotation are indicated for each homolog group. d The depicted network follows the conventions specified in Fig. 2. Homolog groups present in ≥75% of clusters assigned to a given cluster model are color-coded by cluster model and inscribed with their code, whereas others are colored gray. Nodes representing homolog groups present in clusters from other cluster classes are drawn as squares.

References

    1. Baquero F. From pieces to patterns: evolutionary engineering in bacterial pathogens. Nat Rev Microbiol. 2004;2:510–8. - PubMed
    1. Al-Shahrour F, Minguez P, Marqués-Bonet T, Gazave E, Navarro A, Dopazo J. Selection upon genome architecture: conservation of functional neighborhoods with changing genes. PLoS Comput Biol. 2010;6:e1000953. - PMC - PubMed
    1. Hurst LD, Williams EJ, Pal C. Natural selection promotes the conservation of linkage of co-expressed genes. Trends Genet. 2002;18:604–6. - PubMed
    1. McGary KL, Slot JC, Rokas A. Physical linkage of metabolic genes in fungi is an adaptation against the accumulation of toxic intermediate compounds. Proc Natl Acad Sci USA. 2013;110:11481–6. - PMC - PubMed
    1. Holliday JA, Zhou L, Bawa R, Zhang M, Oubida RW. Evidence for extensive parallelism but divergent genomic architecture of adaptation along altitudinal and latitudinal gradients in Populus trichocarpa. New Phytol. 2016;209:1240–51. - PubMed

Publication types

LinkOut - more resources