

doi: 10.1257/jep.31.4.23.
Selection in Health Insurance Markets and Its Policy Remedies
Affiliations
- PMID: 29465215
- PMCID: PMC10898225
- DOI: 10.1257/jep.31.4.23
Item in Clipboard
Selection in Health Insurance Markets and Its Policy Remedies
J Econ Perspect.
2017.
No abstract available
Figures
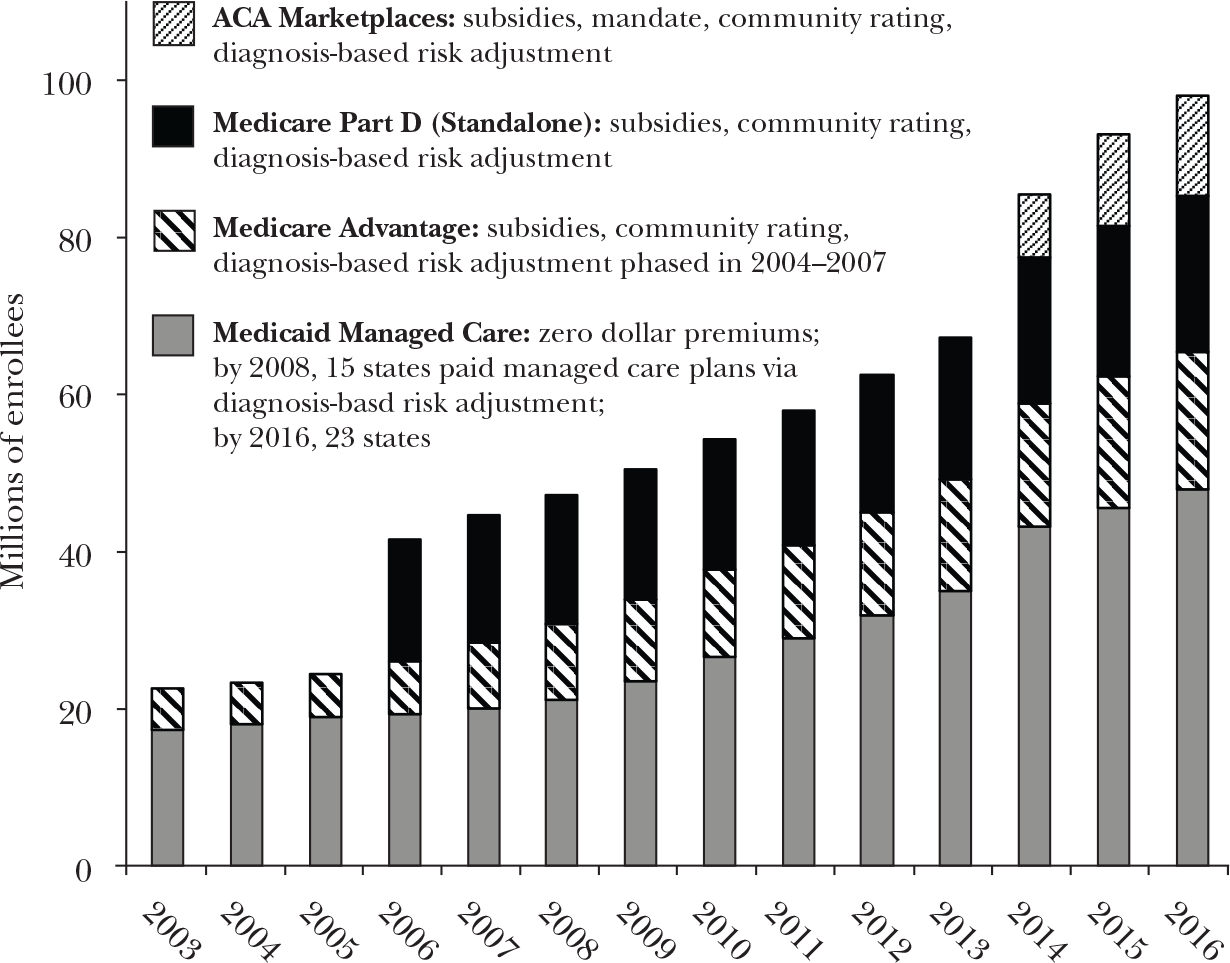
Note: ACA is the Affordable Care Act.
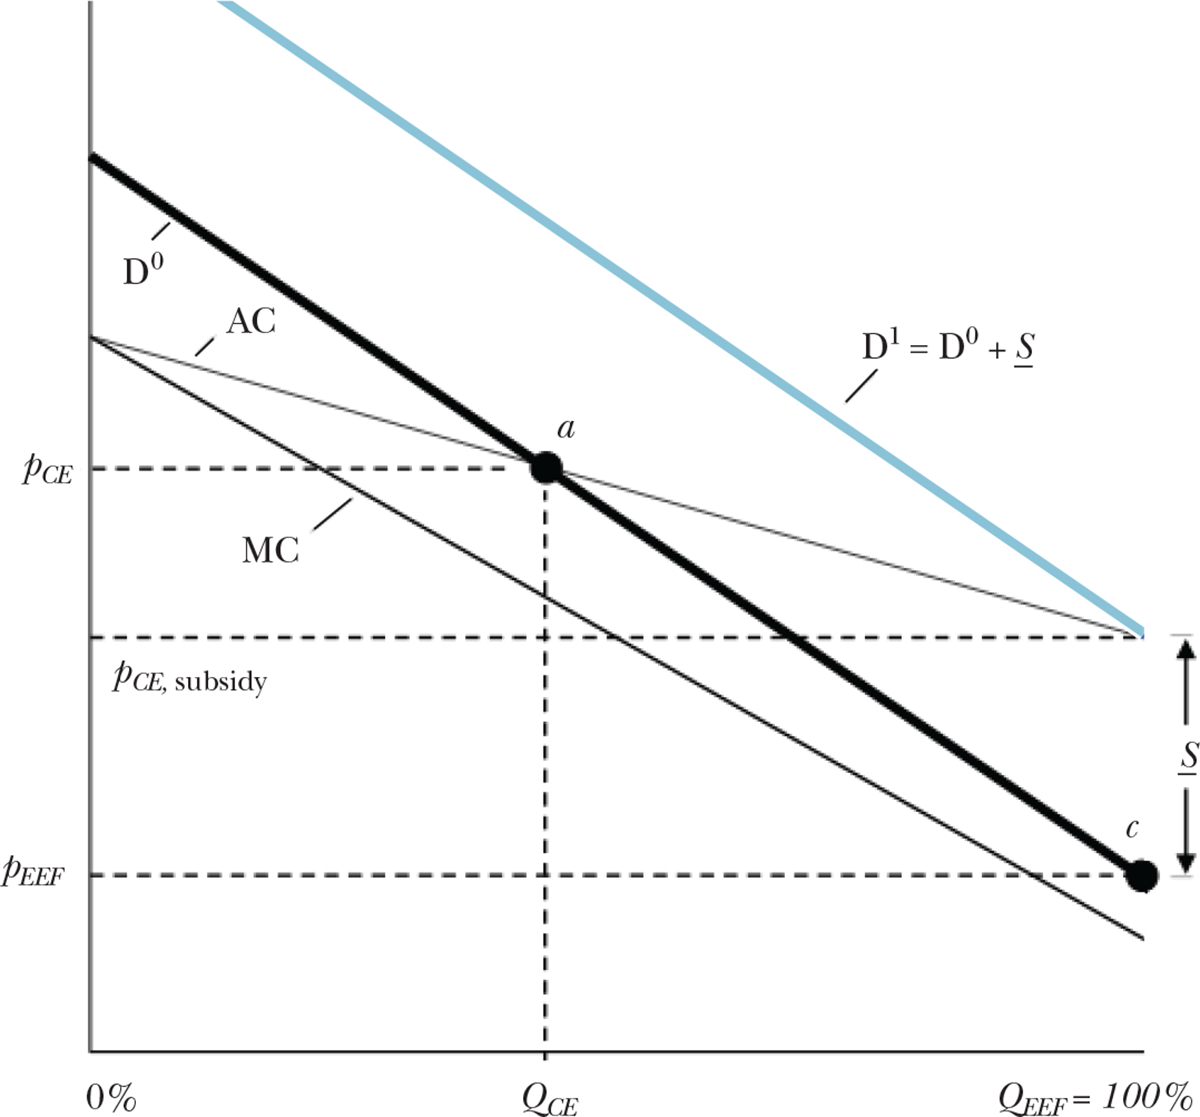
Notes: We follow the basic setup of Einav and Finkelstein (2011), and examine the margin of consumers choosing between taking up insurance and remaining uninsured. The horizontal axis is scaled from 0 to 100 percent enrollment. The vertical axis measures prices or costs in dollar terms. The demand curve D0 reflects the willingness-to-pay for insurance of the marginal consumer at each level of enrollment. The marginal costs of enrollees slope downward, because adverse selection implies the highest willingness-to-pay consumers are those who generate the highest costs to insure. Following the standard model, the competitive equilibrium QCE is determined by point a, the intersection of average costs and demand, where insurers earn zero profits. The efficient outcome is at point c, full enrollment, because in this example the demand curve is everywhere above the marginal cost curve. A uniform subsidy, S , equal to the difference between the rightmost point of the average cost curve and the rightmost point of the demand curve is the minimum uniform subsidy that will induce efficient sorting in this setting. If instead of a subsidy, a penalty were applied to the outside option of remaining uninsured, then S would define the minimum uniform penalty.
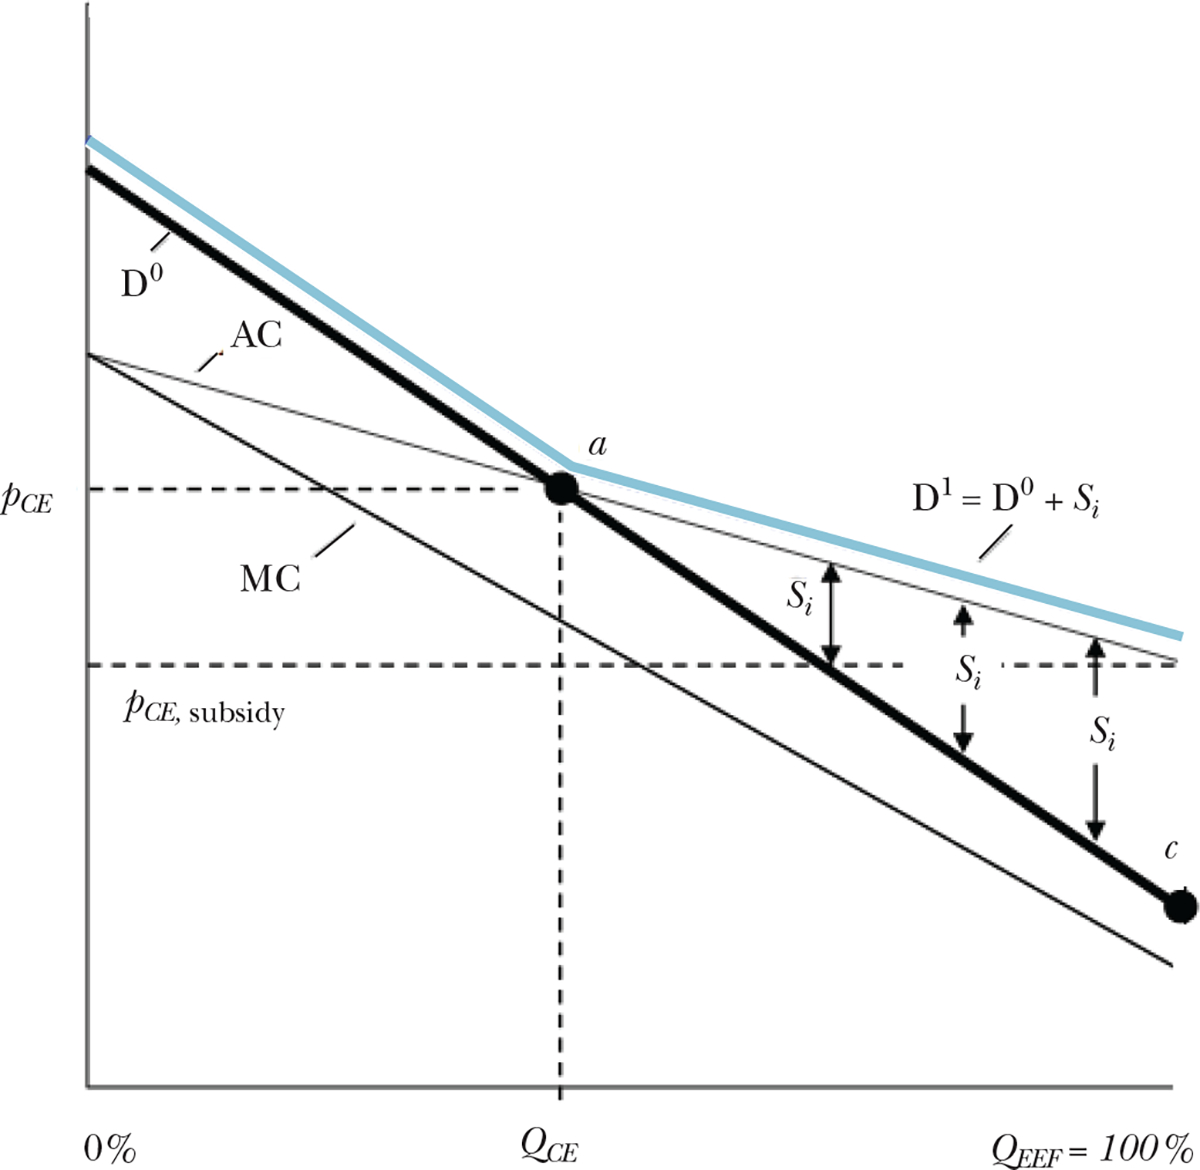
Note: Here we consider a policy of paying person-specific subsidies Si for the set of consumers to the right of point a. For these consumers, the subsidy would be pivotal in their take-up decision. This subsidy schedule would generate the effective demand curve D1, which adds the variable subsidy to the original demand curve, D0. This tailored subsidy scheme would achieve the same universal coverage as the uniform subsidy S from Figure 2, but cost less.
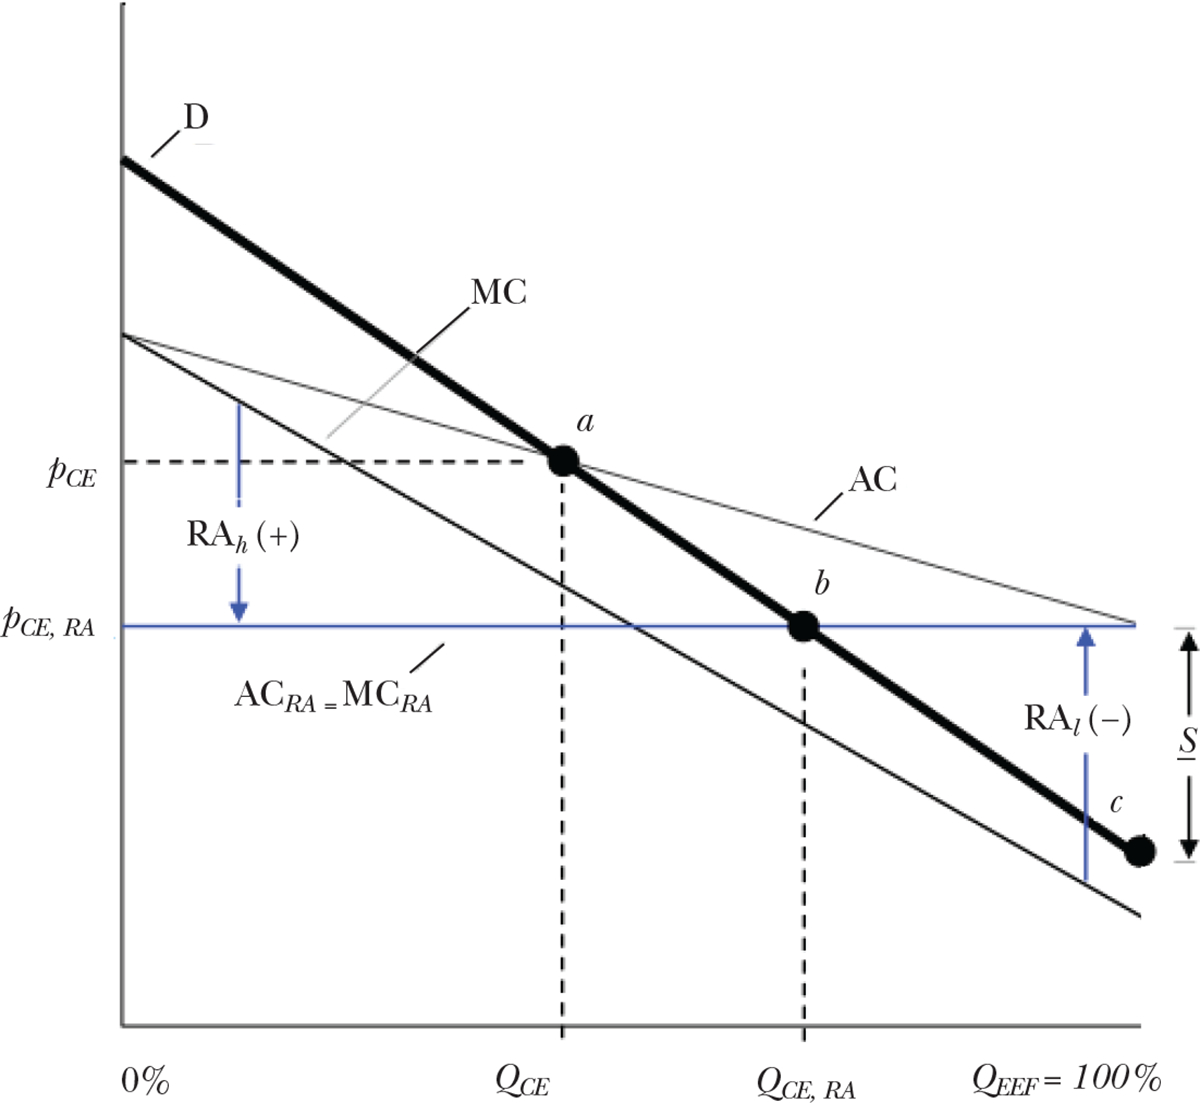
Notes: Larger positive risk adjustment payments, like RAh, are made by the regulators for individuals with larger expected costs, and smaller or negative payments like RAl, for enrollees with lower costs. Given the (arbitrary) demand and cost curves drawn in the diagram, the competitive equilibrium under risk adjustment is determined by point b. Enrollment with risk adjustment, QCE, RA, is higher than the unregulated case, and closer to the optimum. However, risk adjustment does not completely resolve the inefficiency by raising the enrollment rate to 100 percent, at least not without an additional subsidy.
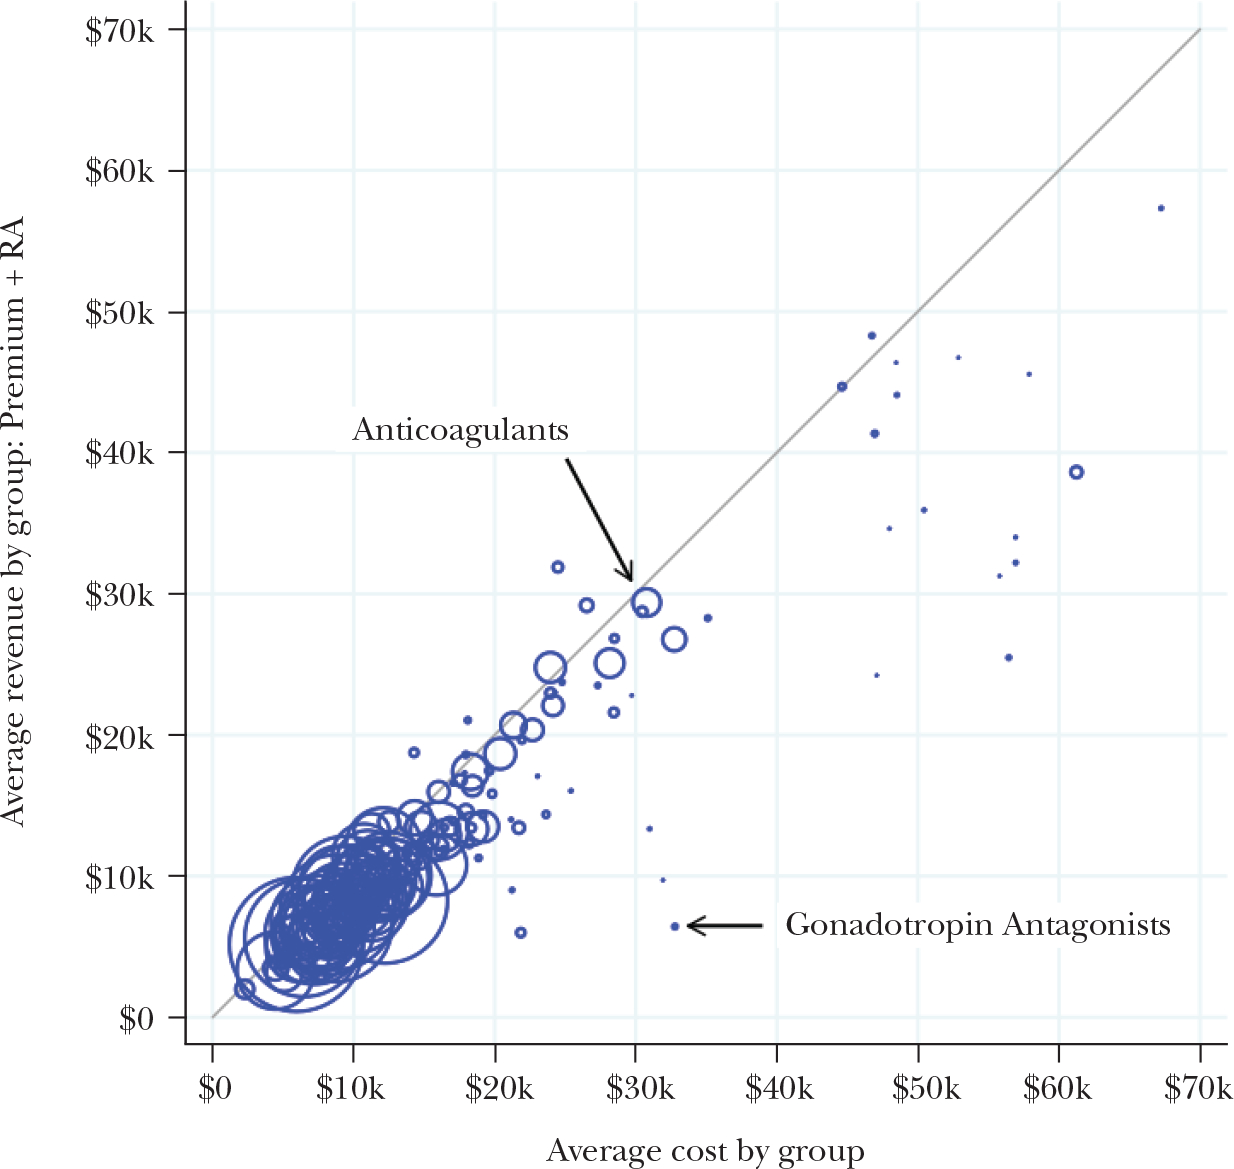
Note: We classify individuals according to whether they have a pharmacy claim for a drug within one of 220 standard therapeutic classes of medications. Each circle in the figure corresponds to a therapeutic class, grouping together all consumers who used a drug in the class. Marker sizes are proportional to the numbers of consumers associated with each class. The horizontal axis measures mean total spending among consumers utilizing a drug in the class, and the vertical axis measures the mean simulated revenue (actuarially fair premiums plus risk adjustment transfers) among those same consumers. Consumers associated with classes below the 45-degree line are profitable to avoid because, for these consumers, insurer costs exceed Marketplace premium plus risk adjustment revenue in expectation. The majority of drug classes are clustered tightly around the 45-degree line, showing that the payment system succeeds in neutralizing selection incentives for the majority of potential enrollees. However there are a number of significant outliers, such as the gonadotropin class of drugs (for infertility in women).
References
-
- Aizawa Naoki, and Kim You Suk. 2015. “Advertising and Risk Selection in Health Insurance Markets.” Board of Governors of the Federal Reserve System (US) Finance and Economics Discussion Series 2015–101.
-
- Andersen Martin. Forthcoming. “Constraints on Formulary Design under the Affordable Care Act.” Health Economics. - PubMed
-
- Andrews Michelle. 2015. “New Health Plans Offer Discounts for Diabetes Care.” Kaiser Health News, November 17. http://khn.org/news/new-health-plans-offer-discounts-for-diabetes-care.
-
- ▶Azevedo Eduardo, and Gottlieb Daniel. 2017. “Perfect Competition in Markets with Adverse Selection.” Econometrica 85(1): 67–105.
-
- Bauman Noam, Bello Jason, Coe Erica, and Lamb Jessica. 2015. “Hospital Networks: Evolution of the Configurations on the 2015 Exchanges.” McKinsey & Company, April. http://healthcare.mckinsey.com/2015-hospital-networks.
This article has been cited by:
-
- Evans David B., Mataria Awad, Kurowski Christoph, Schmidt Martin. Financing Health Care 67–82.
-
- Gruber Jonathan. 2022. Financing Health Care Delivery. Annual Review of Financial Economics 14:1, 209–229.
-
- She Zhaowei, Ayer Turgay, Montanera Daniel. 2022. Can Big Data Cure Risk Selection in Healthcare Capitation Program? A Game Theoretical Analysis. Manufacturing & Service Operations Management 24:6, 3117–3134.
-
- Ernest J. Barthélemy, Affana Clémentine K., Asfaw Zerubabbel K., Dams-O’Connor Kristen, Rahman Jueria, Jones Salazar, Ullman Jamie, Margetis Konstantinos, Hickman Zachary L., Dangayach Neha S., Giwa Al O.. 2022. Racial and Socioeconomic Disparities in Neurotrauma: Research Priorities in the New York Metropolitan Area Through a Global Neurosurgery Paradigm. World Neurosurgery 165, 51–57. - PubMed
MeSH terms
Grants and funding
LinkOut - more resources
Full Text Sources
Medical