

Chlamydia Prevalence Trends Among Women and Men Entering the National Job Training Program From 1990 Through 2012
- PMID: 29465650
- PMCID: PMC6043365
- DOI: 10.1097/OLQ.0000000000000798
Chlamydia Prevalence Trends Among Women and Men Entering the National Job Training Program From 1990 Through 2012
Abstract
Background: Evaluating chlamydia prevalence trends from sentinel surveillance is important for understanding population disease burden over time. However, prevalence trend estimates from surveillance data may be misleading if they do not account for changes in risk profiles of individuals who are screened (case mix) and changing performance of the screening tests used.
Methods: We analyzed chlamydia screening data from a sentinel surveillance population of 389,555 young women (1990-2012) and 303,699 young men (2003-2012) entering the US National Job Training Program. This period follows the introduction of national chlamydia screening programs designed to prevent transmission and reduce population disease burden. After ruling out bias due to case mix, we used an expectation-maximization-based maximum likelihood approach to account for measurement error from changing screening tests, and generated minimally biased long-term chlamydia prevalence trend estimates among youth and young adults in this sentinel surveillance population.
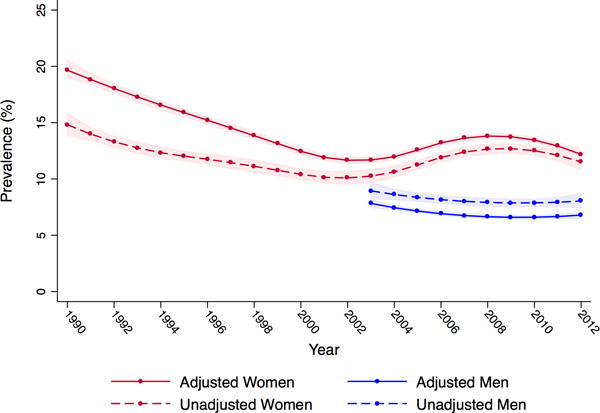
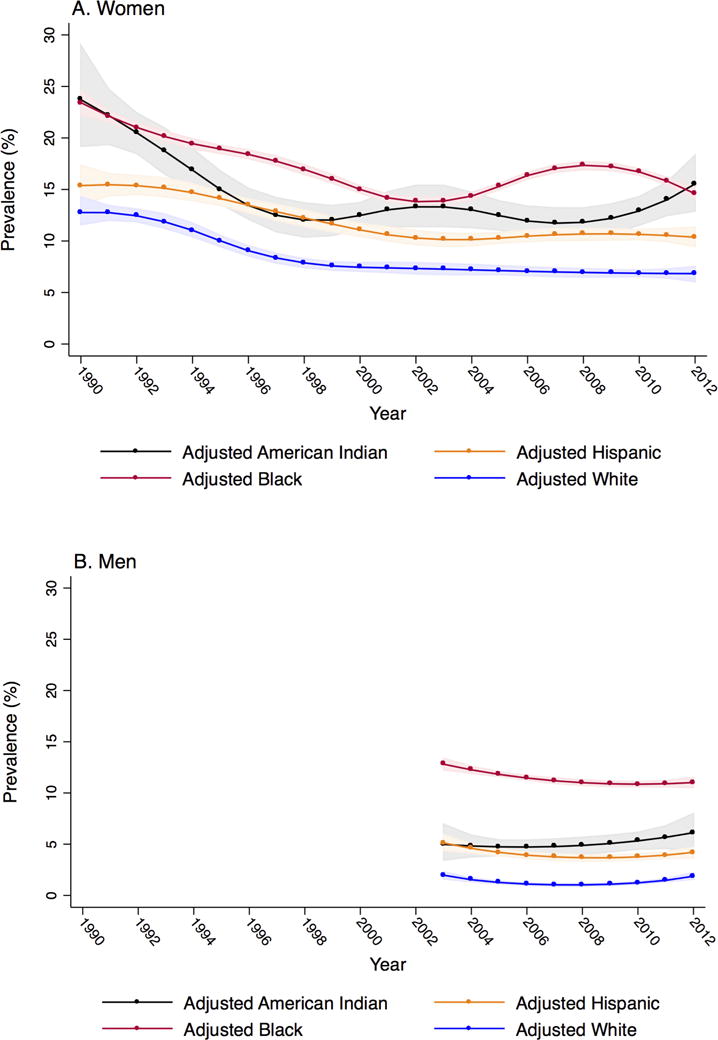
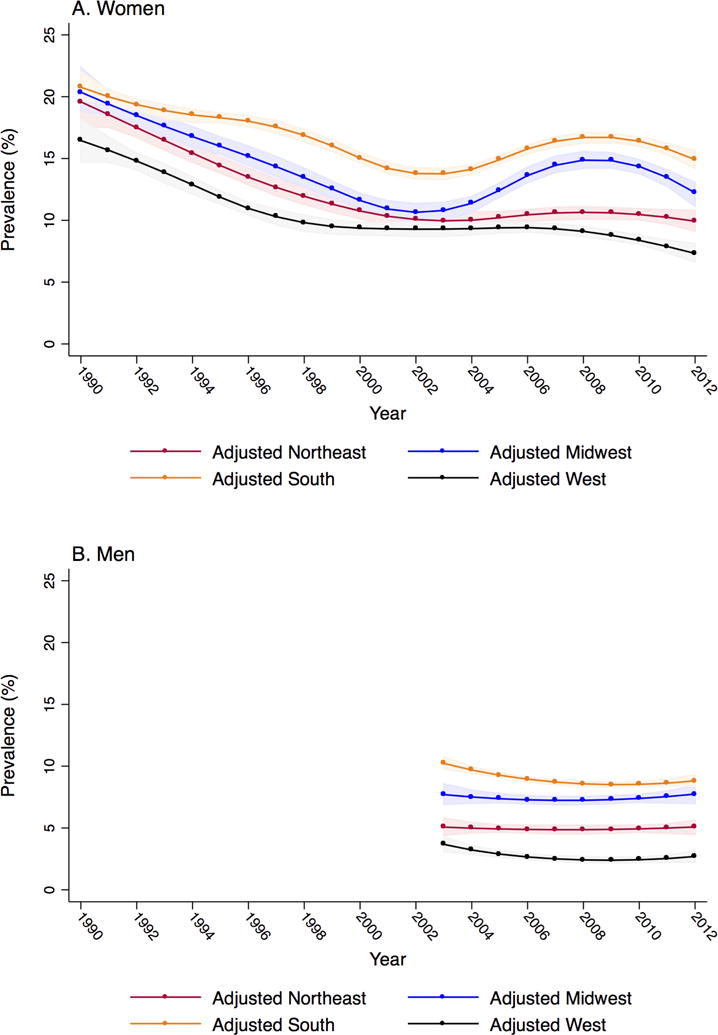
Results: Adjusted chlamydia prevalence among women was high throughout the study period, but fell from 20% in 1990 to 12% in 2003, and remained between 12% and 14% through 2012. Adjusted prevalence among men was steady throughout the study period at approximately 7%. For both women and men, adjusted prevalence was highest among Black and American Indian youth and young adults, and in the Southern and Midwestern regions of the United States throughout the study period.
Conclusions: Our minimally biased trend estimates provide support for an initial decrease in chlamydia prevalence among women soon after the introduction of national chlamydia screening programs. Constant chlamydia prevalence in more recent years suggests that screening may not be sufficient to further reduce chlamydia prevalence among high-risk youth and young adults.
Conflict of interest statement
Figures
Comment in
-
Chlamydia Screening, Population Prevalence, and the Principles of Screening for Disease.Sex Transm Dis. 2018 Aug;45(8):560-562. doi: 10.1097/OLQ.0000000000000862. Sex Transm Dis. 2018. PMID: 29771867 No abstract available.
Similar articles
-
Why Are Rates of Reported Chlamydia Changing in the United States? Insights From the National Job Training Program.Sex Transm Dis. 2021 Mar 1;48(3):152-160. doi: 10.1097/OLQ.0000000000001284. Sex Transm Dis. 2021. PMID: 32910033 Free PMC article.
-
Chlamydia prevalence among women and men entering the National Job Training Program: United States, 2003-2007.Sex Transm Dis. 2010 Feb;37(2):63-7. doi: 10.1097/OLQ.0b013e3181bc097a. Sex Transm Dis. 2010. PMID: 19801962
-
The Influence of Screening, Misclassification, and Reporting Biases on Reported Chlamydia Case Rates Among Young Women in the United States, 2000 Through 2017.Sex Transm Dis. 2020 Jun;47(6):369-375. doi: 10.1097/OLQ.0000000000001157. Sex Transm Dis. 2020. PMID: 32149958 Free PMC article.
-
Screening for sexually transmitted diseases in short-term correctional institutions: summary of evidence reviewed for the 2010 Centers for Disease Control and Prevention Sexually Transmitted Diseases Treatment Guidelines.Sex Transm Dis. 2013 Sep;40(9):679-84. doi: 10.1097/01.olq.0000431353.88464.ab. Sex Transm Dis. 2013. PMID: 23945422 Review.
-
Chlamydia trachomatis positivity rates among men tested in selected venues in the United States: a review of the recent literature.Sex Transm Dis. 2008 Nov;35(11 Suppl):S8-S18. doi: 10.1097/OLQ.0b013e31816938ba. Sex Transm Dis. 2008. PMID: 18449072 Review.
Cited by
-
Estimated costs and quality-adjusted life-years lost due to N. gonorrhoeae infections acquired in 2015 in the United States: A modelling study of overall burden and disparities by age, race/ethnicity, and other factors.Lancet Reg Health Am. 2022 Sep 5;16:100364. doi: 10.1016/j.lana.2022.100364. eCollection 2022 Dec. Lancet Reg Health Am. 2022. PMID: 36777156 Free PMC article.
-
Gonorrhea Prevalence Among Young Women and Men Entering the National Job Training Program, 2000-2017.Am J Public Health. 2020 May;110(5):710-717. doi: 10.2105/AJPH.2019.305559. Epub 2020 Mar 19. Am J Public Health. 2020. PMID: 32191513 Free PMC article.
-
Potential for Point-of-Care Tests to Reduce Chlamydia-associated Burden in the United States: A Mathematical Modeling Analysis.Clin Infect Dis. 2020 Apr 15;70(9):1816-1823. doi: 10.1093/cid/ciz519. Clin Infect Dis. 2020. PMID: 31504314 Free PMC article.
-
High Rates of Repeat Chlamydial Infections Among Young Women-Louisiana, 2000-2015.Sex Transm Dis. 2019 Jan;46(1):52-57. doi: 10.1097/OLQ.0000000000000906. Sex Transm Dis. 2019. PMID: 30148756 Free PMC article.
References
-
- Centers for Disease Control and Prevention. Recommendations for the prevention and management of Chlamydia trachomatis infections. MMWR. 1993;42(RR-12) - PubMed
-
- Centers for Disease Control and Prevention. Infertility Prevention Project. 2013 ( http://www.cdc.gov/std/infertility/ipp-archive.htm). (Accessed December 10, 2015)
-
- Miller WC. Epidemiology of chlamydial infection: are we losing ground? Sex Transm Infect. 2008;84(2):82–86. - PubMed
-
- Miller WC. Screening for chlamydial infection: are we doing enough? Lancet. 2005;365(9458):456–458. - PubMed
-
- Centers for Disease Control and Prevention. Sexually Transmitted Disease Surveillance 2016. Atlanta: US Department of Health and Human Services; 2017.
Publication types
MeSH terms
Grants and funding
LinkOut - more resources
Full Text Sources
Other Literature Sources
Medical
