. 2018 Apr;47(7):887-900.
doi: 10.1111/ejn.13875. Epub 2018 Mar 25.

Subpopulations of vomeronasal sensory neurons with coordinated coexpression of type 2 vomeronasal receptor genes are differentially dependent on Vmn2r1

Affiliations

Subpopulations of vomeronasal sensory neurons with coordinated coexpression of type 2 vomeronasal receptor genes are differentially dependent on Vmn2r1

Sachiko Akiyoshi et al. Eur J Neurosci. 2018 Apr.

Abstract

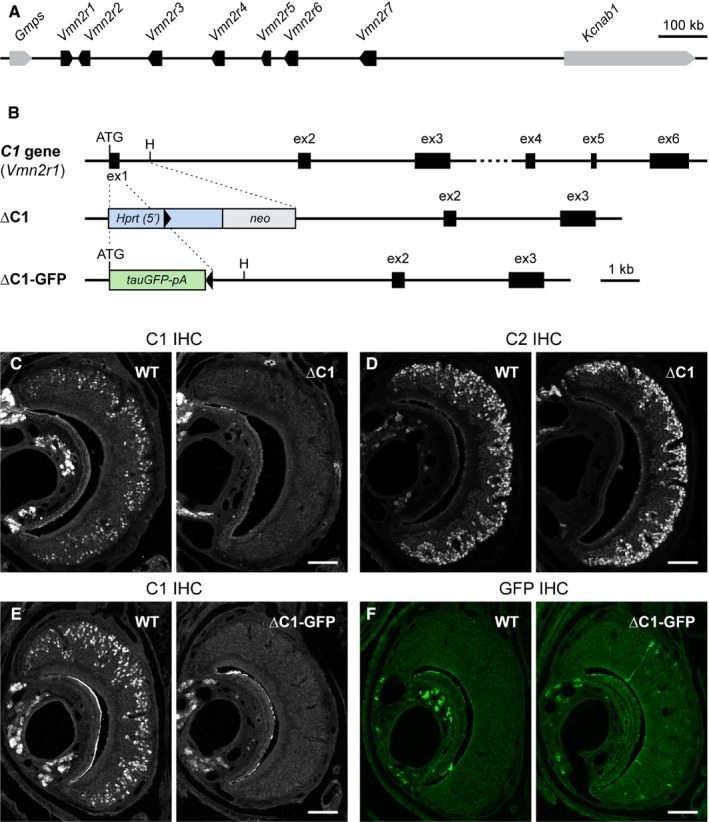
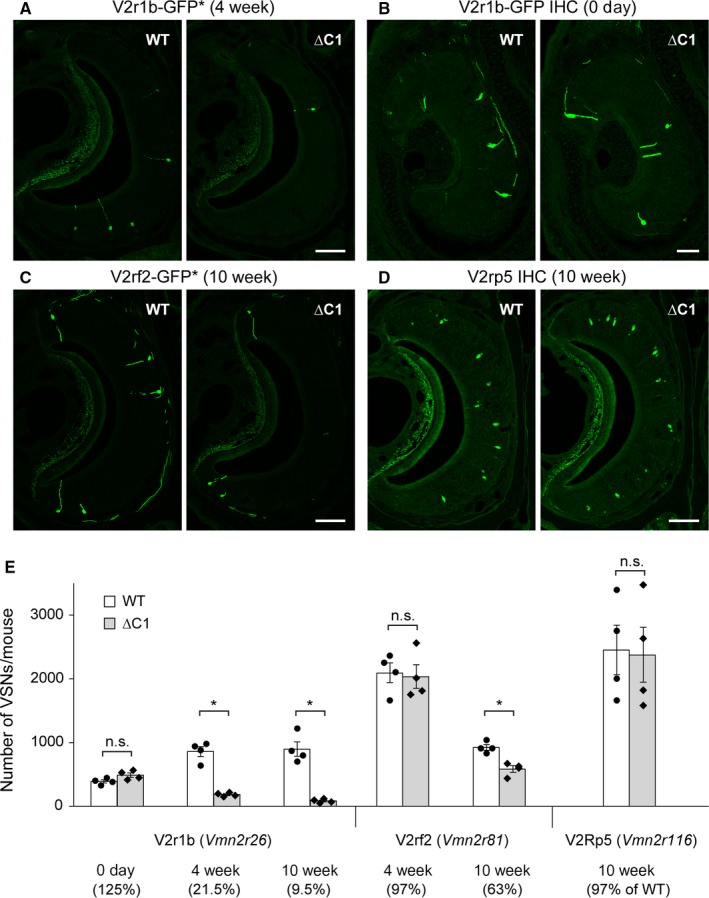
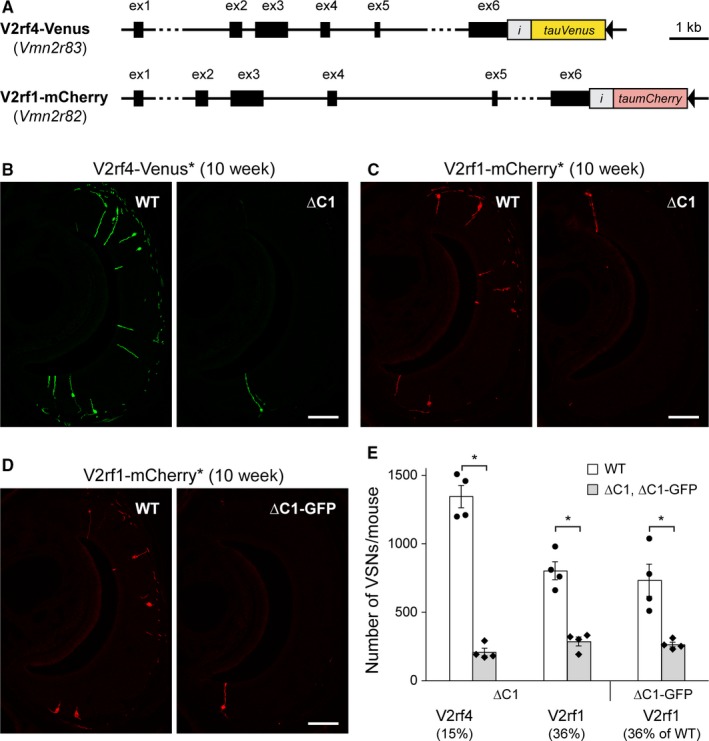
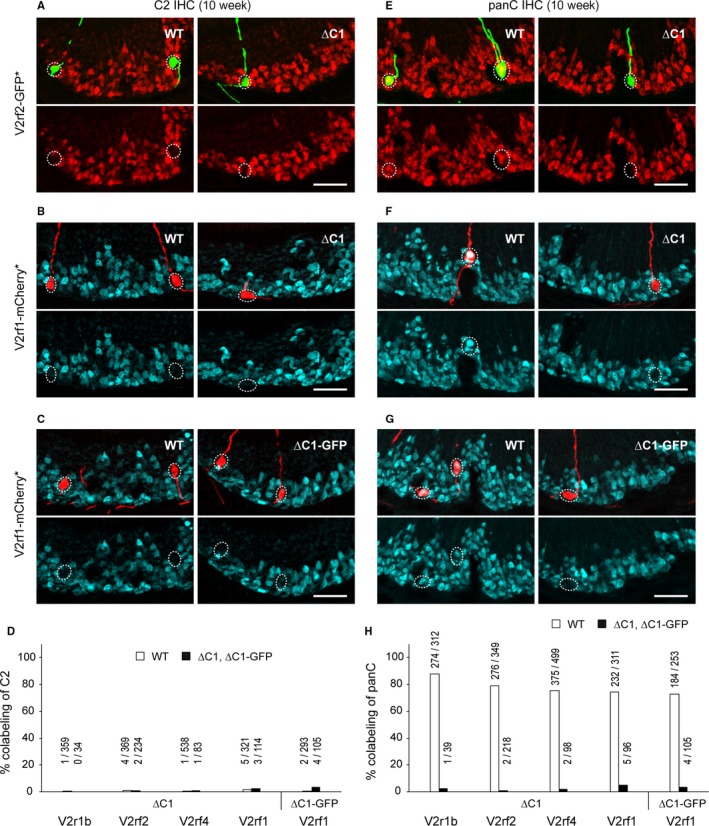
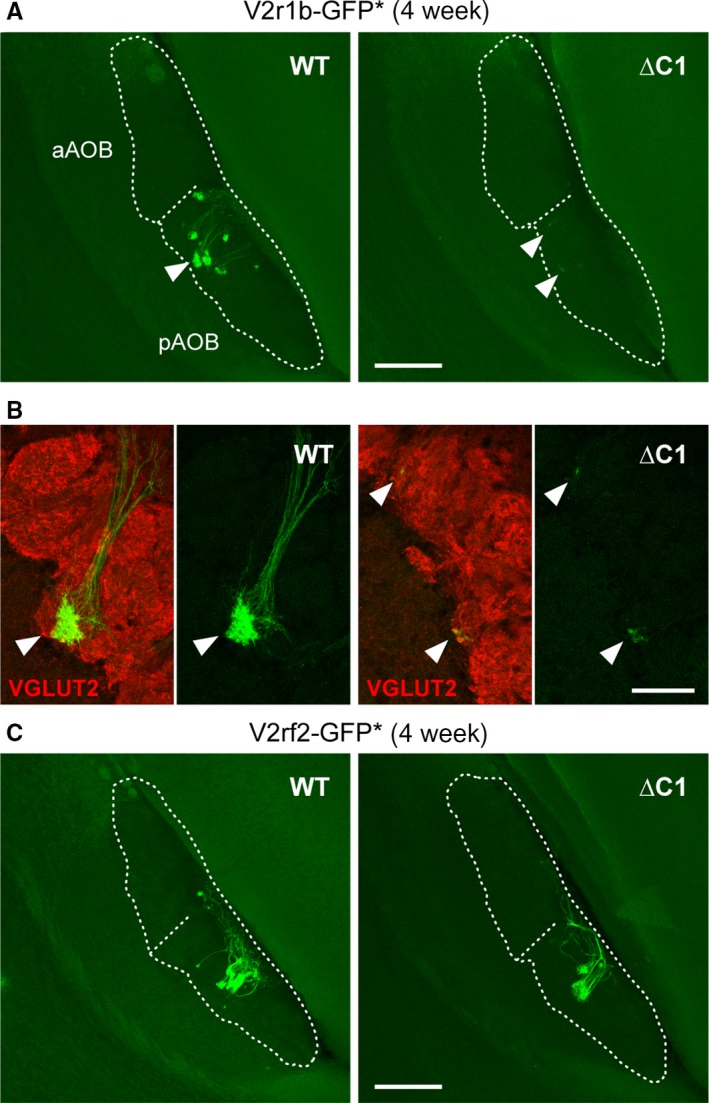
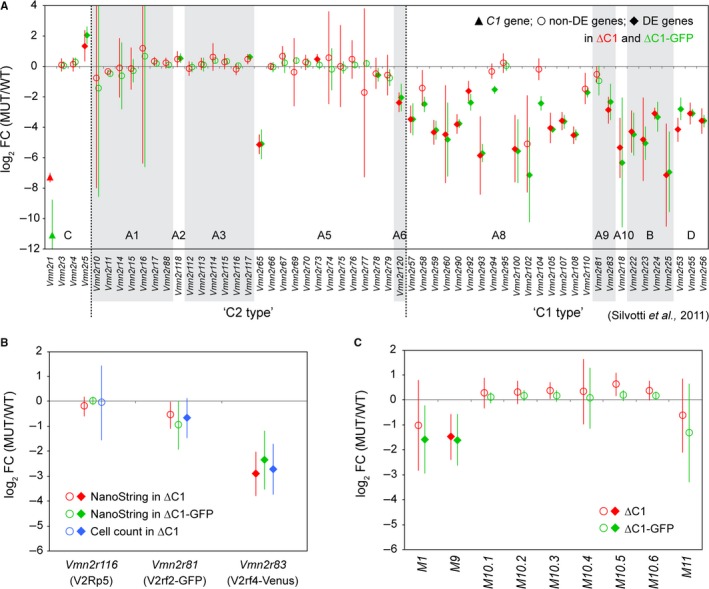
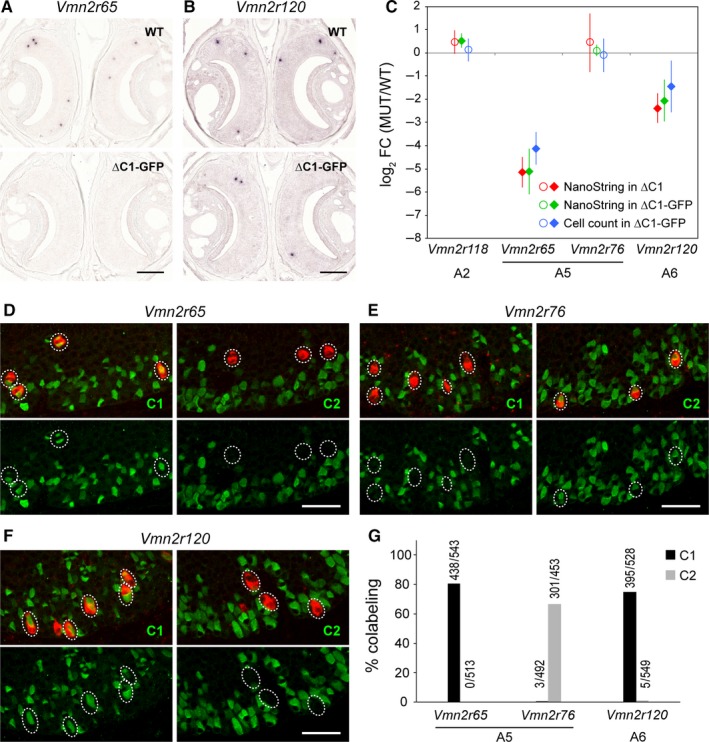
The mouse vomeronasal organ is specialized in the detection of pheromones. Vomeronasal sensory neurons (VSNs) express chemosensory receptors of two large gene repertoires, V1R and V2R, which encode G-protein-coupled receptors. Phylogenetically, four families of V2R genes can be discerned as follows: A, B, C, and D. VSNs located in the basal layer of the vomeronasal epithelium coordinately coexpress V2R genes from two families: Approximately half of basal VSNs coexpress Vmn2r1 of family C with a single V2R gene of family A8-10, B, or D ('C1 type of V2Rs'), and the other half coexpress Vmn2r2 through Vmn2r7 of family C with a single V2R gene of family A1-6 ('C2 type V2Rs'). The regulatory mechanisms of the coordinated coexpression of V2Rs from two families remain poorly understood. Here, we have generated two mouse strains carrying a knockout mutation in Vmn2r1 by gene targeting in embryonic stem cells. These mutations cause a differential decrease in the numbers of VSNs expressing a given C1 type of V2R. There is no compensatory expression of Vmn2r2 through Vmn2r7. VSN axons coalesce into glomeruli in the appropriate region of the accessory olfactory bulb in the absence of Vmn2r1. Gene expression profiling by NanoString reveals a differential and graded decrease in the expression levels across C1 type of V2Rs. There is no change in the expression levels of C2 type of V2Rs, with two exceptions that we reclassified as C1 type. Thus, there appears to be a fixed probability of gene choice for a given C2 type of V2R.

Keywords: V2R; accessory olfactory system; gene expression; gene regulation; pheromone.


Figures

Figure 1
Figure 1
Generation of mouse strains with a knockout mutation in Vmn2r1 by gene targeting in ES cells. (A) Genomic organization of the family‐C V2R genes in mouse. The seven genes Vmn2r1 through Vmn2r7 are clustered in a 640 kb region on chromosome 3. The Vmn2r1 gene is transcribed from the (+) strand, and the other six genes are transcribed from the (−) strand. Gmps and Kcnab1 are the closest genes to the gene cluster, centromerically and telomerically, respectively. (B) Genomic structure and targeted mutagenesis of the family‐C gene Vmn2r1, abbreviated here as C1. This gene is composed of six coding exons. In the ∆C1 strain, a 1065 bp fragment that includes coding exon 1 (ex1) is replaced with a Hprt(5′)‐loxP‐neo cassette. This cassette is left behind in the targeted mutation in the mouse strain. In the ∆C1‐GFP strain, a 230 bp fragment from the initiation ATG codon to the fourth nt before the end of coding exon 1 is replaced in frame with a tauGFPpA cassette, followed by a self‐excising neo selectable marker cassette (ACNF). Following the removal of ACNF, one loxP site is left behind in the targeted mutation in the mouse strain, after tauGFPpA. The black triangles indicate a loxP site. H, HindIII. (C,D) IHC with anti‐C1 antibody (C) and anti‐C2 antibody (D) on coronal sections of the VNO from wild‐type (WT) and homozygous (∆C1) mice of the ∆C1 strain. Mice were male and 10 weeks old. There is no C1 immunoreactivity in ∆C1 mice (C), and no obvious difference in C2 immunoreactivity between WT and ∆C1 mice (D). Scale bar, 100 μm. (E,F) IHC with anti‐C1 antibody (E) and anti‐GFP antibody (F) on coronal sections of the VNO from WT and homozygous (∆C1‐GFP) mice of the ∆C1‐GFP strain. Mice were male and 4 weeks old. There is no C1 immunoreactivity in ∆C1‐GFP mice (E). Sparse GFP+ cells are detected in ∆C1‐GFP mice (F). Scale bar, 100 μm.
Figure 2
Figure 2
Decrease in the number of VSNs expressing V2r1b‐GFP or V2rf2‐GFP but not Vmn2r116 in ∆C1 mice. (A–C) The ∆C1 strain was crossed with the gene‐targeted V2r1b‐GFP and V2rf2‐GFP strains to generate double‐homozygous mice. Intrinsic GFP fluorescence (indicated with an asterisk) of coronal VNO sections is shown in A,C. IHC with anti‐GFP antibody is shown in B. Scale bar, 100 μm in A,C, and 50 μm in B. (D) IHC with anti‐V2Rp5 antibody on coronal VNO sections from WT and ∆C1 mice. Scale bar, 100 μm. (E) Summary of the numbers of labeled VSNs per mouse. Four mice per genotype were analyzed for each cross at the indicated ages. Mice were male, except for 0 day, when both males and females were used. Error bars represent mean ± SEM, with data points superimposed on bar charts. Mann–Whitney test was performed: n.s., not significant; *P value < 0.05.
Figure 3
Figure 3
Decrease in the number of VSNs expressing V2rf4‐Venus or V2rf1‐mCherry in ∆C1 mice. (A) The V2rf4‐Venus and V2rf1‐mCherry gene‐targeted strains have an insertion of IRES‐tauVenus or IRES‐taumCherry after the stop codon of the Vmn2r83 or Vmn2r82 genes, respectively. The coding sequences remain intact. The black triangles indicate a loxP site. i, IRES. (B,C) The ∆C1 strain was crossed with the V2rf4‐Venus and V2rf1‐mCherry strains to generate double‐homozygous mice. Intrinsic fluorescence (indicated with an asterisk) of coronal VNO sections is shown in green (B) or red (C). Scale bar, 100 μm. (D) The ∆C1‐GFP strain was crossed with the V2rf1‐mCherry strain to generate double‐homozygous mice. Intrinsic fluorescence of coronal VNO sections is shown in red. Scale bar, 100 μm. (E) Summary of the numbers of labeled VSNs per mouse. Four 10‐week‐old male mice per genotype were analyzed for each cross. Error bars represent mean ± SEM, with data points superimposed on bar charts. Mann–Whitney test was performed: *P value < 0.05.
Figure 4
Figure 4
No compensatory expression of Vmn2r2 through Vmn2r7 in the absence of Vmn2r1. (A,B) IHC with anti‐C2 antibody on coronal VNO sections of WT and ∆C1 mice from the crosses ∆C1 × V2rf2‐GFP (A) and ∆C1 × V2rf1‐mCherry (B). In (A) intrinsic GFP fluorescence (indicated with an asterisk) is shown in green, and C2 immunoreactivity in red. In (B) intrinsic mCherry fluorescence is shown in red, and C2 immunoreactivity in blue. Mice were male and 10 weeks old. Scale bar, 50 μm. (C) IHC with anti‐C2 antibody (blue) on coronal VNO sections of WT and ∆C1‐GFP mice from the cross ∆C1‐GFP × V2rf1‐mCherry at 10 weeks. Intrinsic mCherry fluorescence is shown in red. Scale bar, 50 μm. (D) Summary of the percentage of colabeling with anti‐C2 antibody in VSNs that express a fluorescence marker from a gene‐targeted locus. Four mice per genotype were analyzed for each cross. Samples were from the 10‐week‐old male mice that were used for VSN counting in Figs 2 and 3. Above each bar, the number of double‐labeled VSNs/number of fluorescence marker‐positive VSNs is given. (E,F) IHC with anti‐panC antibody on coronal VNO sections of WT and ∆C1 mice from the crosses ∆C1 × V2rf2‐GFP (E) and ∆C1 × V2rf1‐mCherry (F) at 10 weeks. In (E) intrinsic GFP fluorescence is shown in green, and panC immunoreactivity in red. In (F) intrinsic mCherry fluorescence is shown in red, and panC immunoreactivity in blue. Scale bar, 50 μm. (G) IHC with anti‐panC antibody (blue) on coronal VNO sections of WT and ∆C1‐GFP mice from the cross ∆C1‐GFP × V2rf1‐mCherry at 10 weeks. Intrinsic mCherry fluorescence is shown in red. Scale bar, 50 μm. (H) Summary of the percentage of colabeling with panC antibody in fluorescence marker‐expressing VSNs. Four 10‐week‐old male mice per genotype were analyzed for each cross.
Figure 5
Figure 5
Axonal projections of subpopulations of VSNs to the AOB. (A) Axonal projections of V2r1b‐GFP+ VSNs to the AOB of WT and ∆C1 mice from the cross ∆C1 × V2r1b‐GFP. Samples were from 4‐week‐old male and female mice. Multiple images of intrinsic GFP fluorescence from serial sagittal sections were z‐stacked and projected into a 2D image. Dashed lines indicate the contours of the nerve layer and the glomerular layer of the AOB, and the border between the anterior AOB (aAOB) and the posterior AOB (pAOB). Arrowheads indicate GFP+ glomeruli (WT) and GFP+ axons (∆C1) that are shown in B. Scale bar, 200 μm. (B) IHC with anti‐VGLUT2 antibody (red) on sagittal AOB sections of WT and ∆C1 mice from the cross ∆C1 × V2r1b‐GFP, combined with intrinsic GFP fluorescence. Arrowheads V2r1b‐GFP+ glomeruli in WT, and GFP+ axons terminating in the VGLUT2+ glomerular layer in ∆C1. Scale bar, 50 μm. (C) Axonal projections of V2rf2‐GFP+ VSNs to the AOB in WT and ∆C1 mice from the cross ∆C1 × V2rf2‐GFP. Samples were from 4‐week‐old female mice. Axons with intrinsic GFP fluorescence form multiple glomeruli of various sizes in the pAOB both in WT and ∆C1 mice. Scale bar, 200 μm.
Figure 6
Figure 6
NanoString multiplex gene expression analysis of total RNA from whole VNO mucosae. (A) Gene expression profiling of V2R genes by NanoString analysis with the custom CodeSet Pao for strains ∆C1 (red) and ∆C1‐GFP (green). Six WT and six homozygous (MUT) mice were analyzed for each strain. Mice were 10‐week‐old males. The log2 values of the fold change (FC) of MUT over WT are plotted. Filled triangles indicate the Vmn2r1/C1 gene: Its NanoString count in MUT mice is near background level. Filled diamonds indicate differentially expressed (DE) genes, with a false discovery rate (FDR) < 0.05. Open circles indicate non‐DE genes. Columns are alternatively gray‐shaded and not shaded per gene family. Expression profiles are very similar between two strains, as shown by similar log2 FC values and overlap of error bars (±99% CI). (B) NanoString results in strains ∆C1 (red) and ∆C1‐GFP (green) are consistent with differences in cell counts in the ∆C1 strain (blue). Filled diamonds indicate DE genes in NanoString analysis or a significant decrease in cell count. Open circles indicate non‐DE genes. Error bars represent log2 FC ±99% CI. (C) Gene expression profiling of H2‐Mv genes by NanoString analysis with CodeSet Pao in strains ∆C1 (red) and ∆C1‐GFP (green). Filled diamonds indicate DE genes. Open circles indicate non‐DE genes. Error bars represent log2 FC ±99% CI. Expression profiles are very similar between the two strains.
Figure 7
Figure 7
Reclassification of Vmn2r65 and Vmn2r120 as C1 type of V2R genes. (A,B) ISH with gene‐specific probes for Vmn2r65 (A) and Vmn2r120 (B) on coronal VNO sections of WT and ∆C1‐GFP mice. Labeled cells were visualized chromogenically. Four 10‐week‐old male mice per genotype were used. Scale bar, 200 μm. (C) Comparison of NanoString counts with ISH cell counts. Filled diamonds indicate DE genes in NanoString analysis or a significant decrease in cell count by ISH. Open circles indicate non‐DE genes. Vmn2r65 and Vmn2r120 were decreased in MUT mice consistently in NanoString and ISH analyses, and to the same extent for each gene: The log2 FC values are close, and there is overlap of the error bars (±99% CI). By contrast, there was no difference in ISH counts using gene‐specific probes for Vmn2r118 and Vmn2r76 genes, consistent with NanoString results. (D–F) Colabeling of Vmn2r65 (D), Vmn2r76 (E), and Vmn2r120 (F) by fluorescence ISH (red) in combination with IHC using anti‐C1 or anti‐C2 antibodies (green) on coronal VNO sections of C57BL/6J mice at 10 weeks. Scale bar, 50 μm. (G) Summary of the combined ISH/IHC analysis. VNO sections from three 10‐week‐old C57BL/6J male mice were analyzed. Above each bar, the number of double‐labeled VSNs/number of VSNs labeled by ISH with a gene‐specific probe is shown. The majority of VSNs expressing Vmn2r65 or Vmn2r120 in ISH were colabeled with C1 antibody, thus reclassifying these genes as C1 type of V2Rs.

References

    1. Belluscio, L. , Koentges, G. , Axel, R. & Dulac, C. (1999) A map of pheromone receptor activation in the mammalian brain. Cell, 97, 209–220. - PubMed
    1. Benjamini, Y. & Yekutieli, D. (2001) The control of the false discovery rate in multiple testing under dependency. Ann. Stat., 29, 1165–1188.
    1. Chamero, P. , Marton, T.F. , Logan, D.W. , Flanagan, K. , Cruz, J.R. , Saghatelian, A. , Cravatt, B.F. & Stowers, L. (2007) Identification of protein pheromones that promote aggressive behaviour. Nature, 450, 899–902. - PubMed
    1. Chamero, P. , Katsoulidou, V. , Hendrix, P. , Bufe, B. , Roberts, R. , Matsunami, H. , Abramowitz, J. , Birnbaumer, L. et al (2011) G protein Gαo is essential for vomeronasal function and aggressive behavior in mice. Proc. Natl. Acad. Sci. USA, 108, 12898–12903. - PMC - PubMed
    1. Chamero, P. , Leinders‐Zufall, T. & Zufall, F. (2012) From genes to social communication: molecular sensing by the vomeronasal organ. Trends Neurosci., 35, 597–606. - PubMed

Publication types

Substances