. 2018 Mar 15;555(7696):328-333.
doi: 10.1038/nature25755. Epub 2018 Jan 22.

The atomic structure of a eukaryotic oligosaccharyltransferase complex

Affiliations

The atomic structure of a eukaryotic oligosaccharyltransferase complex

Lin Bai et al. Nature. .

Abstract

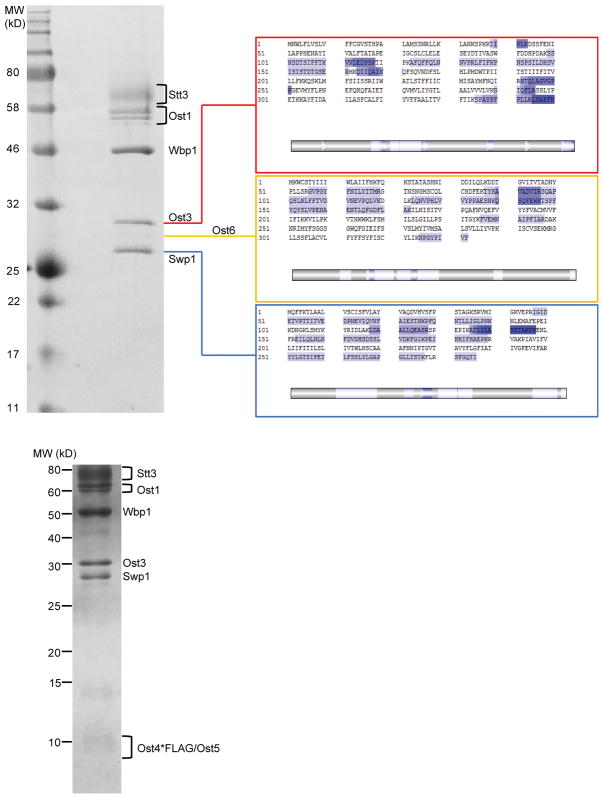
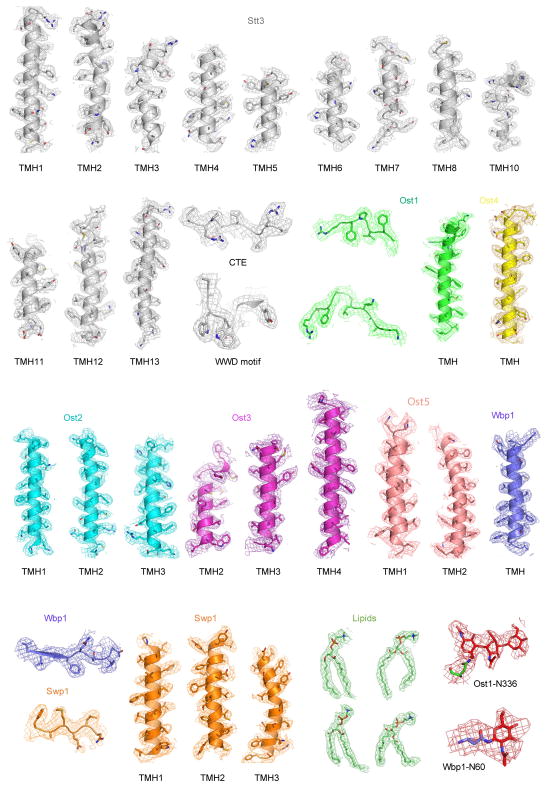
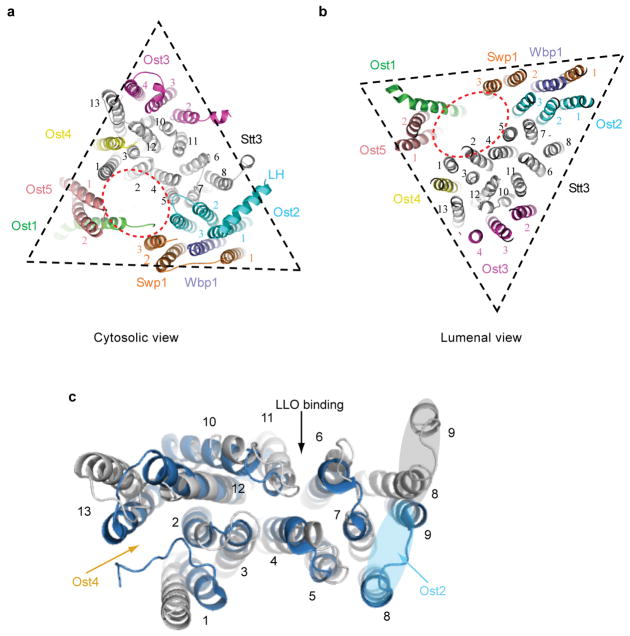
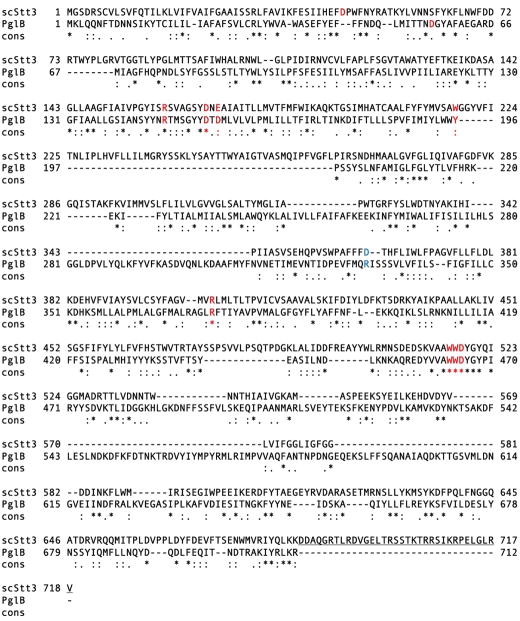
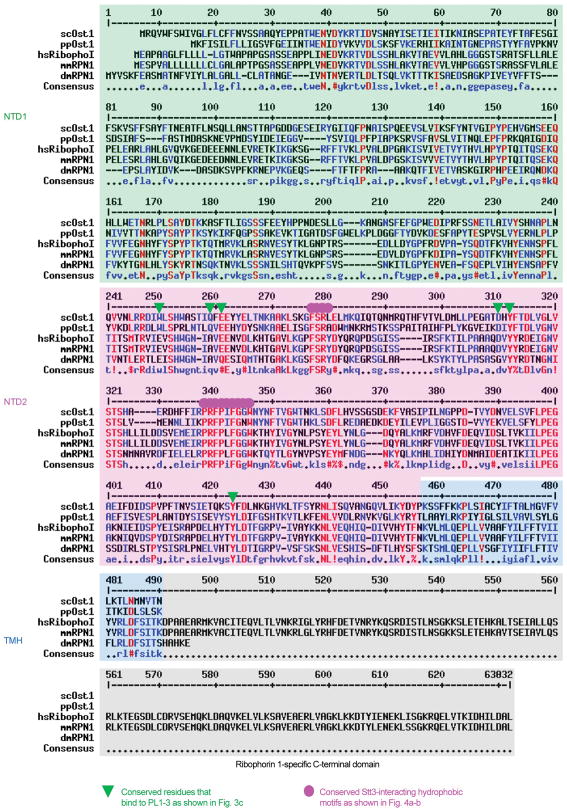
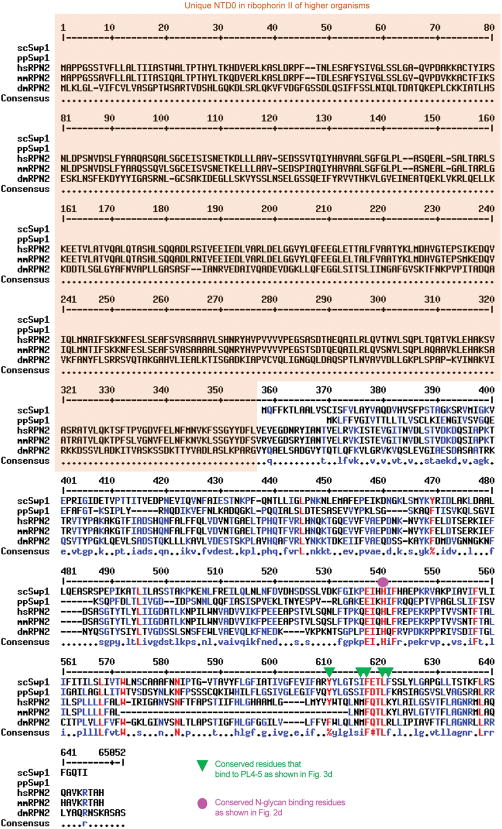
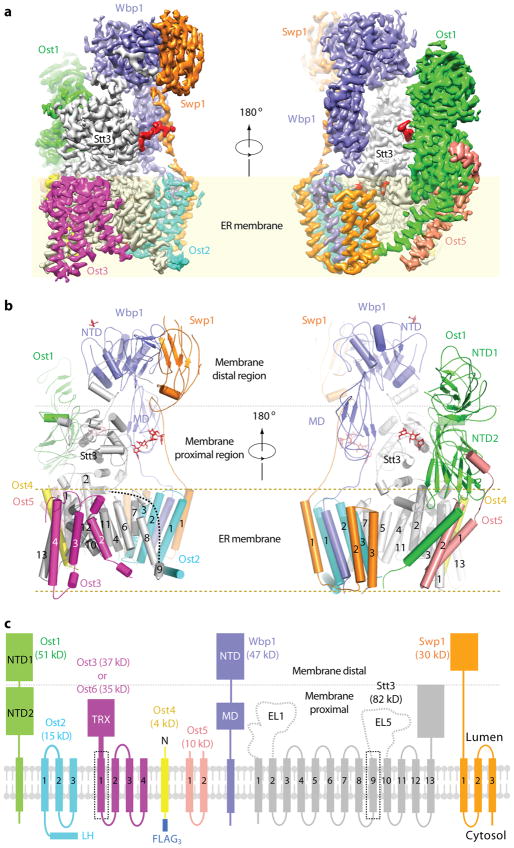
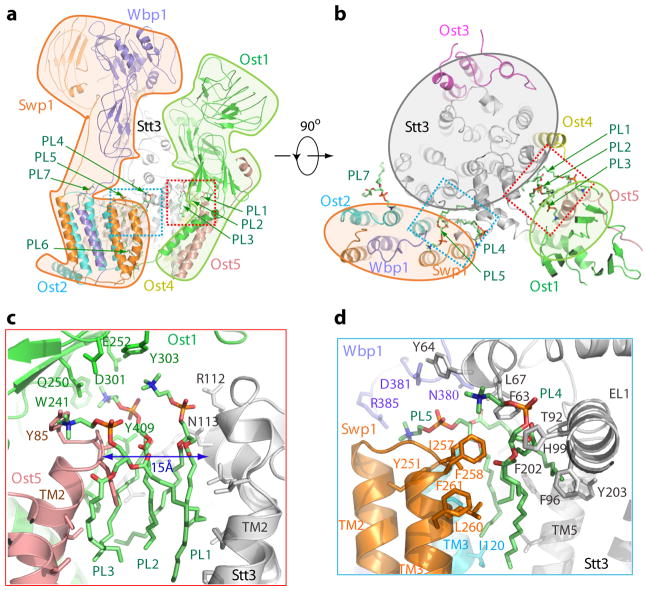
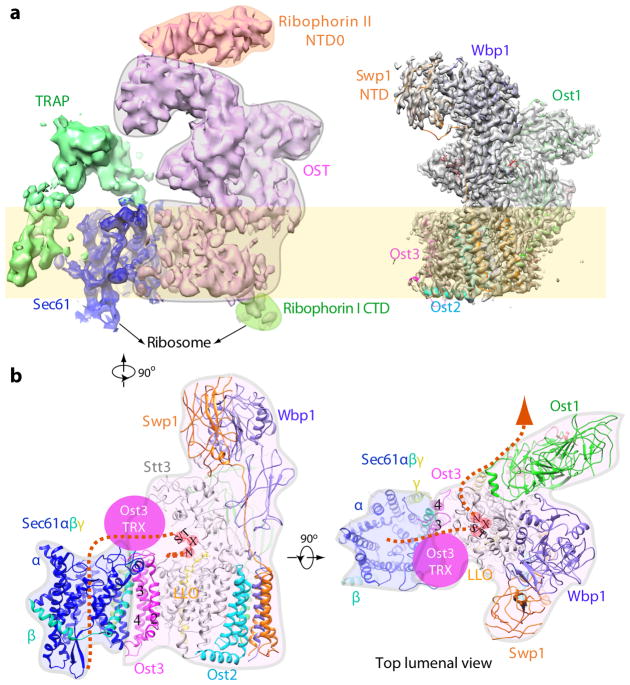
N-glycosylation is a ubiquitous modification of eukaryotic secretory and membrane-bound proteins; about 90% of glycoproteins are N-glycosylated. The reaction is catalysed by an eight-protein oligosaccharyltransferase (OST) complex that is embedded in the endoplasmic reticulum membrane. Our understanding of eukaryotic protein N-glycosylation has been limited owing to the lack of high-resolution structures. Here we report a 3.5 Å resolution cryo-electron microscopy structure of the Saccharomyces cerevisiae OST complex, revealing the structures of subunits Ost1-Ost5, Stt3, Wbp1 and Swp1. We found that seven phospholipids mediate many of the inter-subunit interactions, and an Stt3 N-glycan mediates interactions with Wbp1 and Swp1 in the lumen. Ost3 was found to mediate the OST-Sec61 translocon interface, funnelling the acceptor peptide towards the OST catalytic site as the nascent peptide emerges from the translocon. The structure provides insights into co-translational protein N-glycosylation, and may facilitate the development of small-molecule inhibitors that target this process.


Conflict of interest statement

The authors declare no competing financial interests.

Figures

Extended Data Figure 1
Extended Data Figure 1. Identification of Ost3/Ost6 by mass spectrometry
(a) The Coomassie blue–stained SDS-PAGE gel of the purified OST complex. The small subunits Ost2, Ost4-FLAG, and Ost5 were not visible in this 12% acrylamide SDS-PAGE gel because of their weak density. (b) Sequence coverage of tryptic digestion mass spectrometry (MS) of three bands at around 30 kDa that are labeled as Ost3, Ost6, and Swp1. The detected peptides are highlighted in blue. The lower bars under the sequences indicate matched peptides. Darker blue indicates more overlaps of peptides detected. (c) Ost2, Ost4-FLAG, and Ost5 were seen in the 15% acrylamide SDS-PAGE gel that was run slower and stained longer. For panel (a) and (c), the experiments were repeated more than 3 times with similar results.
Extended Data Figure 2
Extended Data Figure 2. Single-particle cryo-EM analysis of the OST complex
(a) A representative electron micrograph of the OST imaged in the Titan Krios with a K2 detector. About 4000 similar micrographs were recorded. (b) Selected reference-free 2D class averages. (c) 2D and 3D image classification procedure. (d) Gold-standard Fourier correlation of two independent half maps, and the validation correlation curves of the atomic model by comparing the model with the final map or with the two half maps. (e) Local resolution map of the OST complex structure.
Extended Data Figure 3
Extended Data Figure 3. A gallery of selected regions in the OST structure, illustrating the fitting between the 3D density map and the atomic model
These include 26 TMHs, several regions in the lumenal domains, four selected lipids, and two N-glycans.
Extended Data Figure 4
Extended Data Figure 4. EM density map of the TRX domain of Ost3
(a–b) From 3D classification, one class (Class I) contained stronger Ost3 TRX domain density than other classes. This map was further refined to 4.4 Å. Surface view of the map (left) and the corresponding cartoon view of the atomic model (right), colored by subunit, are shown in two orthogonal side views. The N-terminal thioredoxin domain (TRX) of Ost3 is highlighted by a magenta disk and is visible in this low-threshold display. The detergent densities surrounding the transmembrane region of OST is visible at this threshold, and are colored in cyan. The structure of the homologous Ost6 TRX (PDB ID 3G7Y) is tentatively placed for the purpose of domain location.
Extended Data Figure 5
Extended Data Figure 5. The transmembrane region of the OST complex
The TMHs of OST form a triangular shape and shown in cytoplasmic view (a) and lumenal view (b). The catalytic subunit Stt3 is in the center, surrounded by the other subunits. There is a sizable cavity in the center (red dotted circle). (c) Superposition of the transmembrane region of Stt3 and PglB (PDB ID 5OGL) viewed from the cytoplasmic side. The Stt3 TMH8-9 (light gray ellipse) moves towards the LLO biding surface relative to the TMHs8-9 of PglB (light blue ellipse), creating space for the Ost2 TMHs. The Stt3 TMH1 and TMH13 also move apart, forming a space for the only TMH of Ost4.
Extended Data Figure 6
Extended Data Figure 6. Sequence alignments of S. cerevisiae Stt3 and A. fulgidus PglB
PglB doesn’t have the CTE sequence (underscored) found in the yeast Stt3 and human STT3B. Several conserved residues in the active site are highlighted in red. R331 in the PglB, which stabilizes the −2 position D of the acceptor peptide, is highlighted in blue. An asterisk (*) indicates positions with identical residue, a colon (:) indicates strong conservation, and a period (.) indicates weak conservation.
Extended Data Figure 7
Extended Data Figure 7. Sequence alignment of selected eukaryotic Stt3
sc: Saccharomyces cerevisiae, hs: Homo sapiens. The CTE of human STT3A is shorter than those of STT3B and yeast Stt3.
Extended Data Figure 8
Extended Data Figure 8. Sequence alignment of selected eukaryotic Ost1
sc: Saccharomyces cerevisiae, pp: Pichia pastoris, hs: Homo sapiens, mm: Mus musculus, and dm: Drosophila melanogaster. An extra CTD in ribophorin I of higher organisms is not present in the yeast proteins (shaded gray). NTD1 is shaded in light green, NTD2 in light magenta, TMH in light blue, and the CTD of ribophorin I of higher organisms in light gray.
Extended Data Figure 9
Extended Data Figure 9. Sequence alignment of selected eukaryotic Swp1
sc: Saccharomyces cerevisiae, pp: Pichia pastoris, hs: Homo sapiens, mm: Mus musculus, and dm: Drosophila melanogaster. Ribophorin II of higher organisms has evolved an extra N terminal domain (NTD0, shaded in light orange) in the lumen that is not present in the two yeast proteins.
Figure 1
Figure 1. Subunit composition and atomic structure of the yeast OST complex
(a) Cryo-EM 3D map is shown in front and back views and colored by individual subunits. The shaded yellow rectangle represents the ER membrane. The three N-glycan densities are in red. (b) Atomic structure is shown in cartoons. Three N-linked glycans are displayed as sticks. The gray dotted line separates the membrane proximal- and membrane-distal lumenal regions. (c) The domain structures of the eight subunits. The letter N represents N-terminus of Ost4. EL1 and EL5 marks the external loops 1 and 5 in Stt3 transmembrane domain. Two flexible TMHs are highlighted with dotted squares.
Figure 2
Figure 2. The atomic structure of Stt3
(a) Stt3 is shown as a cartoon. TMHs are in grey, CTD in cyan, EL1 in magenta, and CTE in red. The missing TMH9 is shown as a dotted black line. The green mesh is the N-glycan density of Asn539. The active site is highlighted by a dotted red square. The magenta dotted rectangle marks the Stt3 CTE interacting with Wbp1 and Swp1, and the green dotted square marks the N-glycan interacting with Wbp1 and Swp1. (b–d) are enlargements of the dotted boxes in a. The active site of Stt3 (b) is superimposed with the PglB structure (PDB ID 5OGL, light blue) in complex with Mn2+, a peptide (DQNATF), and LLO analog ((ωZZZ)-PPC-GlcNAc in yellow sticks). The red arrow indicates an outward shift of Stt3 lumenal domain relative to that of PglB.
Figure 3
Figure 3. Assembly of the OST complex
OST is shown as cartoon in a side view (a) and a top (lumenal) view (b). Subcomplexes Ost1–Ost5, Ost2–Swp1–Wbp1, and Stt3–Ost3-Ost4 are highlighted by transparent shapes. The phospholipids PL1-7 are shown in green sticks. (c) Close-up view of the red box in a and b. PL1-3 mediate the interactions between Stt3 and Ost1–Ost5, filling a 15-Å gap at the interface. (d) Close-up view of the cyan box in a and b. PL4-6 mediate the interaction between Stt3 and Ost2–Swp1. PL6 in the lower leaflet of membrane is not visible here.
Figure 4
Figure 4. The atomic structures of the noncatalytic subunits
(a) Cartoon representation of subcomplex Ost1–Ost5. NTD1 and NTD2 of Ost1 are in green and magenta, respectively. Ost5 bridges Ost1 and Stt3. (b) Superposition of NTD1and NTD2 of Ost1 with the noncatalytic domain of human leukotriene A-4 aminopeptidase. (c) Cartoon representation of subcomplex Ost2–Wbp1–Swp1. The NTD and MD of Wbp1 and NTD of Swp1 are highlighted by three dotted squares. (d) Superposition of the NTD of Wbp1 (blue) and the NTD of GIFT52 (yellow). (e) Superposition of the MD of Wbp1 (blue) and the domain N of amylase (yellow). (f) Superposition of the Swp1 NTD (orange) and the MD-1 (yellow). The red sticks in e and f are substrates in the homolog crystal structures.
Figure 5
Figure 5. A possible LLO entry route and allosteric coupling by Ost2 LH
(a) The unresolved Stt3 TMH9 (gray dotted line) and Ost3 TMH1 (magenta dotted line) are 10 Å away from the central body of OST, forming an enlarge LLO-binding site. The gap between TMH8 and TMH9 of Stt3 is likely the LLO entry gate. The red curve indicates a likely path for allostery mediated by the Ost2 LH helix. The purple rectangles, cyan circles, and red hexagons represent dolichol, pyrophosphate, and OS, respectively. (b) The top (lumenal) view of the LLO-binding site. (c) The LLO-binding hydrophobic surface in OST. PL8 is the eighth phospholipid at the substrate binding surface. Mn2+ and the donor analog in PglB structure are superimposed and shown in yellow spheres. (d) Crystal structure of PglB (rainbow cartoon) in complex with LLO analog (yellow spheres). Stt3 TMHs8-9 (gray cartoon) are superimposed.
Figure 6
Figure 6. A model of the OST-translocon super-complex
(a) Comparison of the yeast OST 3D map (right panel) with cryo-ET map of a mammalian OST (purple), which is in complex with translocon (blue), TRAP (translocon-associated protein) complex (green), and ribosome (not shown) (EMD-3069). The mammalian OST has two extra domains: the cytosolic CTD in ribophorin I and lumenal NTD0 of ribophorin II. (b) A model of the OST-translocon super-complex, derived from docking OST structure and Sec61 structure (PDB ID: 3JC2). The dashed curve denotes the potential pathway for nascent peptide. See text for details.

References

    1. Larkin A, Imperiali B. The expanding horizons of asparagine-linked glycosylation. Biochemistry-Us. 2011;50:4411–4426. - PMC - PubMed
    1. Cherepanova N, Shrimal S, Gilmore R. N-linked glycosylation and homeostasis of the endoplasmic reticulum. Curr Opin Cell Biol. 2016;41:57–65. - PMC - PubMed
    1. Dempski RE, Jr, Imperiali B. Oligosaccharyl transferase: gatekeeper to the secretory pathway. Curr Opin Chem Biol. 2002;6:844–850. - PubMed
    1. Mohorko E, Glockshuber R, Aebi M. Oligosaccharyltransferase: the central enzyme of N-linked protein glycosylation. J Inherit Metab Dis. 2011;34:869–878. - PubMed
    1. Kornfeld R, Kornfeld S. Assembly of asparagine-linked oligosaccharides. Annu Rev Biochem. 1985;54:631–664. - PubMed

Publication types

MeSH terms

Substances