. 2018 Mar 1;555(7694):54-60.
doi: 10.1038/nature25741. Epub 2018 Feb 21.

Population snapshots predict early haematopoietic and erythroid hierarchies

Affiliations

Population snapshots predict early haematopoietic and erythroid hierarchies

Betsabeh Khoramian Tusi et al. Nature. .

Abstract

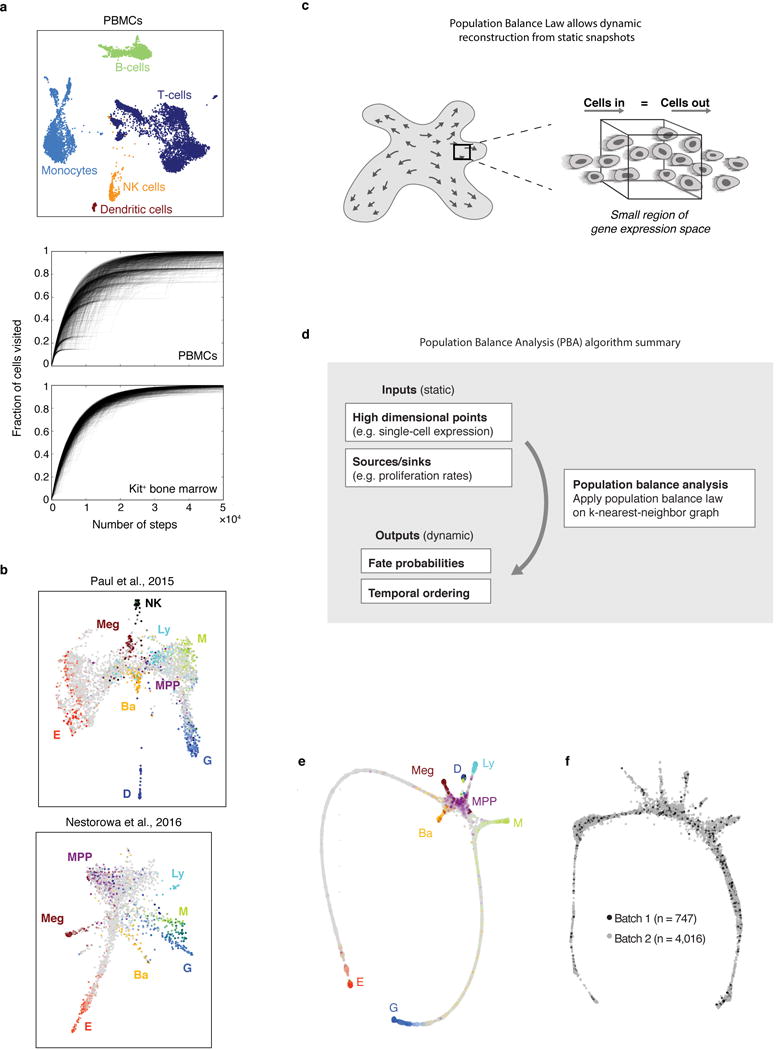
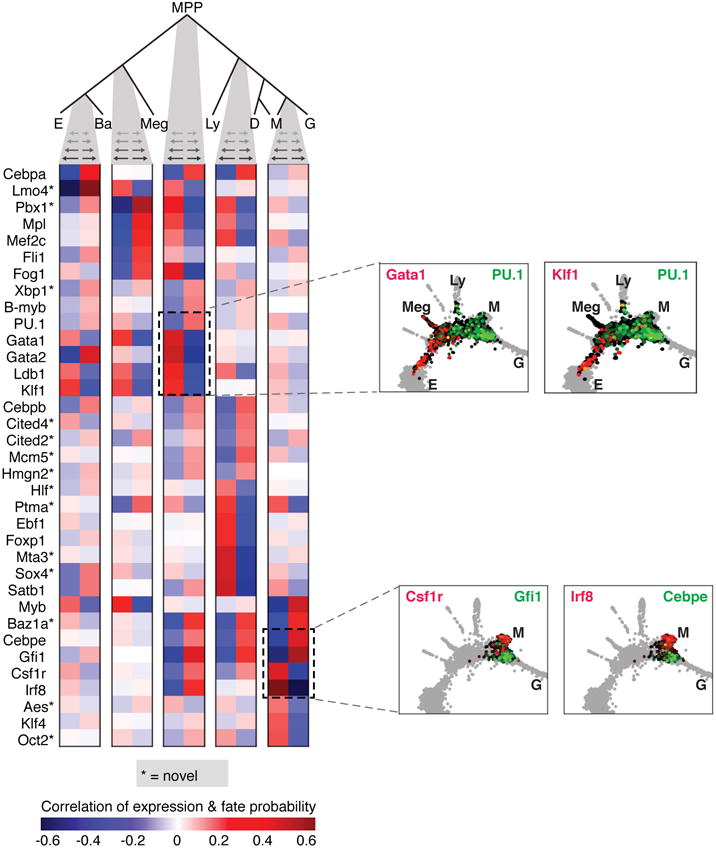
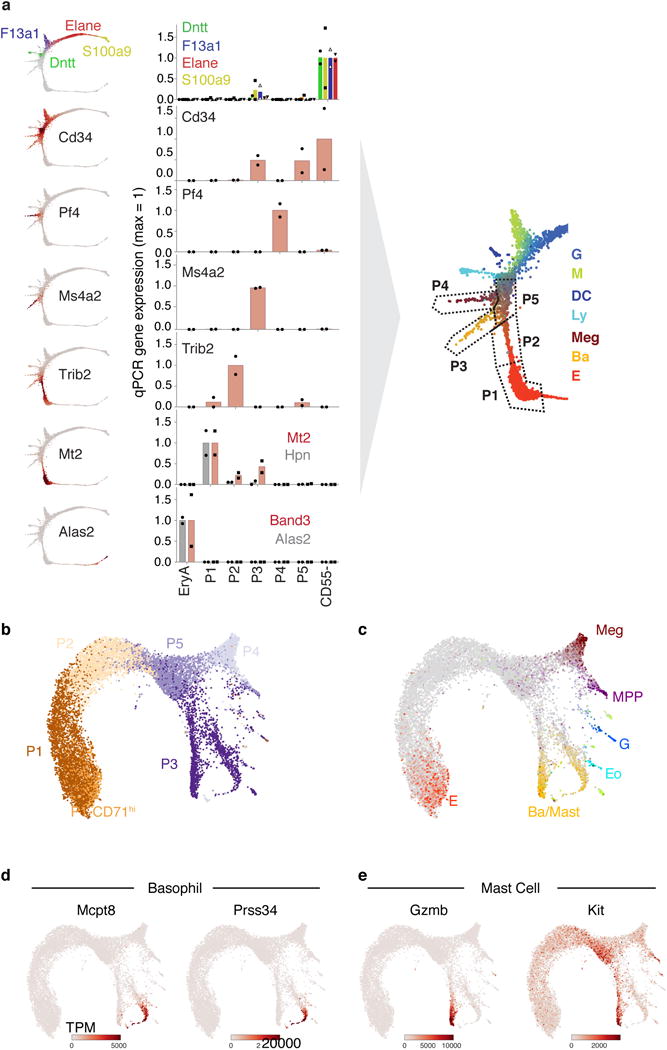
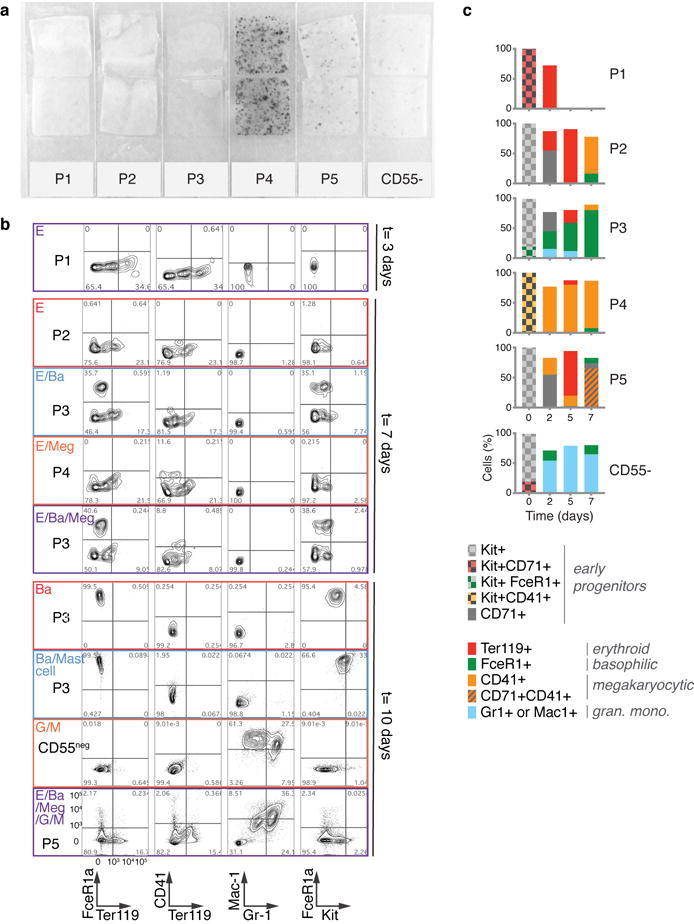
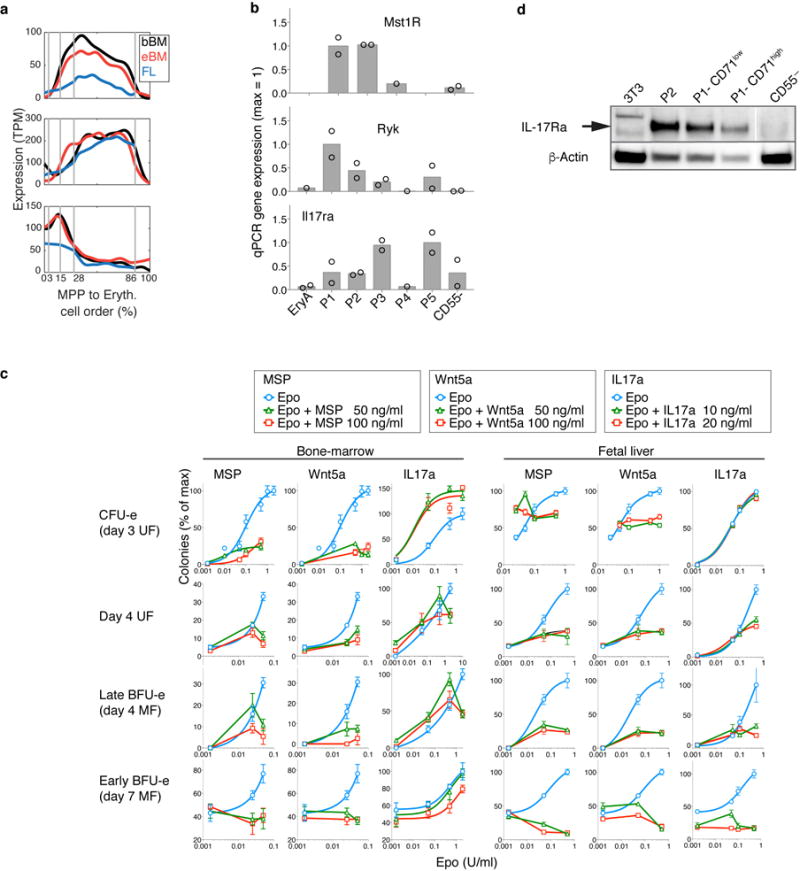
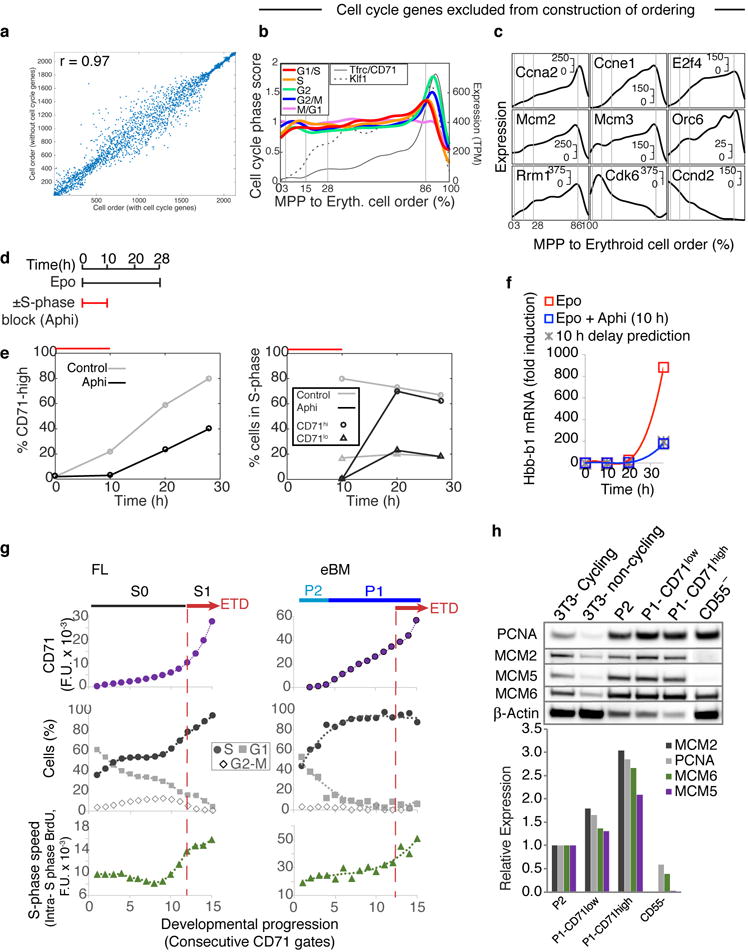
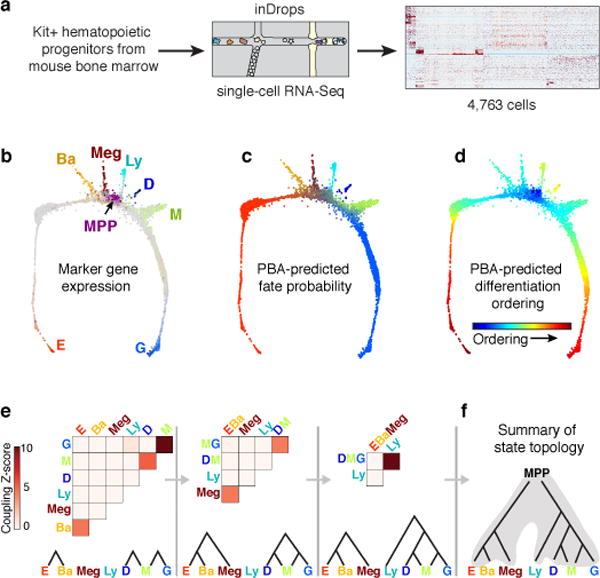
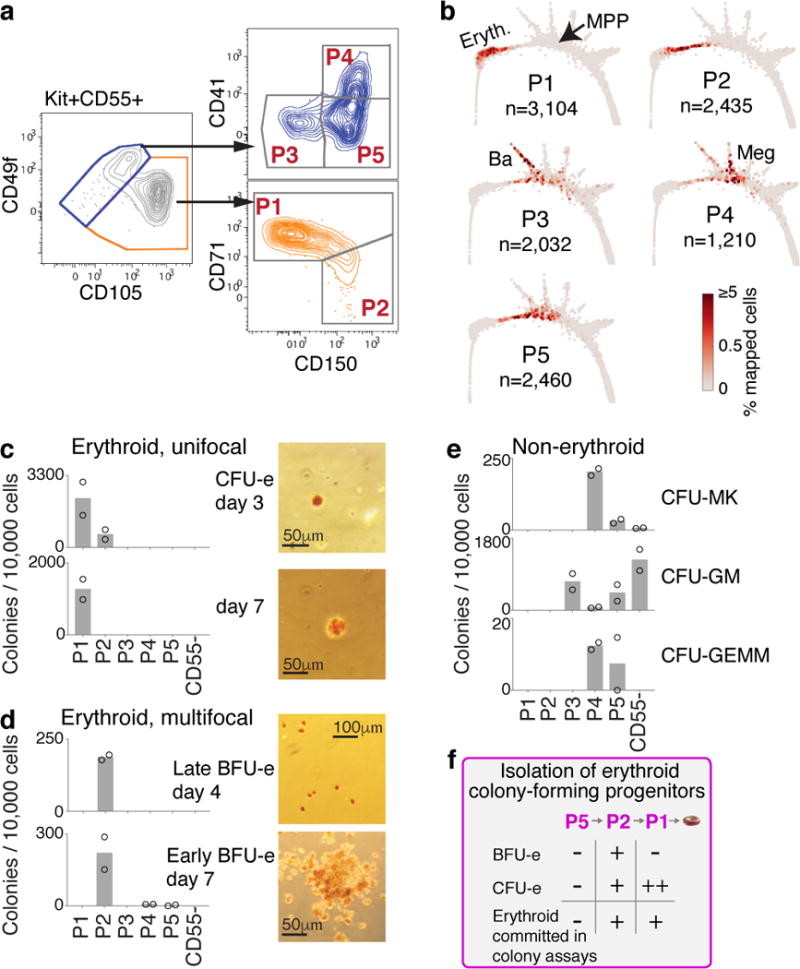
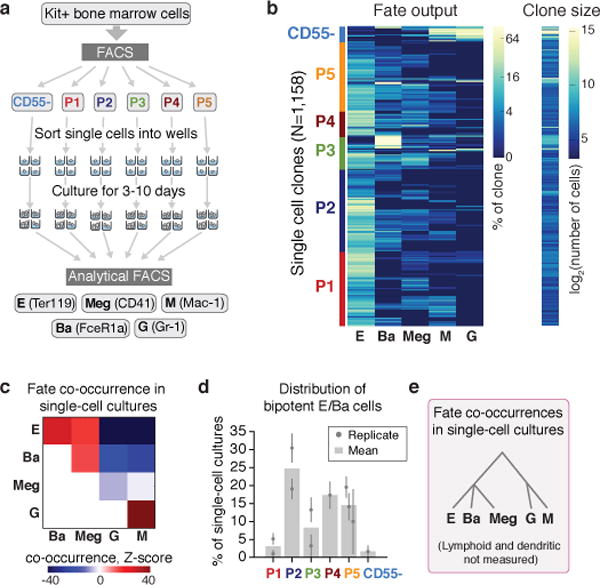
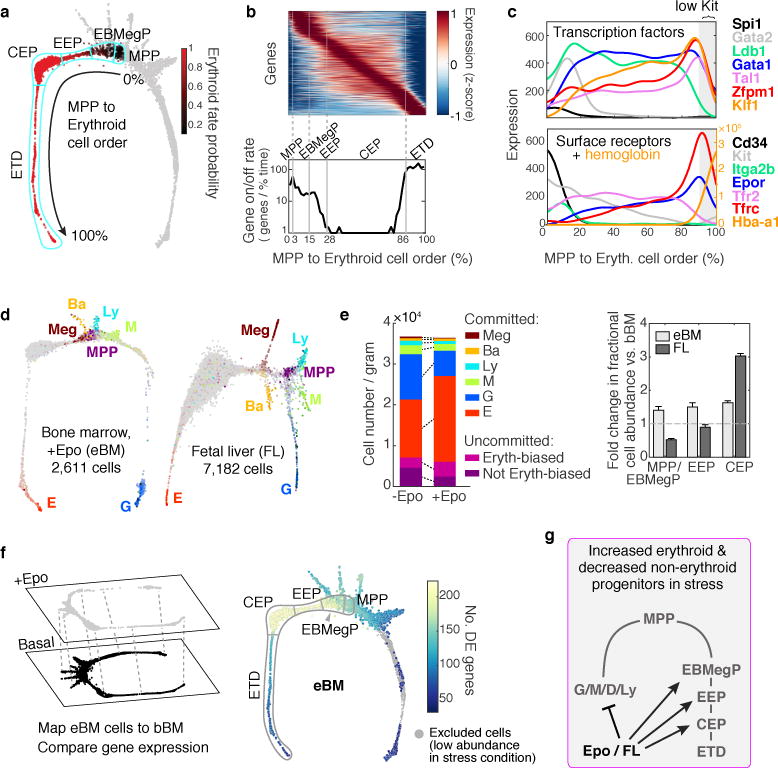
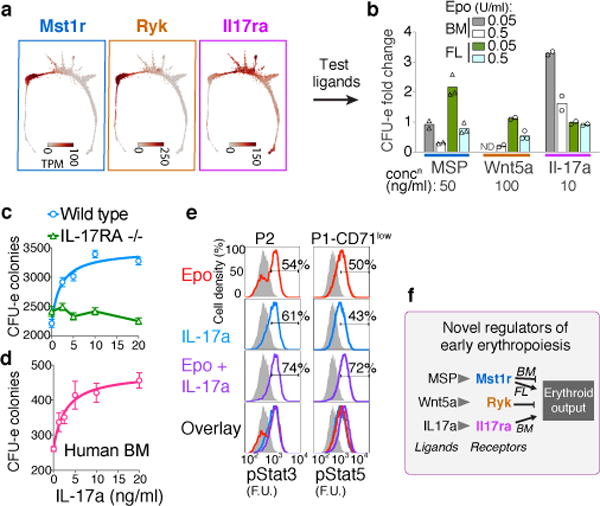
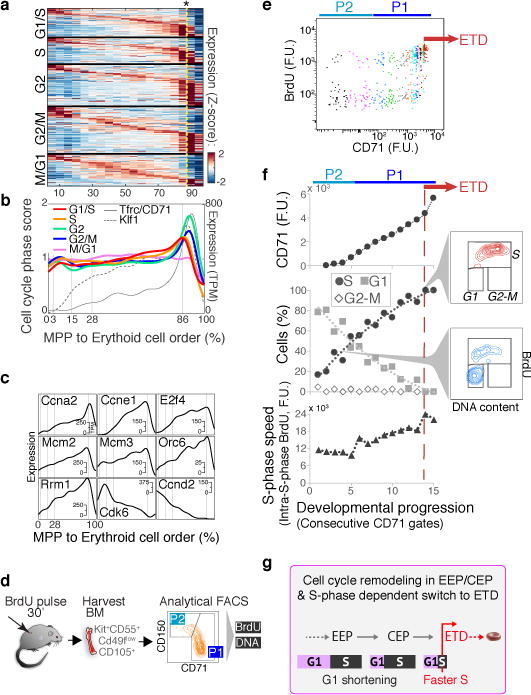
The formation of red blood cells begins with the differentiation of multipotent haematopoietic progenitors. Reconstructing the steps of this differentiation represents a general challenge in stem-cell biology. Here we used single-cell transcriptomics, fate assays and a theory that allows the prediction of cell fates from population snapshots to demonstrate that mouse haematopoietic progenitors differentiate through a continuous, hierarchical structure into seven blood lineages. We uncovered coupling between the erythroid and the basophil or mast cell fates, a global haematopoietic response to erythroid stress and novel growth factor receptors that regulate erythropoiesis. We defined a flow cytometry sorting strategy to purify early stages of erythroid differentiation, completely isolating classically defined burst-forming and colony-forming progenitors. We also found that the cell cycle is progressively remodelled during erythroid development and during a sharp transcriptional switch that ends the colony-forming progenitor stage and activates terminal differentiation. Our work showcases the utility of linking transcriptomic data to predictive fate models, and provides insights into lineage development in vivo.


Conflict of interest statement

Competing Interests: AMK is a co-founder of 1Cell-Bio.

Figures

Extended Data Figure 1
Single-cell RNA-seq of Kit+ hematopoietic progenitors for prediction of the early hematopoietic hierarchy. a Upper panel: SPRING plot of 7,959 human peripheral blood mononuclear cells (PBMCs) from 10× Genomics [https://support.10xgenomics.com/single-cell-gene-expression/datasets/2.0.1/pbmc8k]. Clusters were generated by performing spectral clustering on the underlying k-nearest-neighbor (kNN) graph and annotated on the basis of marker genes. NK cell, natural killer cell. Middle and lower panels: Random walks over kNN graphs for the PBMC (middle) and Kit+ bone marrow (lower) datasets. Each plot shows the fraction of nodes (cells) visited for 1,000 simulated random walks. b Left panel: SPRING plot of 2,855 lineage (Lin)Kit+Sca1 mouse hematopoietic progenitor cells from Paul et al. Right: SPRING plot of 1,656 cells from three mouse hematopoietic progenitor populations (LinKit+Sca1, LinKit+Sca1+, and LinKit+Sca1+Flk2CD34+) from Nestorowa et al. Colored (non-gray) cells indicate expression of lineage-specific genes (see Supplementary Table 7). E, erythroid; Ba, basophil/mast cell; Meg, megakaryocyte; MPP, multipotent progenitor; Ly, lymphocyte; NK, natural killer cells; M, monocyte; G, granulocyte; D, dendritic cell. c Schematic of the Population Balance Law, which relates the dynamic velocities of cells to the distribution of states they are in at a moment in time. The law states that in steady state, after accounting for cell division and loss, the flux of cells entering any region of gene expression space equals the flux out of that region. d Flow diagram of inputs and outputs to the Population Balance Analysis (PBA) algorithm. The population balance law is applied to inputs that include single-cell expression data and estimates of cell proliferation and loss rates at each point in gene expression space; outputs infer cell dynamics, including fate probabilities and pseudo-temporal ordering. e SPRING plot of bone marrow Kit+ cells (Fig. 1) constructed using only the PBA-predicted fate probabilities and differentiation ordering as inputs (n= 4763 cells from one InDrops experiment). Colored cells indicate expression of lineage-specific genes as in Fig. 1b. f SPRING plot of bone marrow Kit+ cells (Fig. 1), with cells colored by library preparation batch.
Extended Data Figure 2
Predicting key regulators at hematopoietic choice points. Candidate regulators of fate choice, identified by ranking transcription factors and transmembrane receptors by their correlation with PBA-predicted fate probabilities at key choice points in hematopoiesis. Top-ranked genes are shown; these include many canonical regulators. Candidates not previously reported are marked by asterisk. Several candidates participate in more than one fate choice. Insets show SPRING plots colored by expression of representative genes.
Extended Data Figure 3
Mapping HPC subsets P1-P5 to the Kit+ SPRING plot by RT-qPCR and scRNA-seq a Subpopulations P1 to P5 map onto specific regions of the SPRING plot. On the left are SPRING plot heat maps for a panel of marker genes; on the right are corresponding measured expression for each of the marker genes by RT-qPCR, performed on sorted cell subsets P1 to P5, and on EryA (= cells undergoing ETD). A cartoon illustrates the mapping of each of P1 to P5 onto the SPRING plot based on the RT-qPCR results. Bars are mean of n= 2 independent experiment (circles, triangles or squares). Expression is shown normalized to β-actin mRNA. b,c SPRING plot of single-cell transcriptomes from freshly sorted P1-P5 subsets (Fig. 2a–b). Cells are colored by sorted subpopulation (b) or by expression of lineage-specific marker genes (c) (Supplementary Table 7). d,e SPRING plots of P1-P5 subset cells, colored by expression of basophil (d) and mast cell (e) marker genes. The larger cell number of cells in the P3 region of the graph resolves a split between the two lineages that was not observable in the original Kit+ dataset.
Extended Data Figure 4
Validation of PBA predictions. a Megakaryocytic colonies from sorted subsets P1 to P5 and from Kit+CD55 cells, stained for the megakaryocytic marker acetylcholinesterase. Duplicate cultures are shown; representative of n=2 independent experiments. b Representative flow cytometry plots to assay fate output of single cells in liquid culture (see Fig. 3, including Fig. 3a for experimental design). Each row corresponds to a single clone, with the left column indicating the source subset (P1 to P5, CD55) of the clone and the cell type(s) produced, as inferred from the FACS plots in the remaining columns. These data are representative of n= 1158 single cell clonal cultures, pooled from a total of n=3 independent sorting experiments (complete dataset is shown in Fig. 3b). c Bulk liquid cultures of freshly sorted P1 to P5 subsets and Kit+CD55 cells in the presence of Epo and a cocktail of cytokines supporting myeloid progenitors. On the indicated days, cells were labeled with antibodies as indicated and analyzed by flow cytometry.
Extended Data Figure 5
The early erythroid trajectory. a RT-qPCR for expression of established erythroid regulators in sorted P1 to P5 subsets. Expression of each gene is normalized to β-actin, Bars are mean of n=2 independent experiments (circles). b Left: representative western blot of GATA1 expression in sorted P1 (subdivided into CD71med and CD71hi subsets), P2, and EryA (CD71+Ter119+FSChi cells, representative of ETD). 3T3-Gata-1: 3T3 cells virally transduced with Gata-1 expression vector, used as positive control; untransduced 3T3 cells were used as negative control. Right: Quantitation of Gata-1 expression (mean) by densitometry; Data points are of two independent western blots. For gel source data, see Supplementary Figure 1. c Density of FACS subsets P1 to P5 along the erythroid trajectory. Single-cell transcriptomes from each subset were mapped to their most similar counterparts in the Kit+ data (Fig. 2a–b; cell number analyzed for each subset are indicated in Fig. 2b). Shown here is the fraction of mapped cells, following smoothing with a Gaussian kernel. Also included are CD71High P1 cells, constituting cells with the 30% highest CD71 expression in that subset (n=752 cells post-filter). d Distribution of CD71 expression in P1 and P2 cells immediately following sorting (gray) and after 24 hours of in vitro differentiation (lavender). Representative of n= 2 independent experiments. e Dynamically varying genes along the MPP to erythroid axis were clustered based on their behavior across three transition points. At each transition, gene expression is either increased, decreased, or unchanged, giving a total of 27 potential dynamic patterns across all 3 transitions, shown in red. The number of genes corresponding to each dynamic pattern is noted, and individual gene Z-score normalized expression traces are shown in black. Selected clusters were further analyzed in Extended Data Figure 6 and are marked with an asterisk and a representative gene.
Extended Data Figure 6
Gene set enrichment on dynamic gene clusters in early erythroid differentiation. a-d Nine key dynamic gene clusters along the MPP to erythroid progression (Extended Data Figure 5e) are analyzed further for gene ontology. Each cluster is identified by its dynamic pattern with a cartoon of nodes and edges. Each node represents a progenitor stage (in order, MPP/EBMegP+EEP/CEP/ETD), connected to the next stage by an edge that is either going up (for increased expression) or down (for decreased expression; see Extended Data Figure 5e). a Number and identity of transcription factors (TFs) whose targets are enriched in the dynamic clusters, as predicted by ChIP-X experiments. b Significance of enrichment for signaling pathways and Gene Ontology gene sets in the dynamic gene clusters (hypergeometric test with Benjamini-Hochberg correction for multiple hypothesis testing). c,d Enrichment of transcription factor targets (TFT). c Heatmap (−log10 of p value of hypergeometric test with Benjamini-Hochberg correction for multiple hypothesis testing) of target gene enrichment for TFs (rows) with targets significantly enriched (p<0.05) in at least one of the nine dynamic clusters (columns, labeled on top) highlighted in Extended Data Figure 5e. Note that the TFTs shown are based on previous ChIP-X experiments and it is possible that unappreciated TFTs occur in early erythropoiesis. d Gene expression traces over the erythroid trajectory for the TFs from (c). Rows match those in (c).
Extended Data Figure 7
Extended Data Figure 7. Quantification of absolute Kit+ cell number in bone-marrow following in vivo administration of Epo
a, b Adult female mice, eight weeks of age, were injected with either Epo (100 U/25 g) or saline (=basal), once per day for two days. Bone marrow was harvested at 48 hours. Viable (trypan blue negative) cells were counted using a TC20™ automated cell counter (BIORAD) and stained for Kit, Ter119 and CD71 and lineage markers. Data is from n=two independent experiments, with 5 mice analyzed individually in each group (basal or Epo) in each experiment. a, Representative flow cytometric analysis of either basal or Epo-stimulated bone marrow, gating on Kit+ Lin cells (left panels) or on proerythroblasts (ProE) and Ter119hi cells (right panels; ProE and Ter119hi cells are sequential stages of ETD). b, Data summary (mean ± SD) for all mice (n= 10 for each group). Top panels show the fraction of all BM cells for each of the flow cytometric gates defined in (a). The lower panels show the absolute cell count in adult bone marrow for subsets defined as in each flow cytometric gate, or for the total number of bone-marrow cells. P values (2-tailed t test, unequal variance) are shown for all p<0.05.
Extended Data Figure 8
Extended Data Figure 8. Identification of stage-specific differential gene expression during the erythroid stress response
a Identification of genes differentially expressed in EEP cells of either eBM (left panel) or FL (right panel), compared with basal BM (n=1 single cell inDrop experiment per condition). P-values were calculated using a binomial test for differential expression (see Methods) and measure the significance of the expression difference. The specific enrichment score (also described in Methods) measures the degree to which the differential expression is specific to this region of interest (EEPs); positive scores correspond to region-specific upregulation, and negative to region-specific downregulation. Selected genes are highlighted. b The same analysis applied to the CEP stage (n=1 single cell inDrop experiment per condition). c Stage-specific differential gene expression during stress, comparing eBM and FL. The heatmap (left) shows the number of DE genes at each stage that show similar or different patterns of upregulation and downregulation in FL and eBM. Representative gene traces are shown on the right.
Extended Data Figure 9
Extended Data Figure 9. Localized gene expression and functional response of the erythroid lineage to stimulation of Mst1, Ryk and IL-17Ra
a,b Predicted expression pattern (a) and confirmation by RT-qPCR (b) for Mst1r, Ryk and Il17ra in basal BM. In (a) traces show the smoothed scRNA-Seq gene expression on cells arranged along the erythroid trajectory in basal BM, FL and eBM. RT-qPCR data are mean (bars) of n= two independent exeriments (circles). c Complete results for CFU-e and BFU-e colony formation assays in methylcellulose, supporting the data shown in Fig. 5. Curves show colony numbers in the presence of increasing concentrations of Epo, or Epo with added ligand, either MSP, Wnt5a or IL-17a. Error bars show SD of two independent experiments, with four replicates per experiment. Where appropriate, data was fitted with a dose-response curve, Hill coefficient=1. d Western blot shows IL-17Ra peak expression in P2/EEP cells, dropping in P1/CEP and in the granulocytic branch (which contributes most of the CD55− cells), consistent with the SPRING plots in Fig. 5a. Western blot is representative of n= two independent experiments. For gel source data, see Supplementary Figure 1.
Extended Data Figure 10
Extended Data Figure 10. Independence of cell ordering on cell cycle genes, and evidence of an S-phase dependent CEP-to-ETD transition in BM erythropoiesis
a The computational ordering of cells from MPP to ETD is not sensitive to whether or not annotated cell cycle genes are included (cell ordering correlation is R=0.97). b,c Reproduction of main text figure panels 6b,c after excluding cell cycle genes shows that the computationally inferred gene expression dynamics of cell cycle genes during EEP/CEP differentiation are not sensitive to whether or not annotated cell cycle genes are included in ordering cells. d-f Activation of ETD is dependent on S phase. The experiment illustrated in e-f is representative of two independent experiments. d Schematic illustration of experiments testing the link between S-phase progression and the CEP-to-ETD transition. BM Kit+LinCD71 cells were cultured in the presence of Epo for 28 hours, and either in the presence or absence of the DNA polymerase inhibitor Aphidicolin (Aphi) for the first 10 hours. e BM Kit+LinCD71 cells require S phase in order to upregulate CD71, an initial event in ETD. Cells were treated as in (d); left: CD71hi cells fail to appear in the first 10 hours if cells are exposed to Aphi; they appear as soon as Aphi is removed from the medium. Right: cell cycle analysis of the same cells shows that Aphi prevented S phase progression during its presence in the culture medium; Aphi removal was followed by full recovery of S phase progression, with a high fraction of CD71hi cells in S phase. Representative of n=3 independent experiments. f Aphi exposure for 10 hours delays induction of β-globin (Hbb-b1) by 10 hours. Representative of n= 2 independent experiments. g CD71 expression (top row), cell cycle phase distribution (middle), and intra-S phase DNA synthesis rate (lower), for consecutive FACS gates of increasing CD71 in early stages of erythropoiesis from the fetal liver (left panel, representative of n= 4 independent experiments) and Epo-simulated bone marrow (right; n=2). See Fig. 6e,f for similar analysis in basal BM. h Western blots (upper panel) and their quantification by densitometry (lower) showing an increase in S phase proteins during progression from EEP/P2 to early CEP (P1-CD71lo to late CEP (P1-CD71hi). Controls 3T3 cells were either cycling, or contact-inhibited (non-cycling), as indicated. Western blots are representative of n=3 independent experiments. For gel source data, see Supplementary Figure 1.
Figure 1
Figure 1. The early hematopoietic hierarchy predicted by scRNA-seq
a Schematic for scRNA-seq of Kit+ mouse bone marrow. b SPRING plots of single-cell transcriptomes. Each point is one cell. Colors indicate lineage-specific gene expression. E, erythroid; Ba, basophilic; Meg, megakaryocytic; Ly, lymphocytic; D, dendritic; M, monocytic; G, neutrophil granulocytes; MPP, multipotential progenitors. c,d Parameterization of the cell state graph using PBA, encoding the graph position of each cell by a set of predicted fate probabilities (c) (colors as in (b)), and pseudo-temporal ordering with MPPs at the origin, terminating with the most mature observed cells of each lineage (d). e,f A cell state hierarchy encodes the cell graph topology. Lineage-biased states were identified by comparing the fraction of cells with PBA-predicted bilineage coupling with expected values from fate randomization (e). Iteratively joining fates based on pairwise coupling revealed the cell state hierarchy (f).
Figure 2
Figure 2. A novel sorting scheme isolates erythroid progenitors
a Kit+CD55+ BM cells were sorted into gates P1 to P5, and profiled using scRNA-Seq. b P1-P5 single cell transcriptomes localized to their most similar counterparts on the SPRING graph. c-e Colony formation by P1-P5 and Kit+CD55 cells. Bars are mean of n=2 independent experiments (circles), each performed in triplicate. Images show erythroid colonies, stained for hemoglobin with diaminobenzidine. Colonies: CFU-MK=Megakaryocytic (Extended Data Fig. 4a), CFU-GM= granulocytic/monocytic; CFU-GEMM= mixed myeloid. f Summary of erythroid colony potential of FACS subsets.
Figure 3
Figure 3. Predicted fate couplings confirmed by single cell fate assays
a Schematic of single cell liquid cultures, measuring clonal output with the indicated antibodies. b Lineage output (left) and size (right) of each clone (rows) as in (a). c Lineage co-occurrences in (b), computed by comparing the number of clones producing a pair of fates to the number expected following randomization. d Fraction of bipotent erythroid-basophil (EBa) clones in P1-P5, containing E and Ba cells, but no other fates. Individual points and error bars show the expectation value and standard error from independent single cell sorting experiments. Bars represent the mean of n=two (P1, P2, P3) or n=three (P5) independent experiments; a single experiment was performed for P4 and CD55-. e Cell state hierarchy based on fate co-occurrence in single-cell cultures.
Figure 4
Figure 4. Stages of early erythropoiesis and the global erythroid stress response
a Erythroid trajectory stages between MPP and erythroid terminal differentiation (ETD): EBMegP, Erythroid-Basophil-Megakaryocyte biased progenitors; EEP, Early Erythroid Progenitors; CEP, Committed Erythroid Progenitors. The SPRING plot shows PBA-predicted erythroid fate probability. b Top: dynamically varying genes (rows), ordered by peak expression, in cells (columns) ordered from MPP to ETD. Gene expression smoothed using a Gaussian kernel. Bottom: number of genes turning on or off (density of expression inflection points) with progression from MPP to ETD. The x-axis represents PBA-predicted differentiation ordering of cell transcriptomes, uniformly spaced from the least (0%) to the most differentiated (100%). c Gene expression traces for established erythroid genes. d SPRING plots of eBM and FL. Cells colored as in Fig. 1b. e Left: Erythroid lineage expansion at the expense of non-erythroid cells (see Extended Data Fig. 7). Among uncommitted cells, erythroid-biased progenitors increased, while the remainder diminished. Committed cells were defined by a PBA-predicted erythroid fate probability >0.5. Right: relative change in each progenitor stage relative to basal bone marrow. Error bars are the sampling standard error (n=1 sample per condition). f Epo stimulated differential gene expression. Cells from eBM were first mapped onto the basal BM SPRING plot, followed by analysis of differentially-expressed (DE) genes. g Summary of the stress erythropoiesis response.
Figure 5
Figure 5. Novel growth factor regulators of early erythropoiesis
a Expression patterns for Mst1r, Ryk and Il17ra. See Extended Data Fig. 9a,b. b Effect of MSP, Wnt5a or Il17a on Epo-dependent CFU-e colony formation. Bars are means of n=2 or 3 independent experiments (individual data points), each performed in quadruplicate. Full analysis in Extended Data Fig. 9c. c The IL-17a response is lost in IL-17Ra−/− BM. Mean ± SD per 500,000 BM cells plated in triplicate in the presence of Epo (0.05 U/ml); representative of two independent experiments. d IL-17a stimulates CFU-e formation in freshly isolated human BM mononuclear cells. Mean ± SD per 85,000 cells plated in triplicates. e IL-17a –mediated phosphorylation of Stat3 and Stat5 (pStat3, pStat5). Fresh BM cells were starved of cytokines for 3 hours, and then stimulated with either Epo, IL-17a or both; FACS profiles are for baseline (starved, in grey), and 60 minutes –post stimulation (in color). Representative of 2 independent experiments, each performed in duplicate. f Summary of novel growth factor effects on erythroid output.
Figure 6
Figure 6. Extensive remodeling of the cell cycle during erythroid development
a Cell-cycle-phase specific genes, ordered by peak expression, reveal cell-cycle synchronization with the CEP/ETD transition (indicated by *). b Mean expression of all genes specific to each cell cycle phase (as in (a)), traced along the erythroid trajectory. ETD is activated with a sharp Tfrc/CD71 upregulation. c Representative cell cycle genes correlated or anti-correlated with erythroid trajectory progression. d Schematic for cell cycle analysis of erythroid progenitors in vivo. BM was harvested and fixed 30 min following BrdU injection; P1 and P2 cells were analyzed for BrdU incorporation and DNA content. e BrdU-labeled S phase cells, as in (d). Cell coloring represents consecutive 7-percentile gates of increasing CD71, reflecting progression through P2/EEP and P1/CEP (Extended Data Fig. 5c,d). Transition to ETD (red arrow) is marked by a sharp CD71 increase, and synchronization in S phase (BrdU+). f CD71 expression (top), cell cycle phase distribution (middle), and intra-S phase DNA synthesis rate (lower panel), for all gates in ‘e’. Insets show representative cell cycle distribution FACS plots. Representative of three independent experiments. Similar eBM and FL analysis is in Extended Data Fig. 10g. g Summary of cell cycle remodeling during early erythropoiesis.

References

    1. Fujiwara Y, Browne CP, Cunniff K, Goff SC, Orkin SH. Arrested development of embryonic red cell precursors in mouse embryos lacking transcription factor GATA-1. Proc Natl Acad Sci USA. 1996;93:12355–12358. - PMC - PubMed
    1. Liu Y, et al. Suppression of Fas-FasL coexpression by erythropoietin mediates erythroblast expansion during the erythropoietic stress response in vivo. Blood. 2006;108:123–133. - PMC - PubMed
    1. Chen K, et al. Resolving the distinct stages in erythroid differentiation based on dynamic changes in membrane protein expression during erythropoiesis. Proc Natl Acad Sci U S A. 2009;106:17413–17418. - PMC - PubMed
    1. Hara H, Ogawa M. Erythropoietic precursors in mice under erythropoietic stimulation and suppression. Exp Hematol. 1977;5:141–148. - PubMed
    1. Gregory CJ, McCulloch EA, Till JE. The cellular basis for the defect in haemopoiesis in flexed-tailed mice. III. Restriction of the defect to erythropoietic progenitors capable of transient colony formation in vivo. Br J Haematol. 1975;30:401–410. - PubMed

Additional References for Methods section

    1. Zilionis R, et al. Single-cell barcoding and sequencing using droplet microfluidics. Nat Protocols. 2017;12:44–73. doi: 10.1038/nprot.2016.154. http://www.nature.com/nprot/journal/v12/n1/abs/nprot.2016.154.html-suppl.... - DOI - PubMed
    1. Ester M, Kriegel H, Sander J, Xu XI. Conf on Knowledge Discovery and Data Mining. :226.
    1. Daszykowski M, Walczak B, Massart DL. Looking for natural patterns in data: Part 1. Density-based approach. Chemometrics and Intelligent Laboratory Systems. 2001;56:83–92. doi: http://dx.doi.org/10.1016/S0169-7439(01)00111-3. - DOI
    1. van der Maaten L. Accelerating t-SNE using Tree-Based Algorithms. Journal of Machine Learning Research. 2014;15:3221–3245.
    1. Macosko EZ, et al. Highly Parallel Genome-wide Expression Profiling of Individual Cells Using Nanoliter Droplets. Cell. 2015;161:1202–1214. doi: 10.1016/j.cell.2015.05.002. - DOI - PMC - PubMed

Publication types

MeSH terms

Substances