. 2018 Feb 21;13(2):e0191278.
doi: 10.1371/journal.pone.0191278. eCollection 2018.

Bioerosion by pit-forming, temperate-reef sea urchins: History, rates and broader implications

Affiliations

Bioerosion by pit-forming, temperate-reef sea urchins: History, rates and broader implications

Michael P Russell et al. PLoS One. .

Abstract

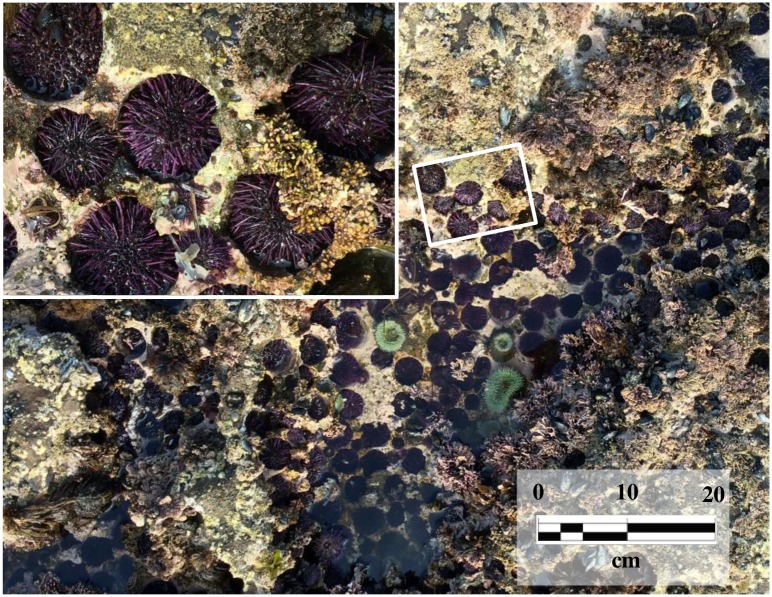
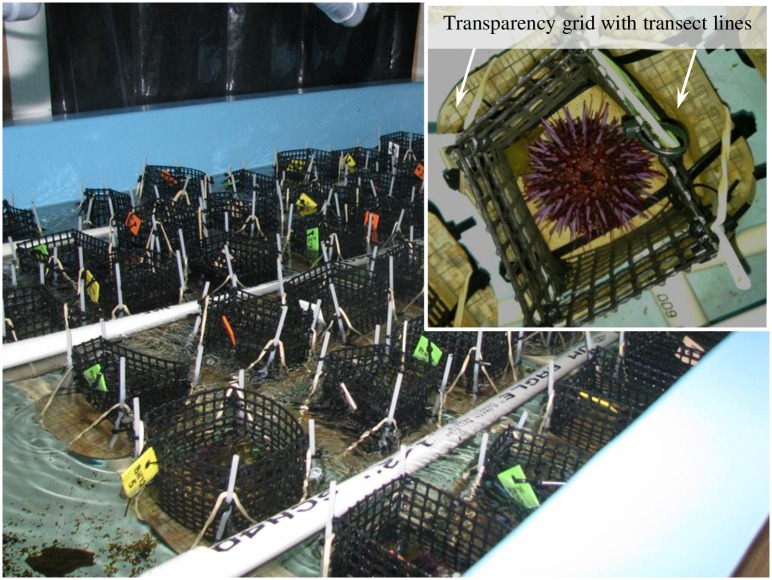
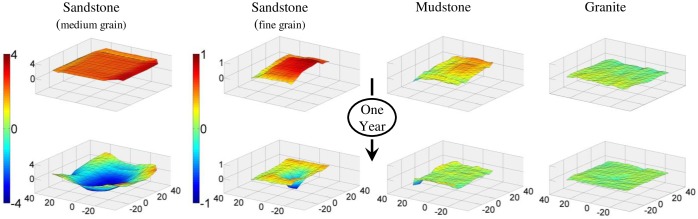
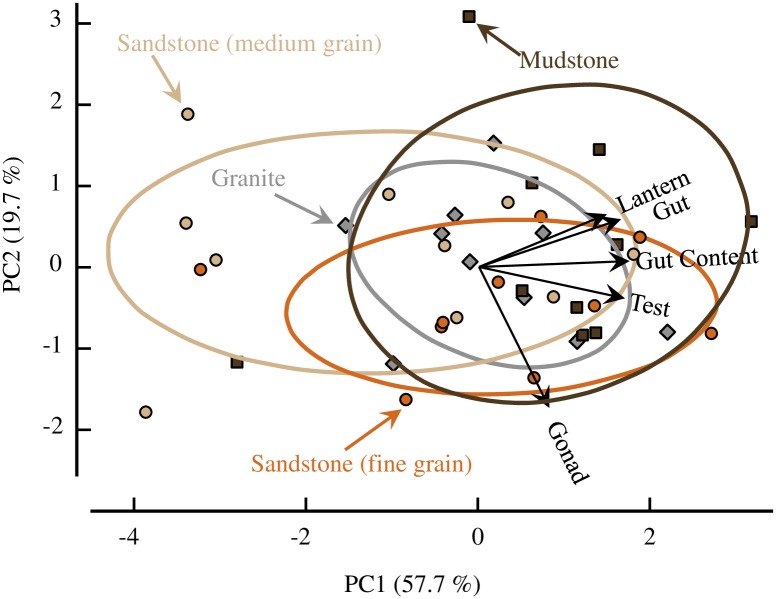
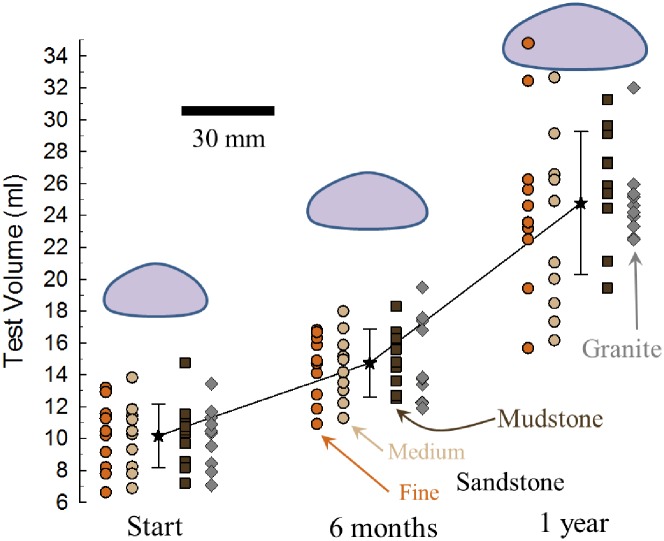
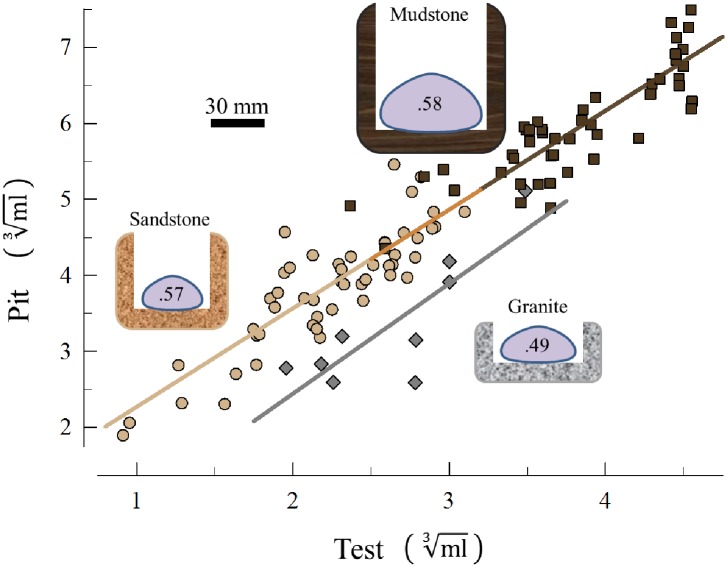
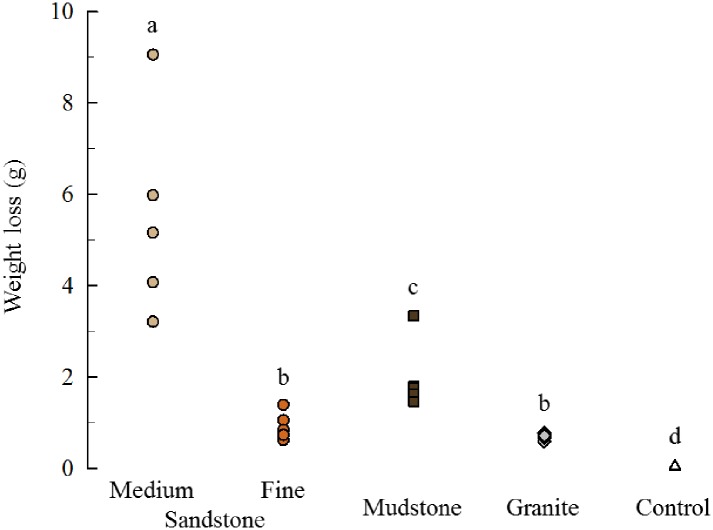
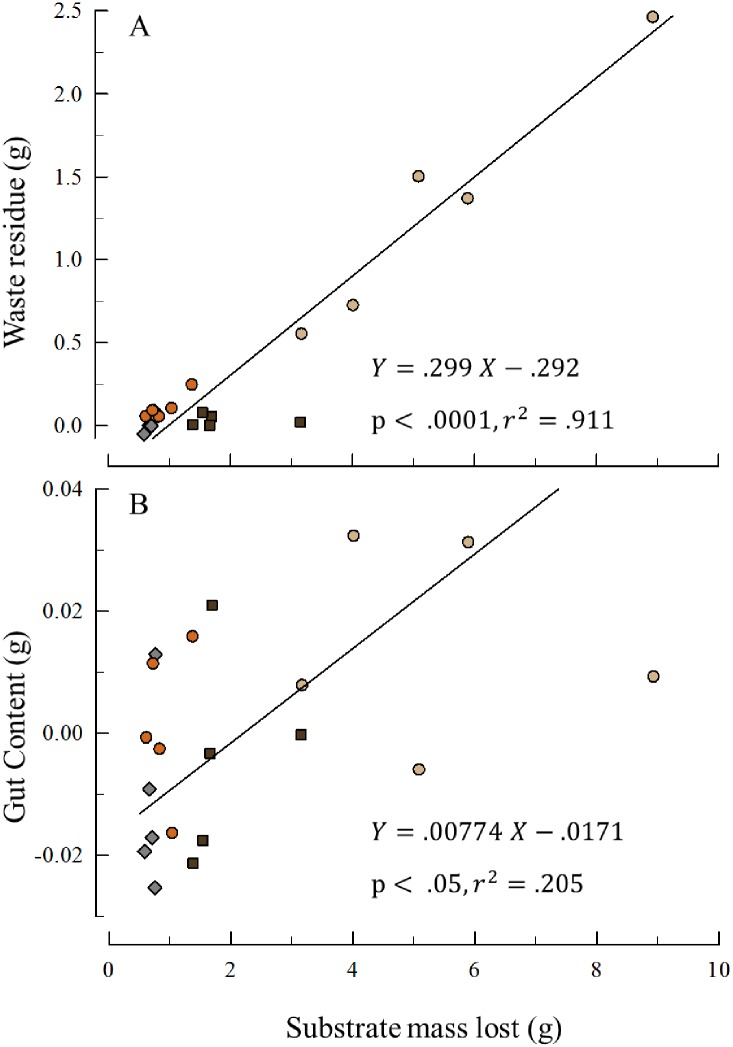
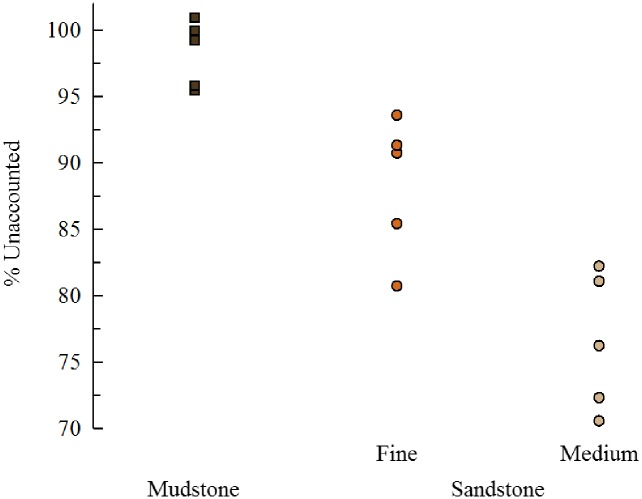
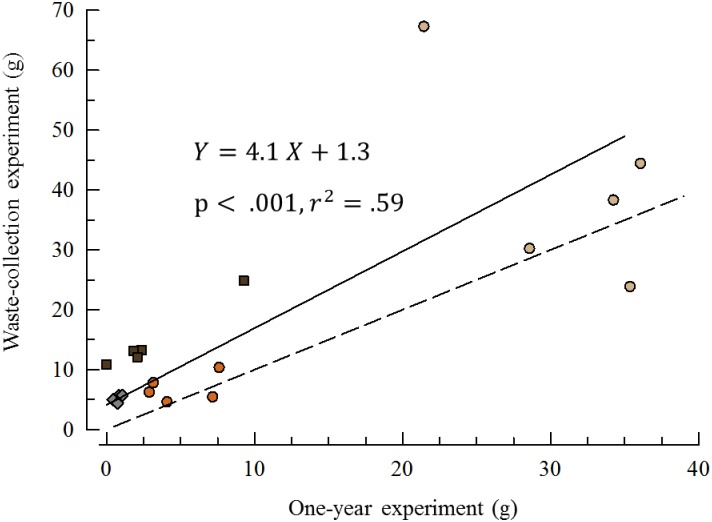
Sea urchins are dominant members of rocky temperate reefs around the world. They often occur in cavities within the rock, and fit so tightly, it is natural to assume they sculpted these "pits." However, there are no experimental data demonstrating they bore pits. If they do, what are the rates and consequences of bioerosion to nearshore systems? We sampled purple sea urchins, Strongylocentrotus purpuratus, from sites with four rock types, three sedimentary (two sandstones and one mudstone) and one metamorphic (granite). A year-long experiment showed urchins excavated depressions on sedimentary rocks in just months. The rate of pit formation varied with rock type and ranged from <5 yr for medium-grain sandstone to >100 yr for granite. In the field, there were differences in pit size and shapes of the urchins (height:diameter ratio). The pits were shallow and urchins flatter at the granite site, and the pits were deeper and urchins taller at the sedimentary sites. Although overall pit sizes were larger on mudstone than on sandstone, urchin size accounted for this difference. A second, short-term experiment, showed the primary mechanism for bioerosion was ingestion of the substratum. This experiment eliminated potential confounding factors of the year-long experiment and yielded higher bioerosion rates. Given the high densities of urchins, large amounts of rock can be converted to sediment over short time periods. Urchins on sandstone can excavate as much as 11.4 kg m-2 yr-1. On a broader geographic scale, sediment production can exceed 100 t ha-1 yr-1, and across their range, their combined bioerosion is comparable to the sediment load of many rivers. The phase shift between urchin barrens and kelp bed habitats in the North Pacific is controlled by the trophic cascade of sea otters. By limiting urchin populations, these apex predators also may indirectly control a substantial component of coastal rates of bioerosion.


Conflict of interest statement

Competing Interests: The authors have declared that no competing interests exist.

Figures

Fig 1
Fig 1. Rocky intertidal pool.
Purple sea urchins occur in high densities in the intertidal and shallow subtidal where many are nestled in cavities (“pits”) carved out of the rock substratum. The “hand-in-glove” fit of the urchins to the pits is apparent upon close examination (inset). The sedimentary sandstone at this site (Bean Hollow, California, USA) is typical of many sites along the west coast of North America. The exposed rocks at this site are of the Upper Cretaceous Pigeon Point Formation, which is part of the Franciscan Complex that makes up much of the central coast of California.
Fig 2
Fig 2. Oblique view of the sea table and experimental layout.
Each experimental unit was secured to a PVC-grid on the bottom of the table (not visible, covered by units); the 3 pipes of the sprinkler-system that delivered filtered seawater are visible. For each replicate, the plastic cages surrounding the rocks were secured to the epoxy units with cable ties and plastic posts. The cages restricted urchin movement to the rock surfaces. An overhead view of a single replicate (inset) shows an urchin on one of the sandstone (fine-grain) surfaces and the standardized grid lines for the perpendicular transects used to quantify surface topography. We used a carpenter’s contour gauge along these transects to measure the height of the rock (every 0.5 cm) above the epoxy base. These topographic data were used to generate three-dimensional surface plots and calculate rugosity at the start and conclusion of the experiment.
Fig 3
Fig 3. Three dimensional surface plots.
Rock substrates used in the one-year experiment. Units on all axes are mm and plots are means (n = 10) at the start (top) and after the exposure of each replicate to a single grazing sea urchin for one year (bottom). The medium-grain sandstone showed the most intense levels of bioerosion and pit formation and the relief (color) z-axis scale is 4x the scale for the fine-grain sandstone, mudstone, and granite.
Fig 4
Fig 4. Principal component analysis.
The first two principal components accounted for 77.4% of the variation. The four treatments (n = 10) are distinguished by different colored symbols which match the colors of the 68% confidence ellipses for each group: sandstone = circles (tan = medium-grain, orange = fine-grain); mudstone = brown squares; granite = gray diamonds. Vectors of loadings for the five different body components are also plotted (black arrows).
Fig 5
Fig 5. Sea urchin growth during one-year experiment.
Test volume based on modified oblate spheroid estimate from test height and diameter [31]. Sandstone = circles (tan = medium-grain, orange = fine-grain); mudstone = brown squares; granite = gray diamonds (n = 10 each treatment). The black stars are the means (± sd) of all urchins at each time point. The urchin silhouettes are scaled-sizes of the average diameter and height for each of the three sampling time points (30 mm scale).
Fig 6
Fig 6. Field estimates of sizes of pits and urchin occupants.
Cube-root of pit volume plotted against cube-root of test volume of urchin occupant. Sandstone = tan circles (n = 50); mudstone = brown squares (n = 47); granite = gray diamonds (n = 9). ANCOVA revealed no significant difference in slopes and the same regression described all three data sets (r2 = 0.91, F1,95 = 956.7, p<0.0001). Least squared means of sandstone and mudstone were not significantly different from each other but both were significantly different from granite. The silhouettes of urchins and pits are scaled-sizes of the average diameter and height of urchins, and depth and width of the pits. The urchin silhouettes contain the average height:diameter ratios of the tests, which had the same pattern (no difference between sandstone and mudstone, but both sedimentary rocks were different from granite).
Fig 7
Fig 7. Dry weight change.
The mass lost from each treatment was significantly greater than zero in all but the glass controls. The different letters above the data points indicate groups that are significantly different. Sandstone = circles (tan = medium-grain, orange = fine-grain); mudstone = brown squares; granite = gray diamonds; glass = open triangles (n = 5 each treatment).
Fig 8
Fig 8. Inorganic weights from bioerosion.
A. Waste residue from bioerosion. The inorganic weight after the fraction from fecal pellets subtracted. B. Gut Content from bioerosion. The inorganic weight after the fraction from ingested algae subtracted. In both plots sandstone = circles (tan = medium-grain, orange = fine-grain); mudstone = brown squares; granite = gray diamonds (n = 5 each treatment).
Fig 9
Fig 9. Unaccounted rock block change.
Percent of the inorganic weight change in the rock block units not accounted for by the inorganic weight of the residue + inorganic gut content. All three groups are significantly different from each other (F2,12, p < .0001; Tukey HSD test). The rock with the smallest grain size (mudstone) has the highest percentage missing and medium-grain sandstone with the largest grain size the least percentage. Sandstone = circles (tan = medium-grain, orange = fine-grain); mudstone = brown squares (n = 5 each treatment).
Fig 10
Fig 10. Bioerosion comparison between the two experiments.
The rock block units were the same in each experiment so two estimates of bioerosion were derived for each. The values of the waste-collection experiment were prorated to the time frame of the one-year experiment (multiplied by 52/7). The dashed line (slope = 1) predicts the relationship if the two experiments yielded the same rates. The solid line fits the data with a Standard Major Axis (Model 2) regression. Both the slope and intercept of this regression show erosion rates were faster in the waste-collection experiment for all treatments. Sandstone = circles (tan = medium-grain, orange = fine-grain); mudstone = brown squares; granite = gray diamonds (n = 5 each treatment).

References

    1. Harrold C, Pearse JS. The ecological role of echinoderms in kelp forests In: Jangoux M, Lawrence JM, editors. Echioderm Studies 2. Rotterdam: A. A. Balkema; 1987. pp. 137–234.
    1. Himmelman JH, Cardinal A, Bourget E. Community development following removal of urchins, Strongylocentrotus droebachiensis, from the rocky subtidal zone of the St. Lawrence Estuary, Eastern Canada. Oecologia. 1983;59:27–39. doi: 10.1007/BF00388068 - DOI - PubMed
    1. Lawrence JM. On the relationships between marine plants and sea urchins. Oceanogr Mar Biol Annu Rev. 1975;13:213–86.
    1. Paine RT. Food webs: linkage, interaction strength and community infrastructure. J Anim Ecol. 1980;49(3):667–85.
    1. Steneck RS. Sea urchins as drivers of shallow benthic marine community structure. In: Lawrence JM, editor. Sea Urchins: Biology and Ecology. 2013;38:195–212.

Publication types